 Rui Zhang1Ming Gao1*Mao Fan2
- 1State Grid Xinjiang Economic Research Institute, Ltd., Urumqi, China
- 2State Grid Xinjiang Power Co., Ltd., Urumqi, China
The study of the movement of pollutants through ducts facilitates the assessment and control of ambient air quality problems (AQ). Among other things, understanding the deposition and distribution of particulate matter in elbows is important for practical engineering applications. In this study, the turbulent flow field and particle deposition in a 90° bend is investigated using RANS simulation. The RNG k-ε turbulence model was employed to calculate the airflow flow field and the discrete phase model (DPM) was used to simulate the particle phase motion. Where for the discrete phase, the Discrete Random Wander (DRW) model was considered and the deposition of particles with sizes of 1, 3, 5, 10, 20, and 40 μm in the flow field was investigated separately. Grid-independent validation of the models used in the simulations was performed. The effects of inlet velocity, particle size, and direction of gravity on the flow field and particle deposition in the elbow were considered. The results show that the flow field in the bend is strongly influenced by the above parameters. Among them, the turbulent disturbance in the bend section is the most intense, with high turbulent energy value, and it is also the region with the largest energy loss. The inlet velocity is negatively correlated with the deposition rate, and the particle size is positively correlated with the deposition rate.
1 Introduction
The structure and flow performance of the exhaust system of an automobile engine have a direct impact on the engine’s power, economy and emissions. The current research on the exhaust pipe is mainly focused on the flow calculation of the fluid inside the exhaust pipe. Zhao et al. (Zhao et al., 2016) analyzed the particle motion in the exhaust pipe of a mobile vehicle by numerical simulation combined with k-ε turbulence model and Eulerian transport model. The results show that coagulation has a considerable effect on particle dispersion in the region less than 0.2 m from the exhaust pipe compared to dilution. Huang et al. (Huang et al., 2014) proposed a method of applying periodic boundary conditions to study the dispersion of pollutants in the exit region of a vehicle tailpipe duct. The results surface that the introduction of Atmospheric Boundary Layer (ABL) conditions in activity-based emission models may improve their performance in estimating UFP traffic emissions. Keita et al. (Keita et al., 2023) investigated a simplified two-phase flow problem for vehicle exhausts using numerical simulation. The URANS model and the Lagrangian particle method were used for the prediction of two-phase flow. The results show that the ultrafine particle concentration decreases with distance from the emission point. Particle flow usually involves piping in many industries, and actual engineering buildings, where bends are ubiquitous and more likely to fulfill the requirements of flexible arrangements, are among the most important components in engineering.
Pollutants emitted from the rear of automobiles cause great pollution to the urban environment, in which the emitted particulate matter is the main source of PM2.5 and PM10 in the air. Therefore, the study of the distribution and deposition of particulate matter in the automobile exhaust system has certain scientific significance and engineering application value. Numerous researchers have studied the exhaust system. Inside HAVC (Heating, Ventilation, and Air Conditioning) systems, (Zheng et al., 2021), sections are typically used to alter the direction of flow and join straight ducts. Internationally, many researchers have done a lot of experimental studies on particle deposition inducts. McFarland et al. (McFarland et al., 1997) investigated the characteristics of aerosols traversing a curve using experimental and computational methods. They verified the need for turbulence to be incorporated into particle tracking models. They also found that the Reynolds number affects aerosol penetration. In the practical engineering application represented by the automobile tailpipe, the working conditions are very complicated. Particle deposition experiments on automobile tailpipes do not give clearer results. There have been many experimental validations of the RANS model in existing studies. Therefore, this study uses the more mature RANS simulation method. And the obtained simulation results can clearly reflect the movement of particles in the bend pipe. In contrast, it is more difficult to obtain such laws through experiments. Peters et al.'s (Peters and Leith, 2004) investigation focused on the features of particle deposition in industrial bends. The distribution of the deposited particles’ sizes was measured. The study’s bends’ shape and flow characteristics were comparable to those found in industrial ventilation. Study results apply to droplets and solid particles with viscous duct walls Sippola et al. (Sippola and Nazaroff, 2005) examined how ventilation duct particle deposition rates were affected by turbulence characteristics. They measured particle deposition rates in a laboratory duct system. They found that an increase in wind speed enhanced particle deposition. This improvement was more pronounced at the duct’s top and walls than at its bottom. Chu et al. (Chu et al., 2010) investigated the particle flow characteristics in microchannels. The aspect and curvature ratios of the microchannels vary. Drawing on experimental data, they put out an empirical equation. The frictional pressure loss in curved rectangular microchannels might be more accurately predicted by this equation. Sluše et al. (Sluše et al., 2021) investigated the technique of measuring the gas-phase flow velocity in ducts. They further improved the measurement accuracy by laser Doppler technique. Lin et al. (Lin et al., 2015) studied the corrosion phenomenon in the inner wall of oil and gas pipelines. It was found that the content of particulate matter in each component of the pipeline is an important reason for the corrosion of the inner diameter of the pipeline. Based on this finding they proposed a pipeline erosion prediction model. Pei et al. (Pei et al., 2018) studied the flow trajectory of particulate matter at pipeline elbows. They also analyzed the flow field of particulate matter. The maximal erosion zone and particle matter diameter were found to be strongly correlated in the results.
Researchers have also conducted several numerical studies on the flow characteristics in curved pipelines. Sun et al. discovered the impact of rebound on the rate of particulate matter deposition. (Sun et al., 2011a). This study used a one-way coupling method and a Lagrangian particle model. They studied the rebound process of particulate matter in a vertical two-dimensional ventilation duct. El-Behery et al. (El-Behery et al., 2009) found that the RNG-based k-ε model outperforms other models for simulating the flow behavior of particulate matter. Guo et al. (Guo et al., 2020) used the RNG k-ɛ turbulence model to study the effect of the shape of the bend on the deposition of particulate matter. They found that round bends were better for deposition. Inthavong (Inthavong, 2019)studied the deposition process of micron-sized particles. They found that particle size is the main deposition rate influencing factor. Bass et al. (Bass and Worth Longest, 2018)proposed a set of guidelines from the gridding point of view. This work can optimize the CFD model solution process for microparticle deposition. Nicolaou et al. (Nicolaou and Zaki, 2016)investigated the deposition process of drug particles in the human respiratory system. This study can enhance the efficiency of inhaled drug delivery. The results of the study can also be used to assess the toxicity of air pollutants. Hongtao et al. (Hongtao and Li, 2011) investigated the effects of pipe bending curvature and gas velocity on particle deposition characteristics. They found that increasing the particle Stokes number enhances the deposition rate of particulate matter.
Particulate matter is widely used in both technical and natural environments. The air is frequently filled with suspended tiny particles, such as smoke, dust, fog, haze, and other particles that pollute the environment. Dust is defined by the International Organization for Standardization as solid suspended matter having a particle size of less than 75 μm (GB/T15604-2008). Dust particles are the main pollution factor in urban environment (Hong et al., 2020). These fine particles are produced by pulverized coal burning in power plants, car exhaust and smoke emissions from buildings. Their joint discharge causes a sharp increase in dust particles in large balloons, causing serious harm to urban air quality and affecting human health (Huang et al., 2021).
Natural and industrial production processes frequently involve gas-solid two-phase flow, particularly in the context of pneumatic conveying systems and engine combustion chambers, among other applications. Peng et al. (Peng and Cao, 2016)found that solid particles rebound from the wall at the elbow and secondary collision occurs, and form a V-shape erosion pattern at the collision place. According to Noorani et al. (Noorani et al., 2013), particles in the middle of the pipe will exit the tandem elbow before particles close to the wall and the elbow collision. And then they move together to form an elliptical erosion pattern downstream. Subsequently, both of them move together to form an elliptical erosion pattern downstream. By dividing 38 curves along the direction of fluid flow, Solnordal et al. (Solnordal et al., 2015) obtained the three-dimensional morphology of the elbow after erosion and wear using a coordinate measuring instrument. By comparing the difference between the erosion rates on each curve, they came to the conclusion that the erosion pattern of the smooth-wall elbow changes with the trajectory of the particles.
The demands of industrial production and the environment make a thorough understanding of particle deposition more and more crucial. Currently, the majority of researchers investigate the deposition of granular materials in river channels using numerical modeling techniques and experimental techniques. The settling zones (diffusion zones, diffusion collision zones, and inner buffer zones) of horizontal channel turbulence are described empirically by Sun et al. (Sun et al., 2011b). When Liu and Agarwal’s empirical formula and the aforementioned empirical formula are compared, Sippola (Guo et al., 2020) finds that Wood’s empirical formula is more in line with the experimental findings. Sommerfeld and colleagues (Soleimani et al., 2015) carried out an experimental investigation utilizing a gas particle to examine the flow within a confined channel from two perspectives: the distribution of particle velocity and the loss of pressure. They discovered that when a channel is rougher, the particles are dispersed more uniformly.
Up until now, a great deal of study has been done on the gas-solid two-phase flow in the bend using both simulations and experiments. In a small diameter bend having a circular cross-section, Pui et al. (Pui et al., 1987) experimentally assessed the deposition effectiveness of liquid particles under various Reynolds numbers. They found that the deposition efficiency of the particle was independent from the Reynolds number under turbulent conditions, and an empirical model was proposed to predict the deposition efficiency. Sun et al. (Sun and Lu, 2013) conducted an experimental investigation on the deposition of particles in a 90° square bend with a side length of 10 cm. The impact of the wall material, Reynolds number, and input mass concentration on the dimensionless particle concentration distribution at the bend outlet’s symmetric line was examined. In an experimental study, Li et al. (Li et al., 2013)examined the pattern of particle deposition on the 180°square bend’s inner bend wall. A deeper examination of the particle deposition during the trials proved to be quite difficult because of the intricate gas-solid two-phase flow characteristics in the 90°bend.
Bends are also widely used in energy and power, chemical, construction and other engineering fields, but also a common component in the gas-solid two-phase flow piping system. A considerable number of researchers have been carried out in these fields. On the basis of these studies, this paper numerically simulates the gas-solid two-phase flow in a 90° square elbow in an automobile tail-discharge system in order to understand the physical process of particulate flow under different operating conditions. In this paper, the flow field flow under three different inlet velocity conditions (8 m/s, 12 m/s and 16 m/s) as well as the particle distribution behavior and deposition characteristics for six particle size groups (1, 3, 5, 10, 20 and 40 μm) are investigated. In this paper, the Eulerian conservation equations are used to control the airflow, the Renormalization group (RNG) k-ε turbulence model with anon-equilibrium wall model is applied. The Discrete Phase Model (DPM) is used to simulate the fly ash soot flow to investigate the flow and deposition characteristics of the bends with different gravitational orientations. The simulation results were compared with the conclusions of the researchers. It is shown that the distribution and deposition of particulate matter in bends can be reasonably predicted using this method. This study will contribute to the understanding and application of particulate flow in bend systems. The main application is to characterize the deposition of particulate matter in automobile exhaust pipes. The value of the application is reflected in the fact that the conclusions drawn from this study can optimize the morphological design of exhaust pipes and are partially feasible in engineering applications. It can provide theoretical guidance for the design of exhaust pipes. And it is expected to realize the goal of alleviating regional air pollution.
2 Numerical simulation methods
The Reynolds-averaged Navier-Stokes (RANS) equations approach, large eddy simulation (LES), and direct numerical simulation (DNS) are now the three primary types of methodologies based on numerical modeling of turbulent fluids. (Tian and Ahmadi, 2007). In order to explore the hydrodynamic properties of a curved pipe, the behavior of flow and deposition in a curved pipe is investigated in this paper using numerical simulation, as shown in Figure 1. For the fluid inside the bent pipe, which is identified as being steady-state, three-dimensional, incompressible turbulent flow, (Rohdin and Moshfegh, 2011), each part is described separately as follows.
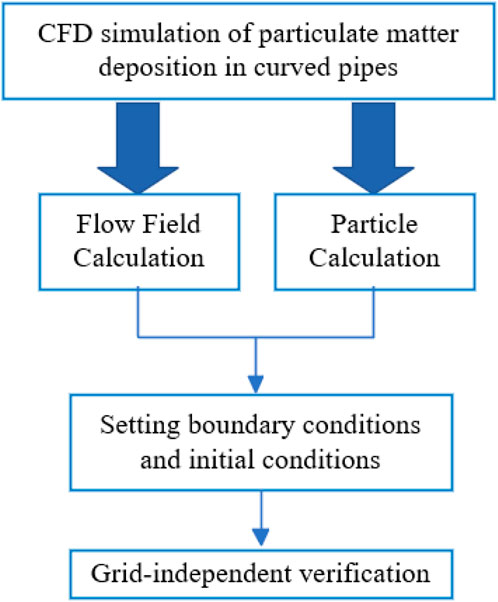
Figure 1. Simulation and modeling technology roadmap.
2.1 Turbulence modelling of air
The conservation of mass, momentum, and energy affects the spatial distribution of species, temperature, and airflow in the bend region. To account for the impacts of density fluctuations, buoyancy effects are incorporated into the momentum equations, controlling the time-averaged equations as follows:
where
To close the system of equations, these unknowns must be represented. This is done by incorporating the Businisk hypothesis and eddy viscosity. (Warner et al., 2022).
The general purpose CFD code FLUENT is used in this research to represent the Euler conservation equation, which controls the airflow. For ventilation duct applications, the Reorganization Group (RNG) k-ε turbulence model with non-equilibrium wall model is utilized because it is reliable and easy. For fully developed turbulent flow RNG k-ε model is utilized which belongs to the turbulence model with high Reynolds number, near wall region as well as low Reynolds number flow, specific approaches such as wall function method and low Reynolds number 0 model are taken.
For the RNG model, the transport equations of k and ε are provided by (ANSYS, Inc, 2011):
The value of
The effective dynamic viscosity is represented by
The wall function method was introduced by Spalaing and Launder in 1974. (Spalding et al., 1974). The method mainly consists of partial differential equations and is not solved for turbulent quantities in the near-wall region. Physical quantities on the wall surface are related to those within the turbulent core area using an engineering semi-empirical formulation. Additionally, the first layer’s mesh node count is adjusted to fall within the range of logarithmic law layers rather than using the standard encryption in the near-wall region. The relationship between the established wall surface values and the function values is as follows: (Zou, 2013):
where
2.2 Turbulence modelling of particle flows
The use of CFD software Fluent to study the suspension and deposition of particles has been successfully validated by Zhang and others (Zhang et al., 2020). Three basic mechanisms contribute to the deposition of particles in a wall with a certain roughness: the particles move continuously in the flow field, they rebound or adhere to the rough inner wall, and they escape at the flow field’s exit. As the particles move through the flow field in the pipe, they are mainly subjected to the particles’ own gravity, contact forces, non-contact forces, and fluid-particle interactions. Contact forces include contact adhesion and collision forces. In the vortex cluster area, the interacting forces include buoyancy, Brownian force, Saffman lift, and thermophoretic force (Wang, 2014). Both the spurious mass force and the pressure gradient force acting on the particles are negligible in our work. Thus, these forces’ impact on the particles is disregarded.
To make inter-particle interactions simpler to ignore, dilution of the particle phases is postulated. Furthermore, it is believed that every particle is a spherical solid. The one-way coupled Lagrangian trajectory approach was used to solve the equations of motion of the plasmas established by Newton’s force balancing law based on these hypotheses. The particle equations incorporate significant forces like gravity and drag.
The trajectory of the particle is obtained by integrating the force balance on the particle, and its expression is as follows: (Maxey and Riley, 1983):
The particle location vector (m) is represented by
The drag force
Since particles are thought to be spherical, drag coefficient
where the values of constants
In this simulation, the only factors influencing particle motion are drag, buoyancy, and gravity. When it comes to submicron particles, lift and Brownian forces play significant roles. Nevertheless, these forces are insignificant because the particle diameter range that the current study examines is 3–30
Since no kinetic energy is assumed to be lost and mechanical energy is fully conserved during particle collisions, they are called perfectly elastic collisions. Figure 2 illustrates the particle collision model. (Zhao et al., 2004). The coefficient of recovery e is defined as follows, at this point e = 1:
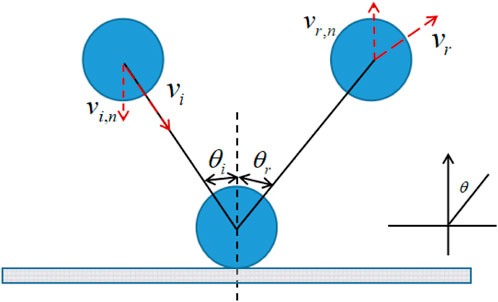
Figure 2. Particle-wall collision process diagram.
Where
The Lagrangian trajectory tracking approach was used to solve the particle’s equations of motion. The following equation contains the particle phases’ equilibrium sluhese trajectories were determined to comply with Newton’s second law.
The parameters in this equation are the particle mass
2.2.1 Trailing force
Drag is the force created by the relative velocities of the fluid and the solid object.
This force opposes the fluid’s velocity when a solid travels at it. Consequently, the drag force is the primary force that the fluid applies to the motion of the particles. (Huang et al., 2017). Its formula is:
The relaxation time of the particle
where
Cunningham’s slip correction coefficient
2.2.2 Gravity and buoyancy
When traveling through the flow field, particles are impacted by gravity, which causes them to sink until they are deposited on the wall. Due to the tiny size and mass of particles, buoyancy also plays a significant role in particle motion. The calculation formula is as follows:
2.2.3 Brownian
Brownian force (Ueda, et al., 2012; AlQdah et al., 2021)is formed by the random diffusion of nanoparticles, where the Gaussian random function is incorporated into the calculation expression of the Brownian force FB, and the formula for its computation is as follows:
where
In this paper, the instantaneous velocity of the fluid is determined by using a discrete random walk (DRW) model. The effect of instantaneous turbulent velocity changes on particle trajectories is included in the DRW model. The particle spreading due to fluid turbulence is calculated from the instantaneous velocity u due to fluid velocity pulsations. The interaction between particles and discrete vortices of the fluid is further considered in the DRW model. For the Reynolds stress model, the derivation process of the pulsation velocity takes into account the anisotropic character of the Reynolds stress with:
The ς is a random number obeying a normal distribution, and
3 Case description and solution method
3.1 Numerical verification
The numerical validation results of the deposition efficiency of 90° bends at different temperatures are given in Figure 3., using the present model to compare with the experimental data of (Pui et al., 1987). and the simulation results of (Zhang et al., 2012; Guo et al., 2020), respectively. It can be found that the results are well fitted and combined with Figure 3., it can be seen that the numerical model in this study is reliable.

Figure 3. Numerical validation of particulate deposition rates.
Further, Figure 4 shows the specific error between the experimental results and the particulate deposition rate in this study. The calculation results showed that 85% of the simulation data were within ±10% of the experimental results. In practical engineering applications, the above errors are acceptable.
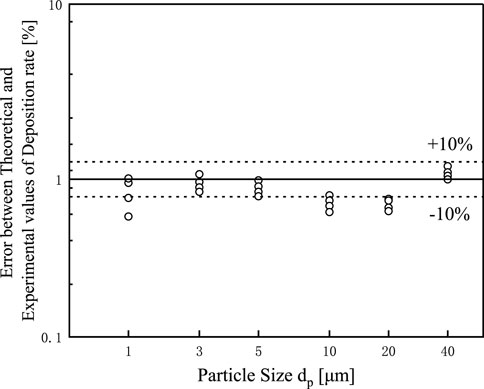
Figure 4. Error in deposition rate between theoretical and experimental values.
3.2 Case description
To make the analysis easier, the curved pipe is separated into three sections: the downstream straight segment, the curved section, and the upstream straight section (Figure 5 shows the model structure). The curved section α = 0°at the entrance. The downstream straight section’s length is extended by 5 m to guarantee that there are no backflow phenomena at the exit, and Table 1 illustrates the bent pipe’s shape.
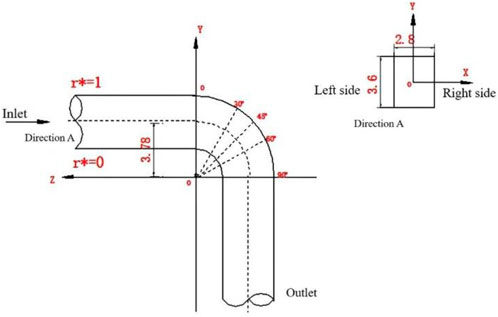
Figure 5. Horizontal to vertical downward bending pipe model structure diagram.

Table 1. Geometric dimensions of the bent pipe.
3.3 Setting of boundary conditions
Velocity inlet selected as boundary condition for bend inlet wall. The velocity of the flue gas
3.4 Numerical calculation process
The airflow equations are solved using the RNG k-ε turbulence model without sliding walls (Nian et al., 2017). When handling intricate flows like those in the bend portion, the model performs better. Based on the particle flow equations, a Lagrangian stochastic particle tracking technique was applied for the particle phase. For each of the six particle size groups (1, 3, 5, 10, 20, and 40 μm) a mean of 40,000 monodisperse spherical particles that were evenly dispersed at the inlet were discharged and simulated. The density of the air and particles were 0.8288 kg/m3 and 2,790 kg/m3. Because of the air stream phase’s dilution of the particle phase. The one-way coupling approach was used to acquire all of the computational findings.
3.5 Structured grid and grid independence analysis
A structural mesh is one in which all internal points within the mesh area have the same adjoining cells. The mesh is typically a hexahedral mesh, which requires less computational memory. The mesh is neater, and closer to the actual model. So, this paper uses ICEM to divide the structural grid for the simulation of the bent pipe. Fluent software is used to establish the basic model of the bent pipe, and the overall mesh is divided. Because the complexity of the bending part of the encryption process varies depending on the bend section of the flow field, the first layer of the mesh height is set to 0.015 m, and the growth factor is set to 1.18 in order to further improve the accuracy of the operation in the near-wall area of the pipe. In order to achieve mesh independence, a total of five different grid numbers are used for calculation and comparison.
By comparing the results of different grid number, it is found that when the number of grids is greater than 560,000, the change in sedimentation rate is very small, at this time the change in the number of grids on the calculation of the results of the impact is small, that 560,000 of the number of grids to achieve grid independence, so this paper adopts the number of 560,000 of the mesh, the specific division of the situation is as follows: Figures 6, 7, the grid independence test is as follows: Figure 8.
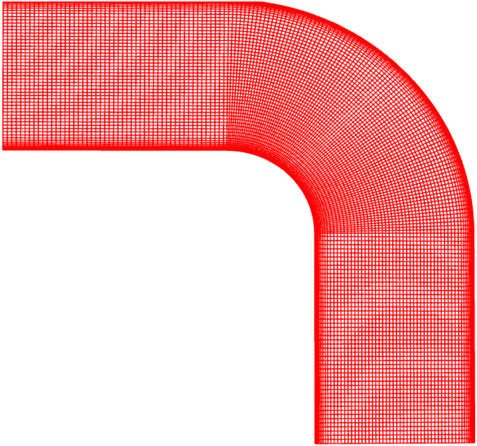
Figure 6. Lateral mesh division.
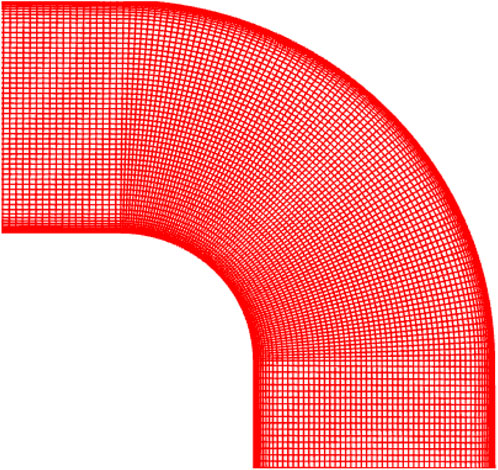
Figure 7. Local mesh division.

Figure 8. Mesh independence check.
4 Results and discussion
4.1 Flow field analysis of the smoke-containing gas stream
As shown in the pressure distribution cloud from left to right in Figure 9, the pressure generally tends to increase as the velocity increases from 12 m/s to 16 m/s. When the speed is 12 m/s, the inlet pressure of the elbow is 110Pa, the outlet pressure is 100Pa, and the pressure difference is 10Pa. When the speed is 16 m/s, the inlet pressure of the elbow is 200Pa, the inlet pressure is 180Pa, and the pressure difference is 20Pa. This shows that the overall pressure loss in the elbow increases with the increase in speed. (Hu, 2017). It is due to the increased resistance to flow in the elbow as the velocity increases.
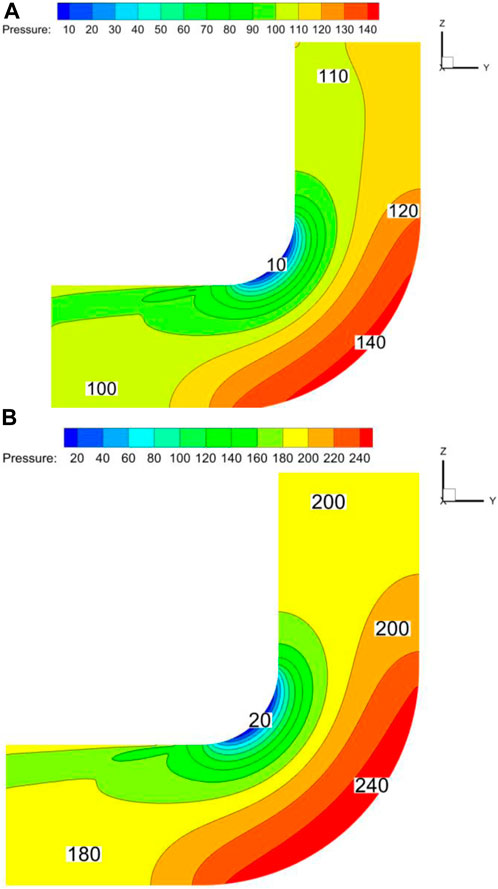
Figure 9. Pressure distribution cloud at the center section of the elbow under different speeds. (A) 12 m/s, (B) 16 m/s.
The bend’s inner wall surface area has the lowest fluid pressure there. The outermost region of the curve experiences the maximum pressure. Compared to the inner wall, the outside wall is under substantially more pressure. From the inner curved side wall surface to the outside curved side wall surface area, it is evident that the pressure progressively increases. When the flow passes through the downstream straight portion, the pressure on the curve’s outer wall gradually drops. This pressure rise occurs close to the bend. Additionally, when water passes through the downstream straight segment, pressure builds up initially on the bend’s inner wall and then gradually increases. Particles are mostly susceptible to relative movement resistance force in the horizontal direction as they enter the bend inlet during the straight pipe portion of the movement. Particles are mostly affected by their own gravity while they are moving vertically. The majority of the particles are flung against the bend’s outer wall as they pass through the curved segment because of centrifugal force. This is because the high-pressure layer zone is broader than the low-pressure layer region, and kinetic energy is converted to hydrostatic energy.
4.2 Velocity field analysis of the smoke-containing gas stream
The distribution of flue gas velocity at the bend’s center section is taken into consideration for velocities of 12 m/s and 16 m/s, as seen in Figures 10, 11. In the straight segment upstream of the entrance, the distribution of flue gas velocity is more uniform. Low velocity zones can be found close to the bent section’s outer wall and the downstream straight section’s inner wall. The velocity at the curve’s outer wall drops initially and then gradually increases as it passes through the downstream straight stretch when it gets close to the bend. Once it passes through the downstream straight portion, the velocity near the bend’s inner wall gradually drops. The velocity at the outer side of the bend section is the smallest and the velocity at the inner side is the largest. This phenomenon indicates that the biggest disturbance between the gas-solid two-phase flow is in the bend section and is in opposition to the pressure distribution. The greatest kinetic energy loss has been caused by this. Particles clash with one another as they pass through the bent segment. Particle velocity steadily rises when it enters the downstream straight segment (Liu, 2018). Additionally, the fluid’s velocity at the bend’s center is higher than its velocity surrounding the near wall. This is due to the fact that a part of the kinetic energy that has been lost increases with the distance in the direction (the negative sign represents only the opposite direction, only the magnitude of the value is considered).
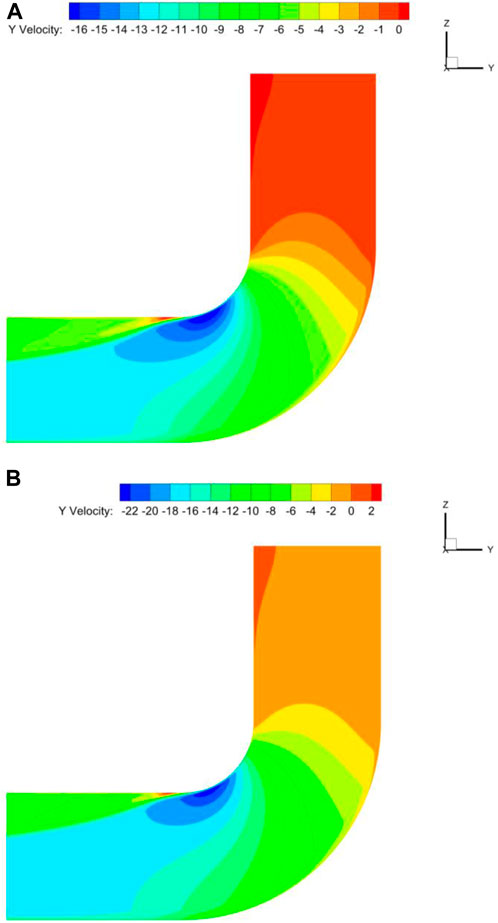
Figure 10. Bend center cross-section of different speeds in the Y direction of the velocity distribution of cloud diagrams. (A) 12 m/s, (B) 16 m/s.
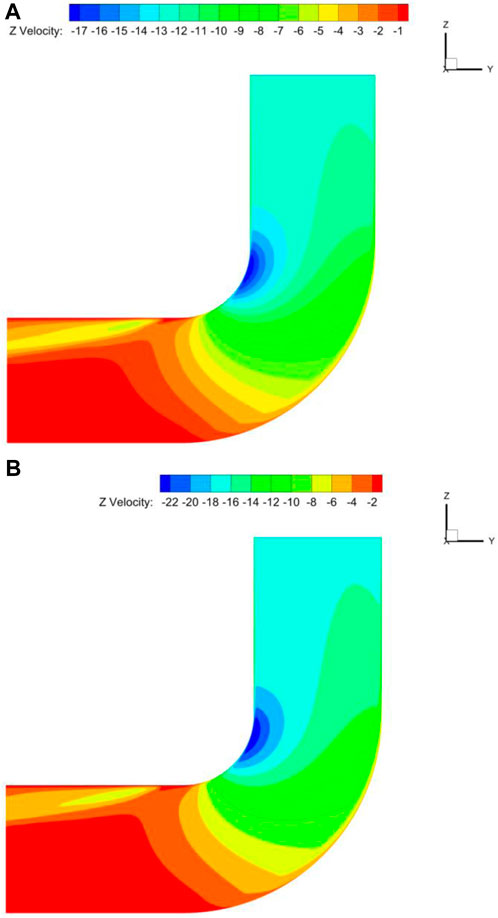
Figure 11. Bend center cross-section of different speeds in the Z direction of the velocity distribution of cloud diagrams. (A) 12 m/s, (B) 16 m/s.
Since the particle deposition rate in this study is highly correlated with particle velocity, pictures of the trajectory of the particulate matter in the bend and the flow of particulate matter are shown below. These two images can be added to illustrate the motion of the particulate matter in the Y direction and Z direction. Figure 12 is able to depict the actual trajectory of the particulate matter from a three-dimensional perspective. In addition, the relationship between the actual velocity of the particulate matter and the state of motion of the particulate matter can also be demonstrated by Figure 13.

Figure 12. Particulate trajectory map.
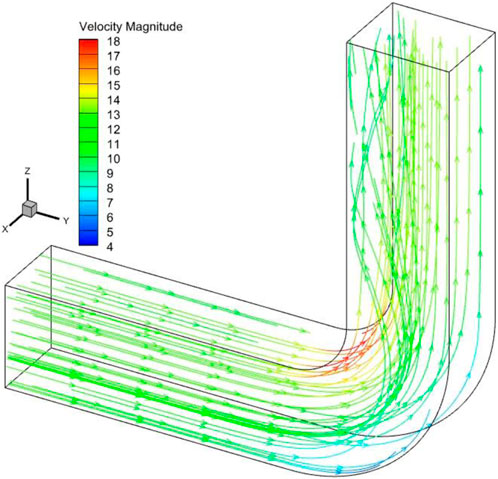
Figure 13. Particle velocity cloud map.
4.3 Turbulent kinetic energy analysis of the smoke-containing gas stream
From Figure 14, it can be clearly seen that the trajectory of particles in the downstream straight section near the outlet cross-section of the flow direction has changed. Here, vortex clusters are generated with secondary flow phenomena. The starting point of the secondary flow is near the outer wall. The particles flow along the outside of the bend towards the inside of the tube and a closed loop is formed (Morsi and Alexander, 1972). This is due to anisotropy, where the velocity and pressure distributions in the X, Y and Z directions are different, leading to backflow phenomena.
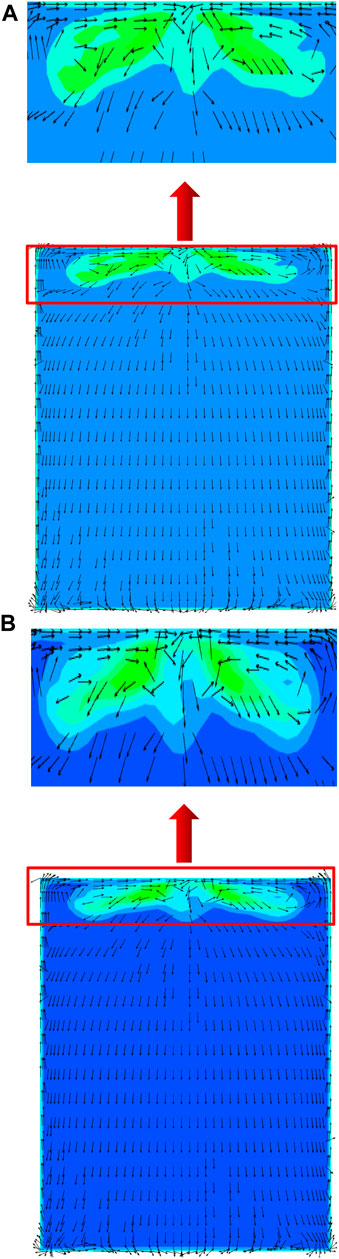
Figure 14. Cross-sectional vortex clusters near the outlet.
The turbulent kinetic energy distribution cloud diagram in Figure 15 illustrates how the turbulent kinetic energy at the center of the bend cross-section increases as the inlet velocity increases from 12 m/s to 16 m/s. Additionally, there is more turbulent kinetic energy close to the inner bend’s wall surface. This is due to a high impulse velocity particle collision between the wall and the bend. The flue gas and particles of the momentum exchange between the particles is quite powerful. The particles and the wall surface of the bend non-stop collision led to the particles of the phase of the energy loss is larger. The energy loss of the largest part of the section of the bend is the largest. Turbulence energy increases with increasing velocity. It shows that higher velocity has a large effect on particles and the flow field is highly turbulent with high degree of turbulence. Therefore, the fluid perturbation on the particles is large.
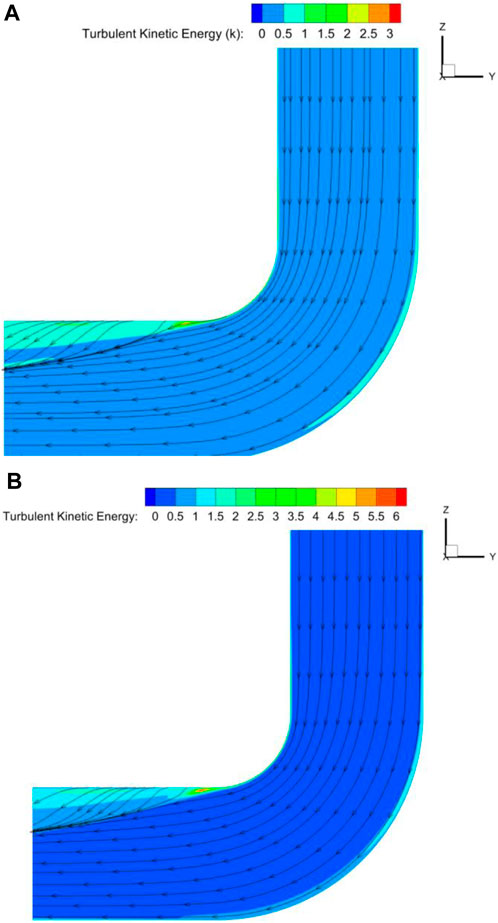
Figure 15. Cloud diagram of turbulent kinetic energy distribution at the center of the bend section. (A) 12 m/s, (B) 16 m/s.
4.4 Deposition rate of particles in the bend
Understanding and reducing particle deposition is aided by providing clarity on the location of particle deposition within the bent pipe. There are four wall surfaces in the square bend pipe: the upper and lower bend wall surfaces, as well as the front and rear wall surfaces. The bend pipe is separated into 12 distinct sections, as seen in Figure 16 below, to aid in the investigation of the deposition efficiency features of the particles within the bend pipe. The particle deposition rate of each wall surface on the bent pipe is obtained by counting the particle deposition rate of each region.
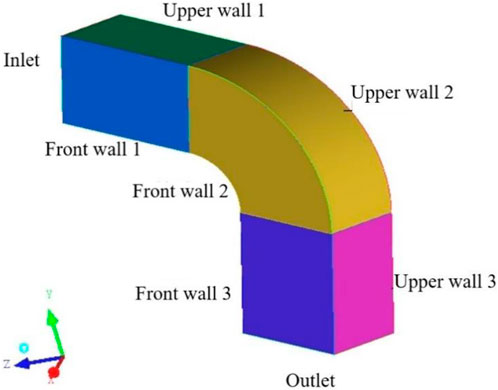
Figure 16. Horizontal to vertical downward bend structural modeling.
4.5 Horizontal to vertical downward bend
Horizontal to vertical downward bend pipe structure model shown in Figure 16 gravity direction is set to -Y, the specific structural parameters are shown in Table 1.
After the previous studies, the bent pipe structure model has been established. The boundary conditions for the inlet velocity of the flue gas in the bent pipe were changed. The aim was to analyze the effect of different inlet velocities (8 m/s, 12 m/s and 16 m/s) and different particle sizes (1, 3, 5, 10, 20 and 40 μm) on the rate of particle deposition inside the bent pipe. A total of twenty-six thousand particles were released at the entrance. As shown in Figure 17, with the increase of velocity, the particle deposition rate decreases because the collision between particles is more intense. And it is difficult to change the state of motion of the particles, which are more likely to leave the bend. After the increase of airflow velocity, the particle phase is affected by the airflow phase, the velocity of the particle phase in the bent pipe increased. So, the particles were not easy to be deposited on the wall. The particle deposition rate increases gradually with the increase of particle size. This is because the deposition of particles in the curved pipe is mainly affected by gravity. An increase in particle size increases the force of gravity on the particles. The particles are also affected by the thermophoretic force as well as the Saffman uplift force. This results in the particles not being able to rotate easily with the gas-phase flow inside the pipe, and thus the deposition rate is increasing. However, for particles with larger velocity, the growth rate is slower. For particles with smaller velocity and diameter, the momentum is also relatively small and easier to leave the bend.
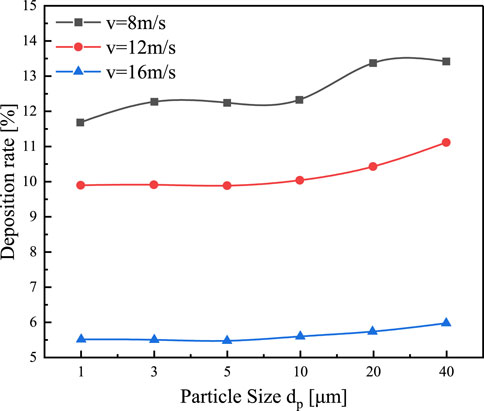
Figure 17. Distribution of particle size and deposition rate at different speeds.
The total deposition rate of the four walls is shown in Figure 18. With the three different velocities, the amount of change in deposition rate was greatest at the lower wall. This indicates that it is most susceptible to the effects of velocity. At the same time, the particle velocity increases as the entrance velocity increases. This leads to an increased inertial force on the particles.
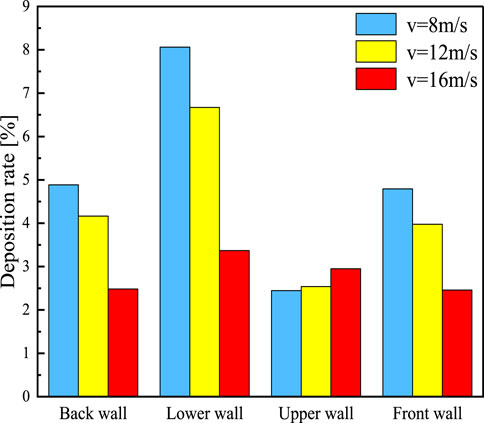
Figure 18. Deposition distribution of each wall at different speeds.
At this time, the direction of gravity is set to -Y and pointing to the lower wall. So that the deposition rate of this wall is larger. The upper wall is the least affected by velocity. And the deposition rate on this wall does not change significantly by changing the inlet velocity. The trend of the back wall and front wall is approximately the same. This is because the two walls are symmetrically distributed and the particles in the bend are subjected to the same force.
The distribution of particle size and deposition rate under the speed of 8 m/s is shown in Figure 19. By changing the DPM term, the number of random tracking attempts for turbulent diffusion of the jet source is 20 times. Holding other parameter conditions constant, the discrete term model condition was changed to escape and captured a total of 53,000 particles. For particles with the size of 1μm, the momentum is small at a velocity of 8 m/s. And they are easy to attach to the wall therefore the deposition rate is high. Particle with the size of 3∼10μm, the deposition rate did not change significantly. Finally, with the increasing particle size, the deposition rates are on an upward trend.
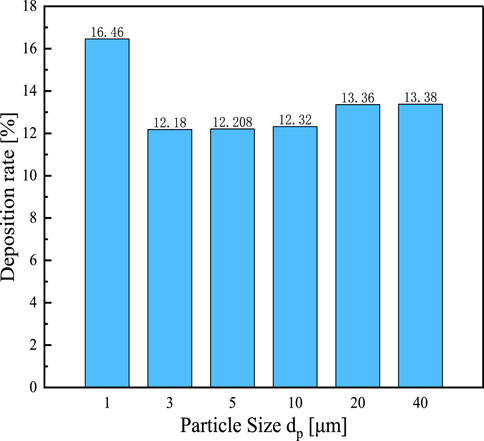
Figure 19. Distribution of particle size and deposition rate at v = 8 m/s.
4.6 Horizontal to vertical upward bend model
This part of the study uses the dimensions of the aforementioned bend model (as shown in Table 1). The same physical parameters of flue gas and fly ash, boundary conditions, and the same calculation method are adopted. Only by changing the direction of gravity (G = Y) to investigate the flow characteristics of gas-solid two-phase flow in the horizontal to vertical upward bend model. The specific structure as shown in Figures 20, 21.

Figure 20. Horizontal to vertical upward bend model structure.

Figure 21. Horizontal to vertical upward elbow model structure.
A comparison of the variations in the particle matter deposition rate in the bends under various gravity orientations is presented in Figure 22. Particle size increases cause a modest rise in the deposition rate when the gravity direction is changed from G = -Y to G = Y. This suggests that gravity virtually has no effect on the deposition rate.
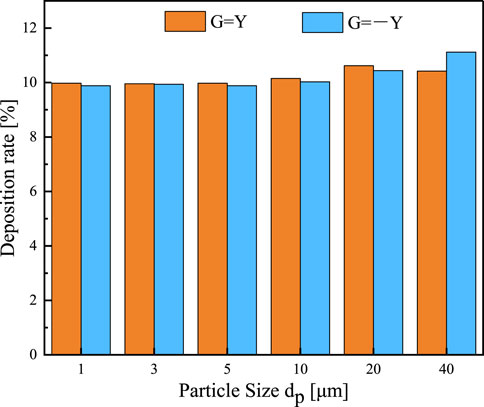
Figure 22. Relationship between particle size and deposition rate under different gravity directions.
The velocity reduces the front wall and rear wall deposition rates. Additionally, the pattern of change is roughly the same. After shifting the direction of gravity, there is little change in the wall’s deposition rate. When the number of particles is 1∼10 μm, gravity’s influence on the overall deposition rate of particles can be disregarded, provided that all other variables remain identical. Regardless of the direction of gravity applied, the overall deposition rate in the horizontal to vertical uphill and downhill bends is about the same.
As shown in Figure 23, the deposition distribution on different wall surfaces is observed by changing the gravity direction at a velocity of 12 m/s. When the gravity direction is changed from G = -Y to G = Y, the deposition rate on the upper wall surface increases dramatically. The symmetric distribution on the back wall surface as well as on the front wall surface is almost the same. Errors in the results due to the application of the random wandering model, where the particles move randomly and erratically through the tube. As a result, there is a difference in the overall deposition rates between the front and rear wall surfaces. By shifting the direction of gravity, the portion of the wall’s deposition rate was considerably altered. The particle motion dominated by gravity has a higher vertical component of velocity when Y is the direction of gravity. Thus, the higher wall surface may readily deposit these particles. The particles are readily deposited on the lower wall surface when -Y is the direction of gravity.
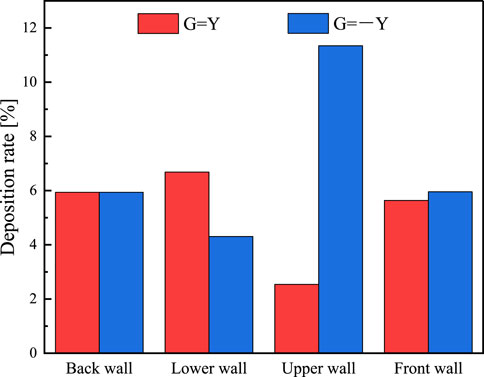
Figure 23. Relationship between different gravity directions, under-wall surface and deposition.
5 Conclusion and outlook
Different working conditions in the bends were simulated using the CFD method. The novelty of this study lies in the large number of cases calculated covering a wide range of conditions for particulate matter of different velocities and particle sizes. We investigated the deposition characteristics of particulate matter on each of the four wall surfaces: top, bottom, left and right. The effect of direction of gravity, different flow velocities and particle sizes in the bent pipe are considered. The RNG k-ε turbulence model and the Lagrangian method are used to compute the flow and particle phases in the pipe, respectively. Where discrete random wandering model was used for the prediction of the particle phase. The results of the simulation were compared with the experimental results of other researchers, and the results were in good agreement. The final simulation results are given below:
(1) The turbulent kinetic energy is higher near the wall surface of the inner bend. The particles colliding with the wall at the bend have a larger impulse velocity and a greater degree of turbulence. Therefore, one of the regions with the largest energy loss is the bend section part.
(2) The deposition rate in the curved pipe increases gradually with increasing particle size. This is because the deposition rate under this condition is mainly affected by gravity. The particle size increases and the particles are subjected to an increased gravitational force. The particles are also subjected to forces such as the Saffman lift and thermophoretic forces. These result in the particles not rotating easily with the gas phase flow in the pipe. Therefore, the deposition rate is increasing.
(3) The particle deposition rate decreases with increasing velocity. This is because the collision between particles is more intense. It is difficult to change the motion state of the particles in this state. So, the particles are more likely to leave the bend. And the particle phase is affected by the airflow phase when the airflow velocity increases. The velocity of the particles in the bend pipe increases with it and is not easy to be deposited on the wall.
There is still a large part of the simulation study based on particle deposition in curved pipes to be explored. For example, the incorporation of a User Defined Function (UDF) program to achieve the ability to control the entire mixing region using a single set of control equations. Implementing this improvement would allow for more effective integration of the particle wall collision model into the Lagrangian particle tracking scheme. Further improvements to the existing computational methods will be proposed in the future. Estimation of the particle deposition rate in a bent tube by calculating the number of deposition trajectories over a period of time. The model structure of the bent tube still needs to be optimized, such as the influence of variable cross section, variable curvature and the condition of analyzing particle distribution and deposition under different wall materials. This study does not currently consider particle rebound on the wall. This study currently uses the RANS method, and in the future, we will use the more efficient LES or DNS methods. Based on the above discussion, the simulation of particle deposition in bends should have a wider space for us to explore.
Data availability statement
The datasets presented in this article are not readily available because The authors are not authorized to provide the raw data that support the conclusions of this paper. Requests to access the datasets should be directed to bHVoYW9AeGp1LmVkdQ==.
Author contributions
RZ: Writing–review and editing. MG: Data curation, Software, Writing–original draft. MF: Formal Analysis, Investigation, Writing–review and editing.
Funding
The author(s) declare that financial support was received for the research, authorship, and/or publication of this article. The funding is provided by the State Grid Xinjiang Economic Research Institute Science and Technology Project (SGXJJJ00KJJS2310038).
Conflict of interest
Authors RZ and MG were employed by State Grid Xinjiang Economic Research Institute, Ltd. Author MF was employed by State Grid Xinjiang Power Co., Ltd.
The authors declare that this study received funding from State Grid Company Limited Electric Power Research Institute. The funder had the following involvement in the study: during the manuscript writing phase, they provided suggestions on the organization of the article. After the manuscript was written, they provided constructive comments on the way the images were presented. They were also involved in the revision of the manuscript.
Publisher’s note
All claims expressed in this article are solely those of the authors and do not necessarily represent those of their affiliated organizations, or those of the publisher, the editors and the reviewers. Any product that may be evaluated in this article, or claim that may be made by its manufacturer, is not guaranteed or endorsed by the publisher.
References
AlQdah, K. S., Khan, N. M., Bacha, H. B., Chung, J.-D., and Shah, N. A. (2021). Marangoni convection of dust particles in the boundary layer of maxwell nanofluids with varying surface tension and viscosity. Coatings 11 (9), 1072. doi:10.3390/coatings11091072
Bass, K., and Worth Longest, P. (2018). Recommendations for simulating microparticle deposition at conditions similar to the upper airways with two-equation turbulence models. J. Aerosol Sci. 119, 31–50. doi:10.1016/j.jaerosci.2018.02.007
Chu, J. C., Teng, J. T., and Greif, R. (2010). Experimental and numerical study on the flow characteristics in curved rectangular microchannels. Appl. Therm. Eng. 30 (13), 1558–1566. doi:10.1016/j.applthermaleng.2010.03.008
El-Behery, S. M., Hamed, M. H., El-Kadi, M. A., and Ibrahim, K. A. (2009). CFD prediction of air–solid flow in 180° curved duct. Powder Technol. 191 (1–2), 130–142. doi:10.1016/j.powtec.2008.09.018
FLUENT inc (2021). FLUENT incorporation FLUENT user’s guide. New York, NY, United States: FLUENT inc.
Guo, J., Chen, Z., Shen, B., Wang, J., and Yang, L. (2020). Numerical study on characteristics of particle deposition efficiency on different walls of 90° square bend. Powder Technol. 364, 572–583. doi:10.1016/j.powtec.2020.01.059
Hong, W., Wang, B., and Zheng, J. (2020). Numerical study on the influence of fine particle deposition characteristics on wall roughness. Powder Technol. 360, 120–128. doi:10.1016/j.powtec.2019.09.079
Hongtao, L., and Li, Z. (2011). Prediction of particle deposition characteristic in 90° square bend: square bend particle deposition characteristic. Appl. Therm. Eng. 31 (16), 3402–3409. doi:10.1016/j.applthermaleng.2011.06.025
Hu, H. P. (2017). Numerical simulation of hydrodynamic performance of transverse-axis hydraulic turbine and its deflector cover. master's thesis. Shanghai: Shanghai Ocean University.
Huang, F., Zhu, Q., Zhou, X., Gou, D., Yu, J., Li, R., et al. (2021). Role of CFD based in silico modelling in establishing an in vitro-in vivo correlation of aerosol deposition in the respiratory tract. Adv. Drug Deliv. Rev. 170, 369–385. doi:10.1016/j.addr.2020.09.007
Huang, L., Gong, S. L., Gordon, M., Liggio, J., Staebler, R., Stroud, C. A., et al. (2014). Aerosol–computational fluid dynamics modeling of ultrafine and black carbon particle emission, dilution, and growth near roadways. Atmos. Chem. Phys. 14 (23), 12631–12648. doi:10.5194/acp-14-12631-2014
Huang, Z., Wang, H., Zhou, Q., and Li, T. (2017). Effects of granular temperature on inter-phase drag in gas-solid flows. Powder Technol. 321, 435–443. doi:10.1016/j.powtec.2017.08.035
Inthavong, K. (2019). A unifying correlation for laminar particle deposition in 90-degree pipe bends. Powder Technol. 345, 99–110. doi:10.1016/j.powtec.2018.12.095
Keita, N. S., Mehel, A., Fokoua, G., Murzyn, F., Taniere, A., Arcen, B., et al. (2023). Dispersion of ultrafine particles in the wake of a square back Ahmed body. Environ. Fluid Mech. 23 (3), 735–756. doi:10.1007/s10652-023-09923-3
Kim, K. Y., and Choi, J. Y. (2005). Shape optimization of a dimpled channel to enhance turbulent heat transfer. Numer. Heat. Transf. Part A Appl. 48 (9), 901–915. doi:10.1080/10407780500226571
Li, Q., Song, J., Li, C., Wei, Y., and Chen, J. (2013). Numerical and experimental study of particle deposition on inner wall of 180° bend. Powder Technol. 237, 241–254. doi:10.1016/j.powtec.2012.11.008
Lin, N., Lan, H., Xu, Y., Dong, S., and Barber, G. (2015). Effect of the gas–solid two-phase flow velocity on elbow erosion. J. Nat. Gas Sci. Eng. 26, 581–586. doi:10.1016/j.jngse.2015.06.054
Liu, Y. (2018). Motion characterization of solid particles within a two-phase turbulent boundary layer. master's thesis. Xi’an, China: Xi’an Shiyou University.
Maxey, M. R., and Riley, J. J. (1983). Equation of motion for a small rigid sphere in a nonuniform flow. Phys. Fluids 26 (4), 883–889. doi:10.1063/1.864230
McFarland, A. R., Gong, H., Muyshondt, A., Wente, W. B., and Anand, N. K. (1997). Aerosol deposition in bends with turbulent flow. Environ. Sci. Technol. 31 (12), 3371–3377. doi:10.1021/es960975c
Morsi, S. A., and Alexander, A. J. (1972). An investigation of particle trajectories in two-phase flow systems. J. Fluid Mech. 55 (02), 193. doi:10.1017/S0022112072001806
Nian, X., Liu, H., Li, Y., Liu, Y., Guo, C., and Qu, F. (2017). Numerical simulation of the fluid traverses the porous media by single domain method based on UDF. Procedia Eng. 205, 3946–3953. doi:10.1016/j.proeng.2017.09.851
Nicolaou, L., and Zaki, T. A. (2016). Characterization of aerosol Stokes number in 90° bends and idealized extrathoracic airways. J. Aerosol Sci. 102, 105–127. doi:10.1016/j.jaerosci.2016.09.003
Noorani, A., El Khoury, G. K., and Schlatter, P. (2013). Evolution of turbulence characteristics from straight to curved pipes. Int. J. Heat Fluid Flow 41, 16–26. doi:10.1016/j.ijheatfluidflow.2013.03.005
Pei, J., Lui, A., Zhang, Q., Xiong, T., Jiang, P., and Wei, W. (2018). Numerical investigation of the maximum erosion zone in elbows for liquid-particle flow. Powder Technol. 333, 47–59. doi:10.1016/j.powtec.2018.04.001
Peng, W., and Cao, X. (2016). Numerical prediction of erosion distributions and solid particle trajectories in elbows for gas–solid flow. J. Nat. Gas Sci. Eng. 30, 455–470. doi:10.1016/j.jngse.2016.02.008
Peters, T. M., and Leith, D. (2004). Particle deposition in industrial duct bends. Ann. Occup. Hyg. 48 (5), 483–490. doi:10.1093/annhyg/meh031
Pui, D. Y. H., Romay-Novas, F., and Liu, B. Y. H. (1987). Experimental study of particle deposition in bends of circular cross section. Aerosol Sci. Technol. 7 (3), 301–315. doi:10.1080/02786828708959166
Rohdin, P., and Moshfegh, B. (2011). Numerical modelling of industrial indoor environments: a comparison between different turbulence models and supply systems supported by field measurements. Build. Environ. 46 (11), 2365–2374. doi:10.1016/j.buildenv.2011.05.019
Sippola, M. R., and Nazaroff, W. W. (2005). Particle deposition in ventilation ducts: connectors, bends and developing turbulent flow. Aerosol Sci. Technol. 39 (2), 139–150. doi:10.1080/027868290908795
Sluše, J., Maury, R., Olsen, Å. A. F., Geršl, J., and Kenbar, A. (2021). Influence of upstream disturbances on performance of an LDV-based cryogenic flow meter standard – CFD modelling and preliminary measurements with air. Flow Meas. Instrum. 80, 101991. doi:10.1016/j.flowmeasinst.2021.101991
Soleimani, A., Schneiderbauer, S., and Pirker, S. (2015). CFD study of the gas-particle flow in a horizontal duct: the impact of the solids wall boundary conditions. Procedia Eng. 102, 1026–1037. doi:10.1016/j.proeng.2015.01.225
Solnordal, C. B., Wong, C. Y., and Joan Boulanger, J. (2015). An experimental and numerical analysis of erosion caused by sand pneumatically conveyed through a standard pipe elbow. Wear 336–337, 43–57. doi:10.1016/j.wear.2015.04.017
Spalding, D. B., Launder, B. E., Morse, A. P., and Maples, G. (1974). Combustion of hydrogen-air jets in local chemical equilibrium: a guide to the CHARNAL computer program. CR-2407. Washington, D.C., United States: NASA, 1–85.
Sun, K., and Lu, L. (2013). Particle flow behavior of distribution and deposition throughout 90° bends: analysis of influencing factors. J. Aerosol Sci. 65, 26–41. doi:10.1016/j.jaerosci.2013.07.002
Sun, K., Lu, L., and Jiang, H. (2011a). Modelling of particle deposition and rebound behaviour on ventilation ducting wall using an improved wall model. Indoor Built Environ. 20 (3), 300–312. doi:10.1177/1420326X11411241
Sun, K., Lu, L., and Jiang, H. (2011b). A computational investigation of particle distribution and deposition in a 90° bend incorporating a particle–wall model. Build. Environ. 46 (6), 1251–1262. doi:10.1016/j.buildenv.2010.12.006
Tian, L., and Ahmadi, G. (2007). Particle deposition in turbulent duct flows—comparisons of different model predictions. J. Aerosol Sci. 38 (4), 377–397. doi:10.1016/j.jaerosci.2006.12.003
Ueda, Y., Nakajima, T., and Iguchi, M. (2012). Random walk of a particle due to brownian force by a two-dimensional vortex particle method (implementation of a PSE method). Jpn. Soc. Exp. Mech., doi:10.11395/jjsem.12.213
Wang, M. (2014). CFD study of abrasion of liquid-solid two-phase flow in pipeline. master's thesis. Daqing (HL): Northeast Petroleum University.
Warner, H. J., Whalen, D. H., Harel, D., and Jackson, E. S. (2022). The effect of gap duration on the perception of fluent versus disfluent speech. J. Fluen. Disord. 71, 105896. doi:10.1016/j.jfludis.2022.105896
Zhang, P., Roberts, R. M., and Bénard, A. (2012). Computational guidelines and an empirical model for particle deposition in curved pipes using an Eulerian-Lagrangian approach. J. Aerosol Sci. 53, 1–20. doi:10.1016/j.jaerosci.2012.05.007
Zhang, Y., Fang, Z., Zhao, S., Wei, M., Wu, X., and Sun, L. (2020). An experimental study on the wall collision of micro-sized graphite particles by high-speed photomicrography. Prog. Nucl. Energy 125, 103391. doi:10.1016/j.pnucene.2020.103391
Zhao, B., Zhang, Y., Li, X., Yang, X., and Huang, D. (2004). Comparison of indoor aerosol particle concentration and deposition in different ventilated rooms by numerical method. Build. Environ. 39 (1), 1–8. doi:10.1016/j.buildenv.2003.08.002
Zhao, Y., Kato, S., and Zhao, J. (2016). Numerical investigation of brownian, gradient, and turbulent coagulation under moving vehicle conditions in an underground garage. J. Dispersion Sci. Technol. 37 (2), 258–269. doi:10.1080/01932691.2015.1042583
Zheng, W., Wen, X., Cai, J., Li, C., and He, D. (2021). Characteristics of thermal environment influenced by the opening and closing of a subway train sliding door. Case Stud. Therm. Eng. 27, 101278. doi:10.1016/j.csite.2021.101278
Keywords: gas-solid two-phase flow, numerical simulation, elbow pipe, turbulent flow, particle deposition
Citation: Zhang R, Gao M and Fan M (2024) A CFD numerical simulation of particle deposition characteristics in automobile tailpipe: power abatement pathways. Front. Energy Res. 12:1400763. doi: 10.3389/fenrg.2024.1400763
Received: 14 March 2024; Accepted: 15 May 2024;
Published: 05 June 2024.
Edited by:
Qiang Liu, China University of Petroleum, ChinaReviewed by:
Min Chai, Zhejiang University of Technology, ChinaZiye Ling, South China University of Technology, China
Copyright © 2024 Zhang, Gao and Fan. This is an open-access article distributed under the terms of the Creative Commons Attribution License (CC BY). The use, distribution or reproduction in other forums is permitted, provided the original author(s) and the copyright owner(s) are credited and that the original publication in this journal is cited, in accordance with accepted academic practice. No use, distribution or reproduction is permitted which does not comply with these terms.
*Correspondence: Ming Gao, bWNkYW5pZWxwc3d5MTJAZ21haWwuY29t