 Jiang Junshuai
 Chen Peiyuan
94% of researchers rate our articles as excellent or good
Learn more about the work of our research integrity team to safeguard the quality of each article we publish.
Find out more
ORIGINAL RESEARCH article
Front. Energy Res., 23 May 2024
Sec. Advanced Clean Fuel Technologies
Volume 12 - 2024 | https://doi.org/10.3389/fenrg.2024.1394282
This article is part of the Research TopicProduction Technology for Deep ReservoirsView all 37 articles
The development of anti-rhythmic carbonate reservoirs in the Middle East often encounters challenges such as water hold-up and reverse coning during the water injection process, leading to premature water breakthrough and various water-out issues. The unclear understanding of these phenomena, attributed to strong reservoir heterogeneity, results in a relatively low recovery degree in water injection development. This paper investigates the mechanisms behind water hold-up and reverse coning phenomena, offering detailed solutions. Numerical models of the oil reservoirs were developed, and an extensive study of influencing factors, including reservoir types, Kv/Kh, water injection pressure differential, wettability, and perforation position, was conducted to unveil the underlying mechanisms. Key findings indicate that the water hold-up phenomenon is influenced by capillary force barriers due to wettability and high-perm streaks, while the reverse coning phenomenon depends on the combined forces of gravity, capillary force and downward production differential among which downward production differential is the dominant factor compared to capillary force and gravity. The study also proposes a differential perforation principle tailored to different water-out types to enhance vertical sweep efficiency. The differential perforation principle is as follows: the optimal perforation position is at top layer and the optimal perforation length approximately accounts for 1/4 of the total oil layer thickness for water-out in bottom; the avoidance perforation height in top accounts for 1/6 of the total oil layer thickness and the optimal perforation length approximately accounts for 1/2 of the total oil layer thickness for water-out in top; the avoidance perforation height in top and bottom accounts for 1/5 and 2/5 of the total oil layer thickness respectively for water-out in both top and bottom.
With the global population explosion and the increasing demand for energy, it is crucial to enhance oil production from existing reservoirs (IEA, 2022). Carbonate reservoirs contribute significantly to daily oil production, with over 60% of the world’s remaining conventional oil reserves located in these formations (Ya Yao et al., 2018; Anas M. Hassan et al., 2023). Water injection is a vital method for improving oil recovery in carbonate reservoirs in the Middle East (Bisweswar G et al., 2020; Barros E G D et al., 2023; Ghalib H B et al., 2023; Farnetano R P et al., 2023; Wu Y and Hu D et al., 2023). However, challenges such as premature water breakthrough pose significant obstacles to achieving optimal oil recovery (Li Y et al., 2020; AL-Otaibi B et al., 2021; Dewever B et al., 2021; Yang C and Yang S et al., 2022; Wei C et al., 2022).
The reasons behind premature water breakthrough and poor vertical sweep have been extensively discussed, with high-permeability streaks identified as a primary cause (Ghedan, S.,2010; Feng, Q. et al., 2011; Zhang, Q et al., 2016; Liu, L. et al., 2016; Feng D. et al., 2022a). These streaks, often resulting from dissolution processes, can exhibit permeability one or two orders of magnitude higher than the rest of the formation (Balaky S M et al., 2023; Mogensen K et al., 2020; Dewever B et al., 2021; Jun, W et al., 2016; Liu, H et al., 2021). Although the volume of high permeability streak is usually a few percent or less of the total formation, they contribute the majority portion of the fluid flow in the reservoir and may lead to pre-matured water breakthrough of injected water.
In the subject reservoir, characterized by large thickness and with high-permeability streaks developed inside, water breakthrough along the top streak has been observed in several wells. Interestingly, in a certain area, the injected water stably exists in the top high permeability streak and does not migrate downwards under the gravity differentiation effect, which can be so called water hold up phenomenon. In other areas, the injected water migrates along the top high permeability streak initially and then downwards, forming the so-called reverse coning phenomenon (Figure 1). The phenomena of water hold-up and reverse coning have been widely reported and studied in giant carbonate reservoirs in the Middle East, necessitating a comprehensive understanding of their mechanisms (Pamungkas S et al., 2020; Singh M et al., 2020; Thomas T et al., 2020; Fabbri C et al., 2023; Barragan E et al., 2023; Jie C et al., 2023).
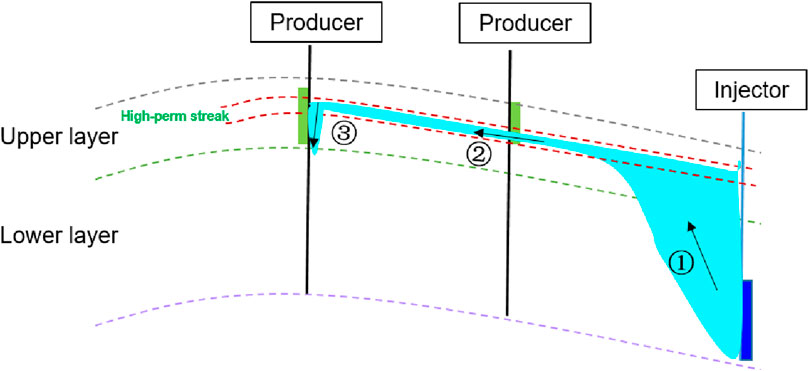
Figure 1. Schematic demonstrating water-out mechanism in Reservoir B (1. water over ride; 2. water hold up phenomenon; 3. reverse coning phenomenon).
Despite the extensive literature on intra-dense intervals and Kv/Kh for explaining these phenomena, the effect of capillary forces is often underestimated, particularly in numerical simulations where reliable experimental data is lacking (Feng D et al., 2018; Pamungkas S et al., 2020; Pandey V K et al., 2023; Fabbri C et al., 2021). Given that most carbonate reservoirs are of mixed or oil-wet nature, detailed research on the impact of negative capillary forces is crucial (Arif M et al., 2020; Nowrouzi I et al., 2020; Faramarzi-Palangar M et al., 2021; Feng D et al., 2021; Ekechukwu G K et al., 2021; Siyal A et al., 2021; Esfandyari H et al., 2021; AlZaabi A et al., 2023; Boampong L O et al., 2023; Siyal A et al., 2023; Samani M K et al., 2023). Current methods to improve water sweep efficiency involve wettability alteration through low salinity water flooding and optimizing perforation intervals (Vermolen, E et al., 2014; He, E et al., 2015; Xinmin, S et al., 2018; Lee, Y et al., 2019; Snosy M F et al., 2022; Feng D et al., 2022b; Khurshid, I et al., 2022; Tackie-Otoo, B N et al., 2022a; Souayeh, M et al., 2022; Nascimento, F P et al., 2023). However, the implementation of low salinity water flooding is challenging in the Middle East due to water resource limitations, making the optimization of perforation intervals the most effective strategy. Yet, the lack of differentiated perforation principles corresponding to different water-out modes greatly hinder the development effect of water injection.
This paper includes an introduction to the subject reservoir, a conceptual model based on reservoir characteristics, an investigation into the role of capillary forces in the water hold-up phenomenon, an exploration of the mechanism behind the reverse coning phenomenon, and the proposal of a differential perforation principle for various water-out types. The paper is concluded with a summary of principal findings.
The carbonate reservoir under investigation is a component of Field B located in onshore Iraq. The structural orientation of Field B forms a gentle NW-SE long-axis anticline without any faults. The field spans approximately 21.5 km long and 5.4 km wide, featuring a closure area of around 172 km2 at the reservoir’s top. The primary pay zone of Field B is the reservoir B, which comprises eight small layers. The average thickness of the reservoir and Net-to-Gross (NTG) ratio are 80 m and 0.98, respectively. Notably, interlayers are only observed in local areas, indicating the reservoir’s stability and continuity.
Reservoir B is a typical anti-rhythmic reservoir, and a detailed reservoir description highlights significant heterogeneity between layers, with the development of high-permeability streaks within the reservoir. Three main reservoir types are identified: those with no high-perm streaks, those with a high-perm streak at the top layer, and those with high-perm streaks at both the top and bottom layers (Figure 2). The top high-perm streak is primarily located in the lower part of Layer I, while the bottom high-perm streak is predominantly in Layer VII. For reservoirs with no high-perm streaks, they are categorized into two zones: Upper zone (I+III) and lower zone (III∼Ⅷ). For reservoirs with top high-perm streaks, they are categorized into three zones: Upper zone (Ⅰ+Ⅱ), top high-perm streak zone in upper zone and lower zone (Ⅲ∼Ⅷ). When both top and bottom high-perm streaks are present, the reservoir is divided into four zones: Upper zone (I+II), top high-perm streak zone in upper zone, lower zone (III∼VIII), and bottom high-perm streak zone in lower zone.
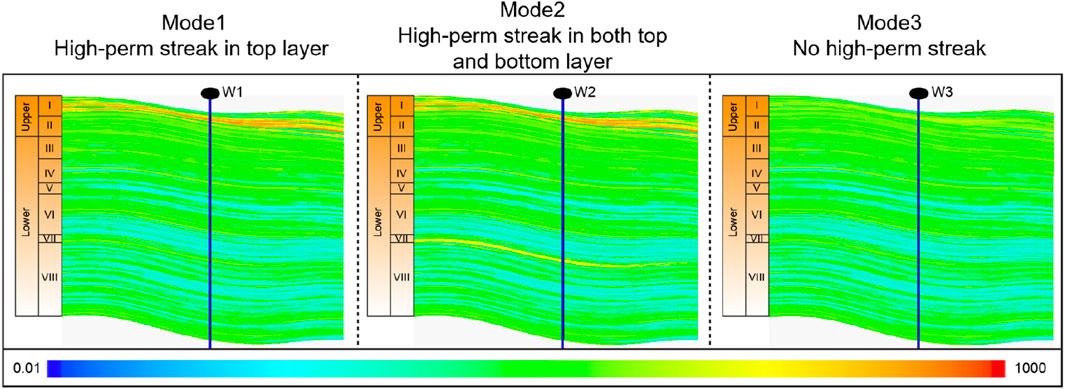
Figure 2. Three main reservoir types in Reservoir B.
The permeability of high-perm zone is 5∼15 times higher than the upper zone and the permeability of upper zone is 5∼10 times higher than the lower zone. Considering the reservoir characteristics, producers are predominantly perforated in the upper zone, while injectors are mainly perforated in the bottom (VII+VIII) to maximize oil productivity and mitigate water breakthrough, leveraging the law of oil-water gravity differentiation. However, recent well logging data reveals three types of water-out: water-out in the top, water-out in the bottom, and water-out in both the top and bottom (Figure 3). Notably, incidents of water breakthrough in the top thief zone and water hold-up over the past 2 years pose significant challenges to new well perforation and the balanced development of the oilfield. Therefore, it is imperative to investigate the mechanisms behind the water hold-up phenomenon and explore differentiated perforation principles for the three types of water-out.
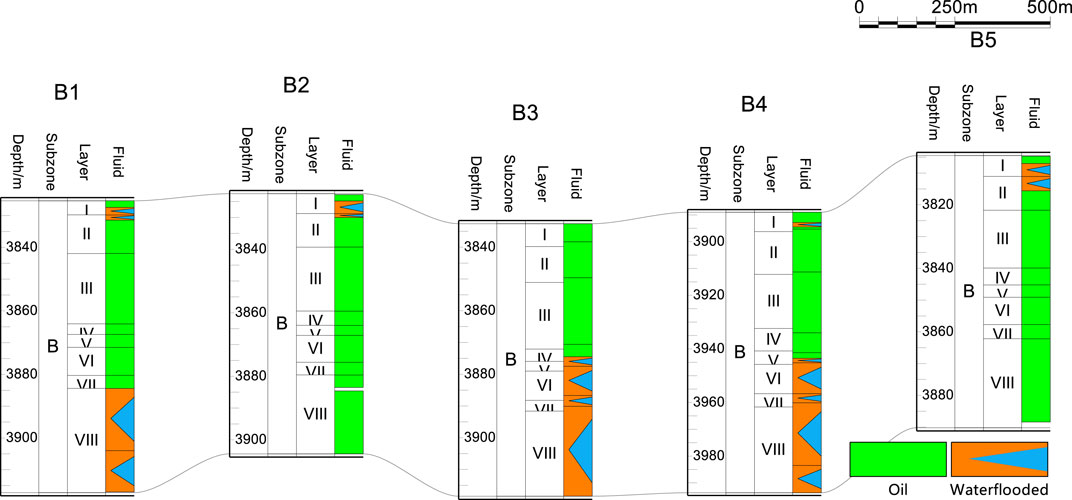
Figure 3. Water-out intervals of wells in Reservoir B.
To capture the characteristics of the reservoir B, three conceptual numerical models corresponding to three reservoir types were established (Figure 4). To finely describe the reservoir’s features, a rectangular reservoir with dimensions of I × J × K, specifically 50 m × 50 m × 0.5 m, is selected as the research area. The total grid number for this model is 141,288 (29 × 29 × 168). Each model is designed to represent a reservoir type and includes specific vertical zones. Model 1 incorporates three vertical zones, consisting of the upper zone, lower zone, and a top high-permeability streak. Model 2 features four vertical zones, encompassing the upper zone, top high-permeability streak, lower zone, and a bottom high-permeability streak. In Model 3, two vertical zones were defined: the upper zone and the lower zone. Porosity and permeability values for each zone were derived from core experiments, with these parameters being constant within each zone. A detailed summary of geological parameters is provided in the table (Table 1). Additionally, the research area adopted a reverse nine-point well pattern, where producers are perforated in the top layers and injectors are perforated in the bottom layers. Initial fluid distributions within the numerical model were established based on drainage capillary pressure curves, with imbibition capillary pressure utilized during the water flooding period.
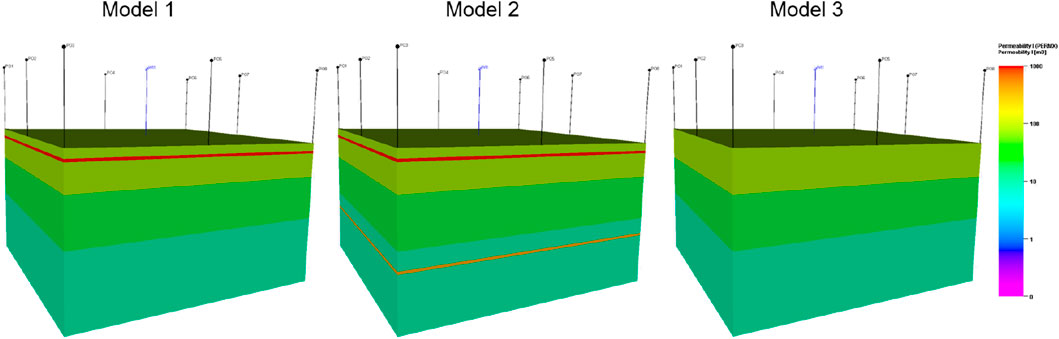
Figure 4. Three conceptual numerical models.
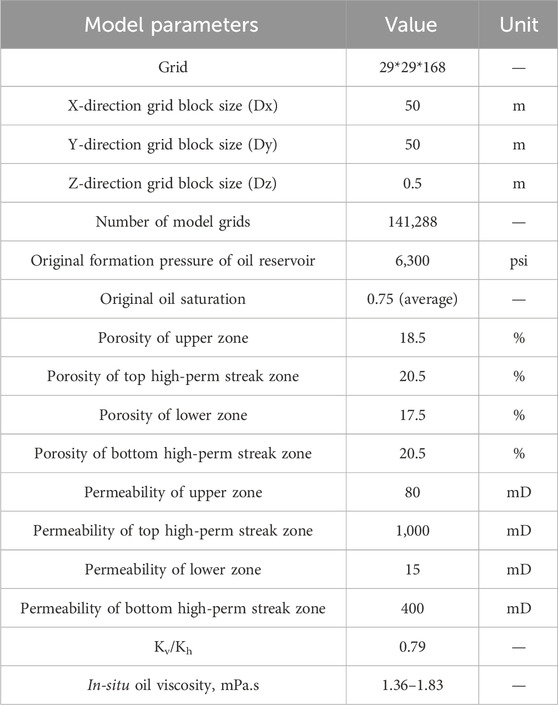
Table 1. Model basic parameters.
Numerous studies in the literature have identified dense layers, Kv/Kh, water injection pressure differential, and wettability as potential factors contributing to the water hold-up phenomenon. However, pressure measurement data for reservoir B indicates good connectivity both horizontally and vertically, suggesting the absence of dense layers. Therefore, the investigation focuses on sensitivity analysis of Kv/Kh, water injection pressure differential, and wettability, with a particular emphasis on the top high-permeability streak associated with the water hold-up phenomenon. Conceptual numerical Model 1 is selected for subsequent research.
The measured range of Kv/Kh from core experiments is concentrated in the range of 0.1∼1.0. To assess the impact of Kv/Kh on the water hold-up phenomenon, three simulated cases were conducted with Kv/Kh values of 0.1, 0.4, and 0.8. In each run, all the other parameters, whether static or dynamic, in the model were assumed to be identical. Figure 5 illustrates the water saturation profile of the three runs in the x-direction.
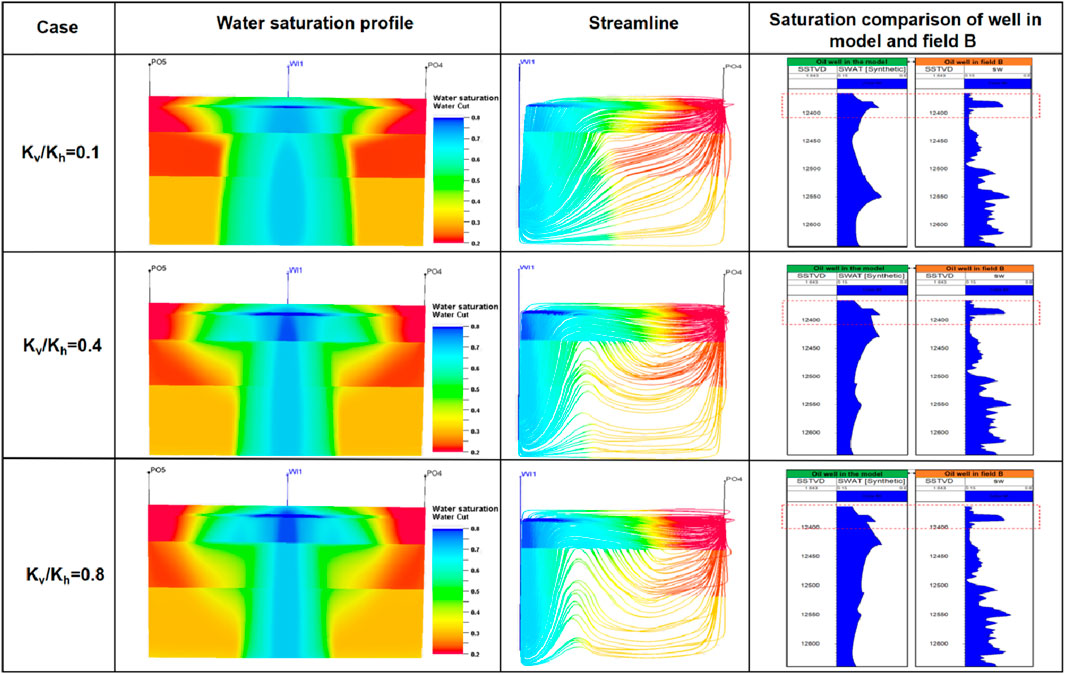
Figure 5. Simulation results under different Kv/Kh.
The results indicate that there is no discernible difference in water flooding morphology among the three cases. In comparison to the bottom layer, the distance of injected water migration in the upper zone and the top high-permeability streak zone is significantly longer. As Kv/Kh increases, the distance of injected water migration in the top high-permeability streak zone decreases. However, it is noteworthy that none of the three cases exhibited the water hold-up phenomenon, suggesting that Kv/Kh is not the primary controlling factor for this phenomenon.
The water injection pressure differential in reservoir B is within the range of 1,000∼2,000 Psi. To assess the impact of water injection pressure differential on the water hold-up phenomenon, three simulated cases were conducted with pressure differential of 1,000 Psi, 1,500 Psi, and 2,000 Psi. In each run, all the other parameters, whether static or dynamic, in the model were assumed to be identical. Figure 6 illustrates the water saturation profile of the three runs in the x-direction.
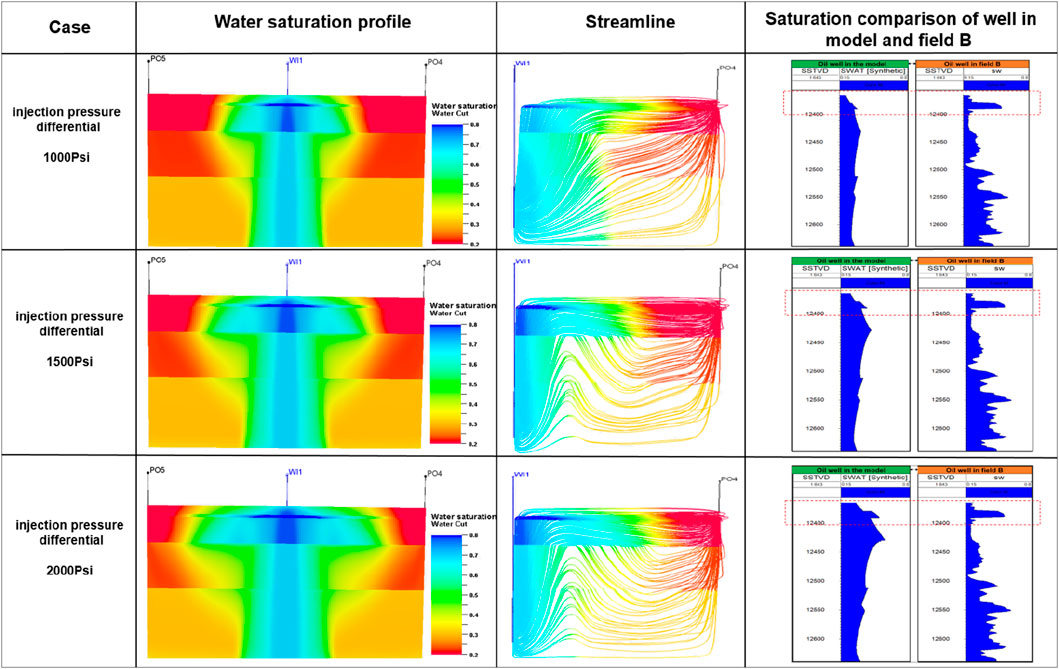
Figure 6. Simulation results under different injection pressure differential.
The results reveal that there is no noticeable difference in water flooding morphology among the three cases. As the water injection pressure differential increases, the distance of injected water migration in the upper zone and the top high-permeability streak zone also increases accordingly. However, none of the three cases exhibited the water hold-up phenomenon, suggesting that water injection pressure differential is not the primary controlling factor for this phenomenon.
Wettability plays a crucial role in determining the imbibition capillary pressure (Pc) curves, with water-wet corresponding to positive imbibition Pc curves, neutral-wet corresponding to zero imbibition Pc curves, and oil-wet corresponding to negative imbibition Pc curves. In the studied reservoir, the water saturation range corresponding to the isotonic point in the relative permeability curve is 0.25∼0.73, indicating the presence of three types of wettability. To investigate the impact of wettability on the water hold-up phenomenon, three cases were simulated using positive, zero, and negative imbibition Pc curves. All the other parameters in the model were assumed identical, and the same drainage Pc curves were used to initialize the model. Figure 7 illustrates the water saturation profile of the three cases in the x-direction.
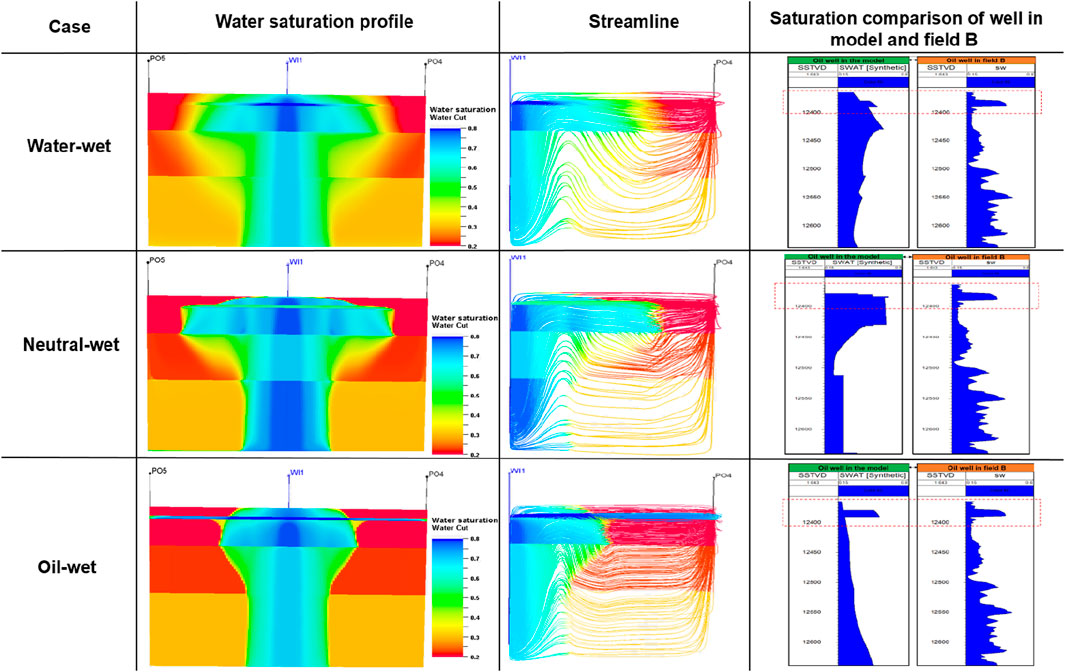
Figure 7. Simulation results under different wettability.
In the water-wet case, a well-swept volume was achieved in all three zones, with the distance of injected water migration being roughly the same. In the neutral-wet case, the distance of injected water migration in the upper and top high-permeability zones was significantly longer than in the lower zone. However, in the oil-wet case, the injected water mainly migrated in the top high-permeability zone, resulting in poor swept volume in both the upper and lower zones. This scenario aligns with the observed water hold-up phenomenon in the studied reservoir. The research results strongly suggest that top high-perm streak and wettability are the main controlling factors for the water hold-up phenomenon.
Moreover, it is crucial to delve deeper into understanding how wettability controls the water hold-up phenomenon. The differences in pore structure between high-permeability and low-permeability layers lead to variations in the absolute value of capillary force, with the capillary force in low-permeability layers consistently greater than that in high-permeability layers. Take the water at the interface between the high and low permeability layers as an example, when the reservoir is water-wet, both high and low permeability layers attract water under capillary force. Due to the greater capillary force in the low-permeability layer, water would flow towards the low-permeability layer (Figure 8A). Conversely, in an oil-wet reservoir, both high and low permeability layers repel water under capillary force. Due to the greater capillary force in the low-permeability layer, water would flow towards the high-permeability layer (Figure 8B).
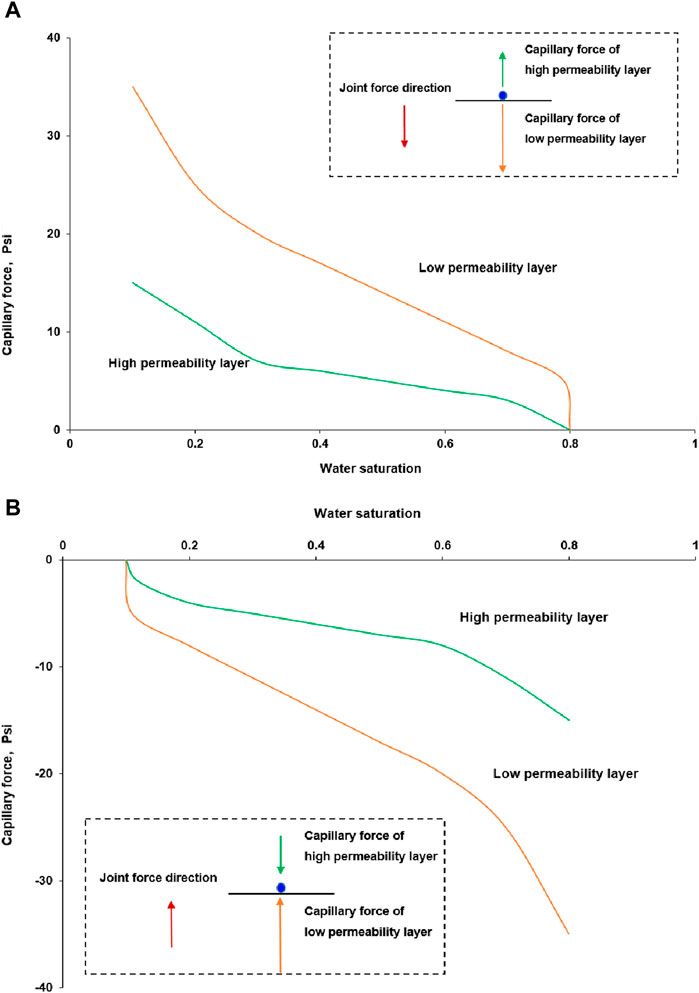
Figure 8. (A) Typical capillary curve of water-wet reservoir. (B) Typical capillary curve of oil-wet reservoir.
In the studied reservoir, when a top high-permeability streak is present, the capillary force acts in the opposite direction to gravity. As the difference of capillary pressure between the upper zone and the top high-permeability streak zone exceeds the gravitational force, the capillary forces function as an effective barrier. This barrier prevents water that initially entered the top high-permeability streak zone from spreading into the bottom low-permeability layer, thereby forming the water hold-up phenomenon. In this paper, this barrier is defined as the capillary force barrier.
Surveillance results have confirmed the occurrence of the reverse coning phenomenon, where injected water in the top high-permeability streak migrates downwards under specific conditions. However, the underlying reasons for this phenomenon remain unclear. Through analysis, three key factors—capillary force barrier, gravity, and downward production pressure differential—are possible contributors to the reverse coning phenomenon. Given that gravity remains constant for the same reservoir, the impact of the downward production pressure differential depends primarily on the perforation position of production wells. Only when the perforation position is below the top high-permeability streaks will the downward production pressure differential cause the rapid downward migration of injected water in the top high-permeability streak.
The strength of the capillary force barrier is contingent upon the physical property differences between the high-permeability layer and the low-permeability layer. Greater physical property differences result in a more substantial capillary force barrier. According to these physical property differences, capillary force barrier can be categorized into three levels (Figure 9). In Figure 9, layer 1 represents high permeability layer; layer 2 represents low permeability layer; sw1 represents water saturation of layer 1; swf1 represents water saturation at the water flooding front of layer 1; sw2 represents water saturation of layer 2; swc2 represents critical water saturation of layer 2; sor1 represents residual oil saturation of layer 1.
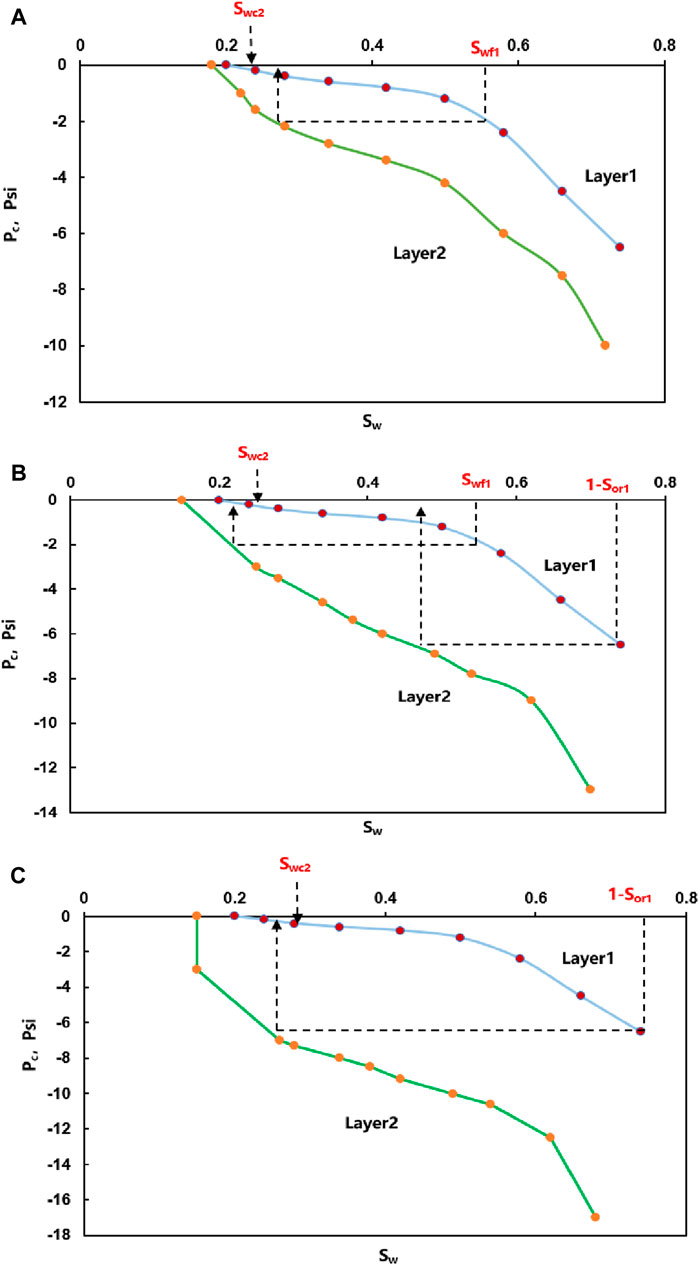
Figure 9. (A) Diagram of capillary force barrier level 1. (B) Diagram of capillary force barrier level 2. (C) Diagram of capillary force barrier level 3.
The three levels of capillary force barrier are defined as follows:
Level 1: there are little differences between layer 1 and layer 2, and sw2 equilibrating to swf1 is larger than swc2.
Level 2: As the differences between layer 1 and layer 2 increases to a certain extent, sw2 equilibrating to swf1 is smaller than swc2, but sw2 equilibrating to sw1 is larger than swc2.
Level 3: sw2 equilibrating to sw1 is always smaller than swc2.
Since gravity is constant, in order to understand the impact of downward production differential and capillary force barrier, four comparison schemes in which all the other parameters are the same have been set up:
Case 1:. when capillary force barrier is level 1 and downward production differential is zero when there are no perforation intervals under top high-perm streak.
Case 2:. when capillary force barrier is level 2 and downward production differential is zero when there are no perforation intervals under top high-perm streak.
Case 3:. when capillary force barrier is level 3 and downward production differential is zero when there are no perforation intervals under top high-perm streak.
Case 4:. when capillary force barrier is level 3 and downward production differential exists when there are perforation intervals under top high-perm streak.
In Case 1, all the water in Layer 1 can slump into Layer 2. In Case 2, the water at the front of Layer 1 cannot slump into Layer 1. In the high water saturation zone of Layer 1, where sw2 equilibrating to sw1 is larger than swc2, water can slump into Layer 2. However, in Case 3, water cannot slump into Layer 2 under any condition. The research results indicate that the capillary force barrier is the key factor determining whether the reverse coning phenomenon occurs or not when there is no downward production differential. By comparing Case 3 and Case 4, it can be observed that when there is a downward production pressure, the reverse coning phenomenon will always occur regardless of the level of the capillary force barrier. This implies that the downward production differential is the dominant factor compared to the capillary force barrier in influencing the occurrence of the reverse coning phenomenon (Figure 10).
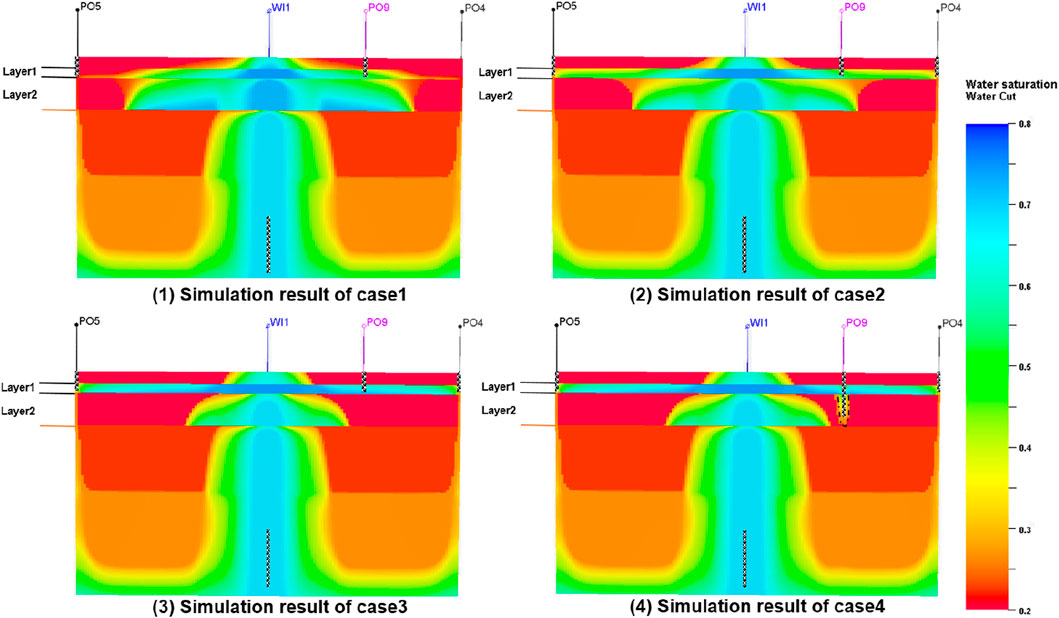
Figure 10. Simulation results of four cases.
As highlighted earlier in the article, the studied reservoir exhibits three distinct water-out modes, necessitating the formulation of corresponding perforation principles to effectively delay water breakthrough and enhance overall oilfield development effect.
In situations where a top high-permeability streak is present, leading to water-out at the top layer, a series of studies have been conducted for the establishment of an optimal perforation strategy by using model1. Initially, with a perforation length set at 10 m, the optimal perforation position was investigated. Avoidance perforation heights were considered for 0 m, 5 m, 10 m, 15 m, 20 m, and 25 m, respectively. Research findings indicate that perforating the top water-out zone should be avoided. Under the same liquid rate, the optimal avoidance perforation height was determined to be 10 m, accounting for 1/6 of the total oil layer thickness. At this height, the initial and cumulative production of a single well was the highest, and the water cut vs. cumulative oil production curve exhibited the most favorable characteristics (Figure 11A). Subsequently, additional six cases were conducted to optimize the perforation length, ranging from 10 m to 35 m. Under the same production pressure differential, the optimal perforation length was identified to be 30 m, representing approximately 1/2 of the total oil layer thickness. This comprehensive approach ensures an effective perforation strategy for reservoirs characterized by a top high-permeability streak, enhancing overall oilfield development (Figure 11B).
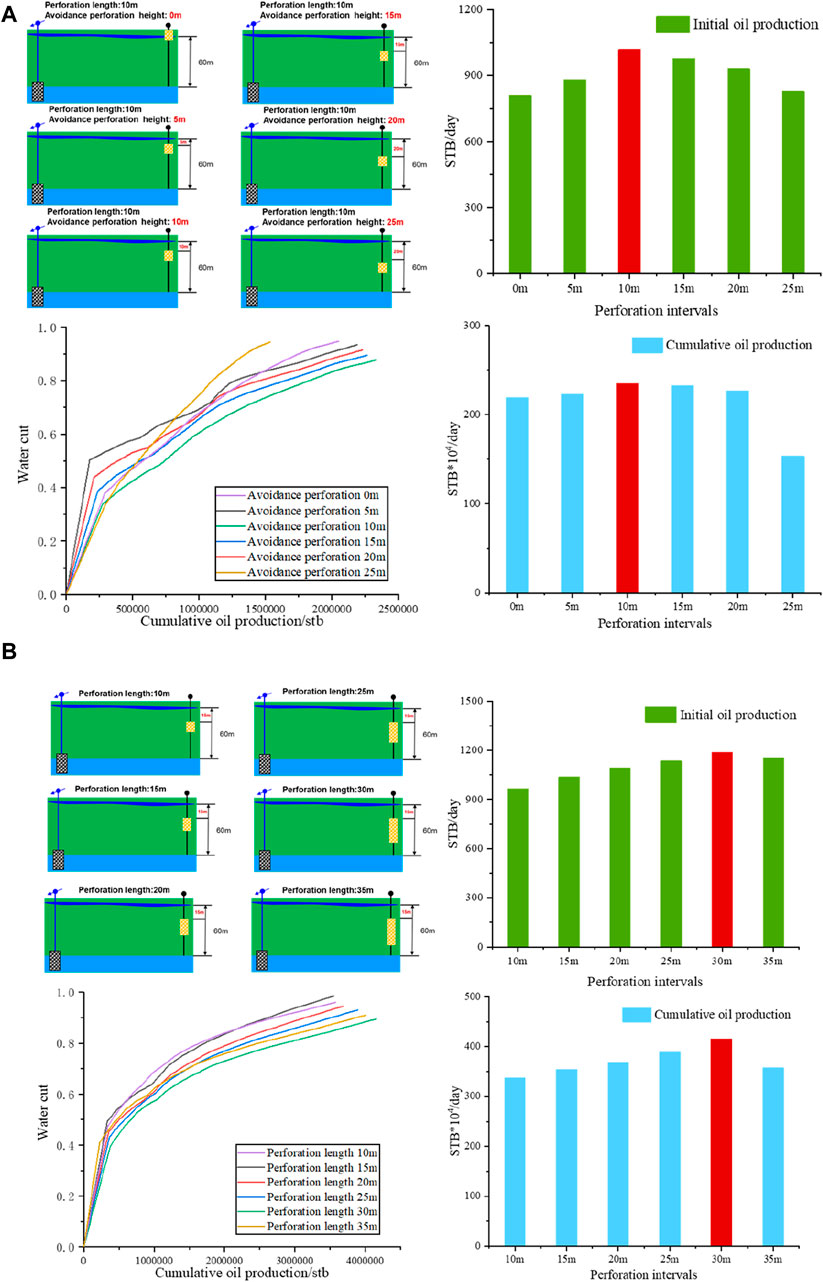
Figure 11. (A) Optimization of perforation position for Top water-out mode. (B) Optimization of perforation length for top water-out mode.
In scenarios where high-permeability streaks develop in both the top and bottom, resulting in water breakthrough in both zones, an optimized perforation principle is crucial for effective reservoir development. To formulate this principle, the avoidance perforation height in both the top and bottom needs to be carefully determined by using model 2. Firstly, by setting the avoidance perforation height in the top to 0, the optimal avoidance perforation height in the bottom was studied. Avoidance perforation heights in the bottom were considered to be 0 m, 5 m, 10 m, 15 m, 20 m, and 25 m, respectively. Research results indicate that under the same production pressure differential, the optimal avoidance perforation height in the bottom is 20 m, accounting for 2/5 of the total oil layer thickness (Figure 12A). Subsequently, with the avoidance perforation height in the bottom set at 20 m, the optimal avoidance perforation height in the top was studied. Avoidance perforation heights in the top were tested at 0 m, 5 m, 10 m, 15 m, 20 m, and 25 m, respectively. The research results demonstrated that under the same production pressure differential, the optimal avoidance perforation height in the top is 10 m, representing approximately 1/5 of the total thickness of the oil reservoir. Therefore, to achieve the best development effect for this water-out type, it is recommended to set the avoidance perforation height in the top and bottom to be approximately 1/5 and 2/5 of the total thickness of the oil reservoir, respectively. This optimized perforation strategy enhances the overall efficiency of reservoir development in the presence of high-permeability streaks in both zones (Figure 12B).
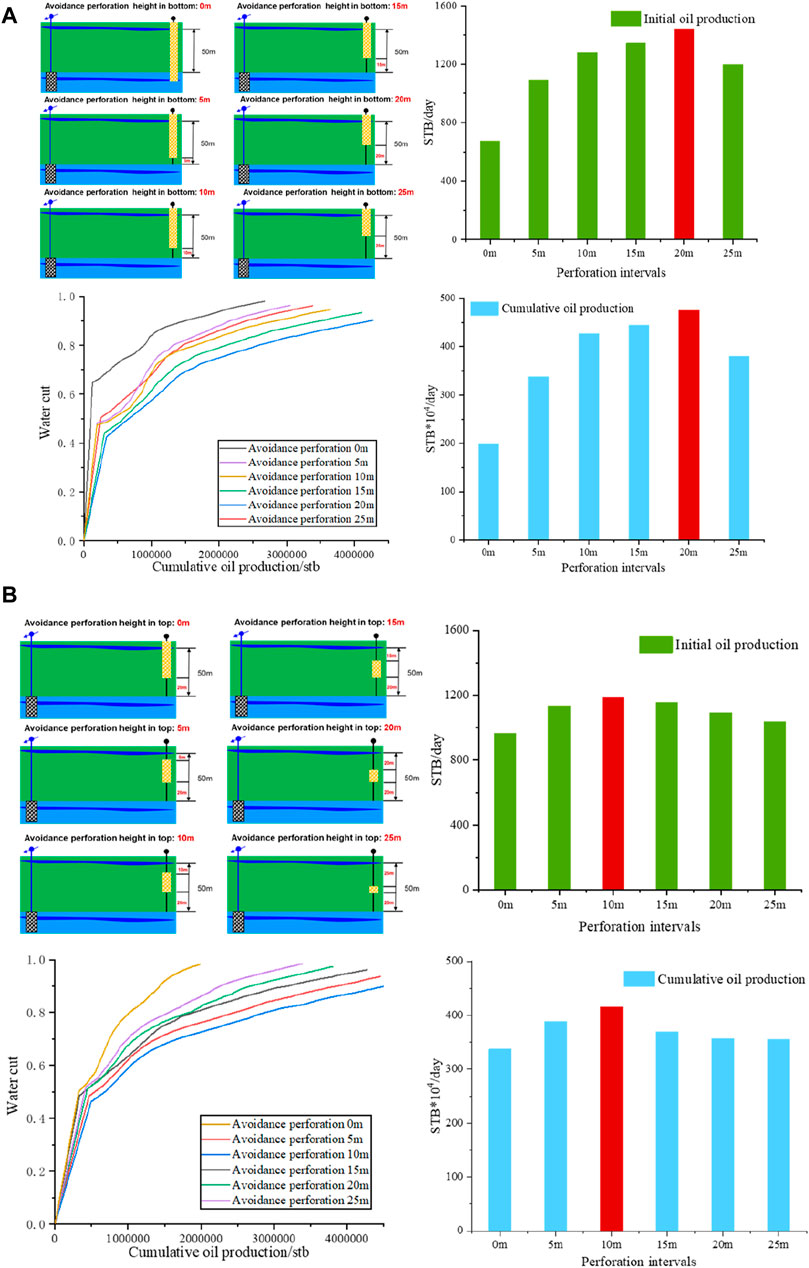
Figure 12. (A) Optimization of avoidance perforation height in bottom for both top and bottom water-out mode. (B) Optimization of avoidance perforation height in top for both top and bottom water-out mode.
For reservoirs without high-permeability streaks in the vertical section, water breakthrough is prone to occur at the bottom. To establish the perforation principle, both the perforation position and perforation length need optimization by using model 3. Initially, set the perforation length to be 10 m, which is the average length of all vertical wells in the studied oilfield, then the optimal perforation position was investigated. Six cases were configured for perforation intervals I+II, II+III, III, III-V, IV-VI, and V+VI, respectively. Research results revealed that, under the same liquid rate, perforation in I+II yielded the highest initial and cumulative production for a single well (Figure 13A). Additionally, the water cut vs. cumulative oil production curve was most favorable. This suggests that the optimal perforation position for this type of water-out should be at the top layer. Based on this, another six cases were conducted to optimize perforation length, ranging from 10 m to 35 m. Under the same production pressure differential, the optimal perforation length was found to be 25 m, approximately 1/4 of the total oil layer thickness (Figure 13B).
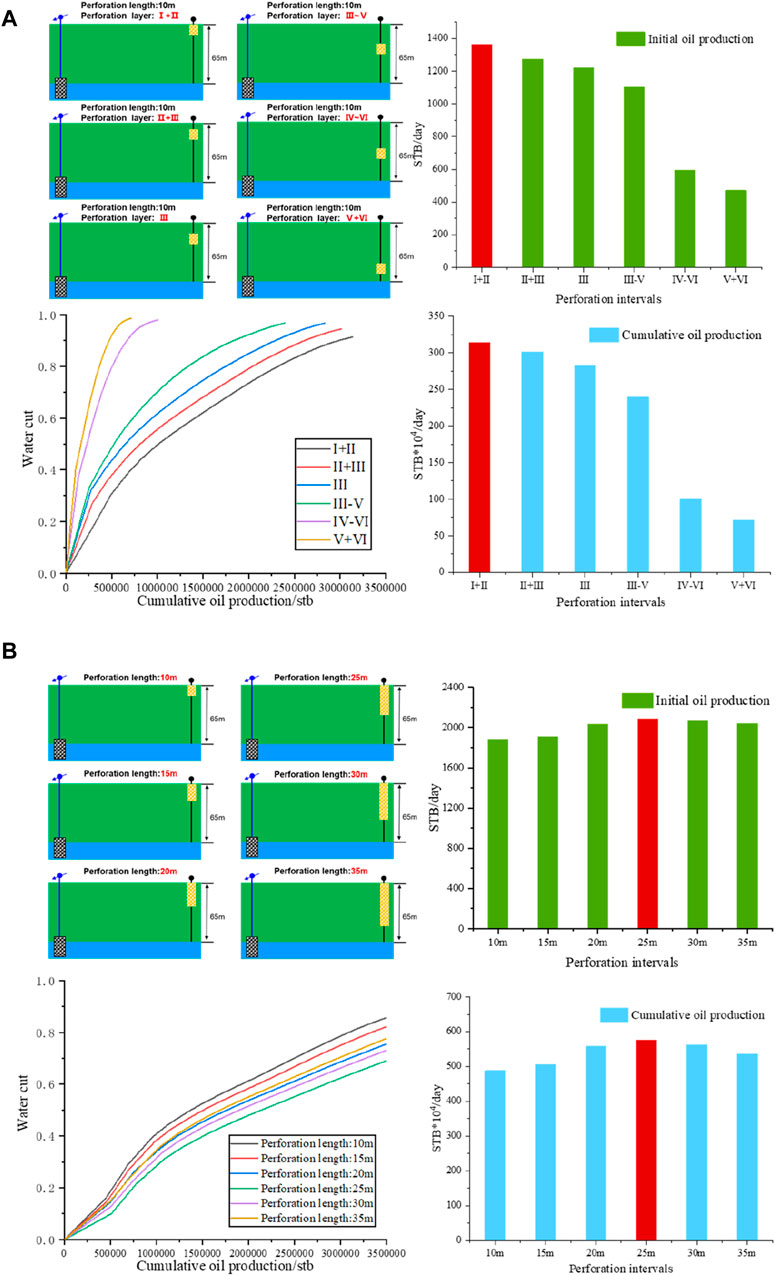
Figure 13. (A) Optimization of perforation position for bottom water-out mode. (B) Optimization of perforation length for bottom water-out mode.
Over the past 2 years, the differentiated perforation principle has been successfully implemented in reservoir B. A notable example is the B-36W well group, where B-6 serves as an older producer, and B-116 as a new producer. After 9 months of water injection of B-36W, the water cut of B-6 began to increase rapidly. Well logging interpretation revealed relatively poor reservoir properties in the lower section of well B-36W, coupled with a high permeability layer at the top. This indicates that the top layer of the B-36W well group was susceptible to water breakthrough.
In response, a new production well, B-116, was drilled, and logging interpretation confirmed that the top layer was indeed water flooded. To mitigate water breakthrough, the differentiated perforation principle was applied to B-116. The avoidance perforation height and perforation length were set at approximately 1/6 and 1/2 of the total oil layer thickness, respectively. After about 3 years of production, the water cut of well B-116 consistently remained below 20%. Moreover, the water cut of the adjacent well, B-6, transitioned from a rapidly increasing trend to a stable state due to a more balanced water flooding streamline in this region (Figure 14).
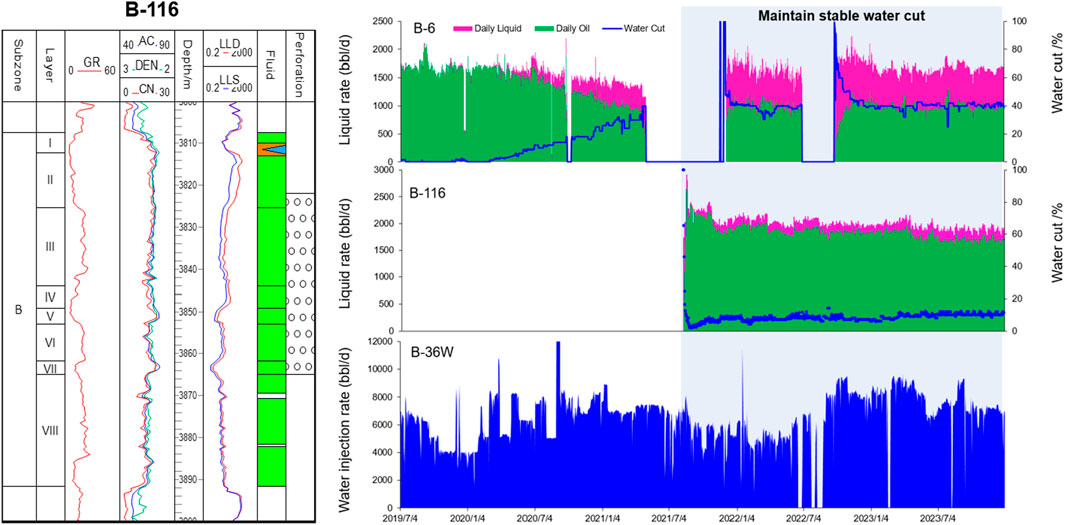
Figure 14. Dynamic performance of B-116 after implementing differentiated perforation.
This practical example serves as a compelling demonstration of the effectiveness and applicability of the differentiated perforation principle in optimizing oilfield performance and delaying water breakthrough challenges in reservoir B.
(1) Water hold up phenomenon in giant carbonate is one of the main causes of pre-matured water breakthrough. Reservoir capillary force barrier caused by wettability and high-perm streak is the key factor triggering the water hold up phenomenon.
(2) The reverse coning phenomenon mainly depends on the combined forces of gravity, capillary force, and downward production differential, among which the downward production differential is the dominant factor.
(3) Differentiated perforation principle in thick carbonate reservoir concludes as: the optimal perforation position is at top layer and the optimal perforation length approximately account for 1/4 of the total oil layer thickness for water-out in bottom; the avoidance perforation height in top accounts for 1/6 of the total oil layer thickness and the optimal perforation length approximately accounts for 1/2 of the total oil layer thickness for water-out in top; the avoidance perforation height in top and bottom accounts for 1/5 and 2/5 of the total oil layer thickness respectively for water-out in both top and bottom, respectively.
The original contributions presented in the study are included in the article/supplementary material, further inquiries can be directed to the corresponding author.
JJ: Conceptualization, Investigation, Validation, Writing–original draft, Writing–review and editing. CP: Writing–original draft. PJ: Writing–review and editing. LC: Writing–review and editing.
The authors declare that no financial support was received for the research, authorship, and/or publication of this article.
Authors JJ, CP, PJ, and LC were employed by CNOOC International Ltd.
All claims expressed in this article are solely those of the authors and do not necessarily represent those of their affiliated organizations, or those of the publisher, the editors and the reviewers. Any product that may be evaluated in this article, or claim that may be made by its manufacturer, is not guaranteed or endorsed by the publisher.
Al-Otaibi, B., Abu Shiekah, I., Jha, M. K., de Bruijn, G., Male, P., Al-Omair, S., et al. (2021). “60 Years field performance data-driven analytics to generate updated waterflood field development plan in a north Kuwait giant carbonate reservoir,” in Abu Dhabi International Petroleum Exhibition and Conference. SPE, Abu Dhabi, 4-7 November 2024. D031S091R002.
AlZaabi, A., Arif, M., Ali, M., Adila, A., Abbas, Y., Kumar, R. S., et al. (2023). Impact of carbonate mineral heterogeneity on wettability alteration potential of surfactants. Fuel 342, 127819. doi:10.1016/j.fuel.2023.127819
Arif, M., Abu-Khamsin, S. A., Zhang, Y., and Iglauer, S. (2020). Experimental investigation of carbonate wettability as a function of mineralogical and thermo-physical conditions. Fuel 264, 116846. doi:10.1016/j.fuel.2019.116846
Balaky, S. M., Al-Dabagh, M. M., Asaad, I. S., Tamar-Agha, M., Ali, M. S., and Radwan, A. E. (2023). Sedimentological and petrophysical heterogeneities controls on reservoir characterization of the Upper Triassic shallow marine carbonate Kurra Chine Formation, Northern Iraq: integration of outcrop and subsurface data. Mar. Petroleum Geol. 149, 106085. doi:10.1016/j.marpetgeo.2022.106085
Barragan, E., Holmquist, A., Thakur, P., Alshalabi, A. A., and Sidek, M. M. (2023). “Lower completion optimization using ultra deep resistivity tool improves reservoir management and lower water production in giant carbonate reservoirs in the Middle East,” in Abu Dhabi International Petroleum Exhibition and Conference. SPE, Abu Dhabi, UAE, October 2023.
Barros, E. G. D., Szklarz, S. P., Hopman, J., Hopstaken, K., Gonçalves da Silva, J. P., Bjørlykke, O. P., et al. (2023). “Well swap** and conversion optimization under uncertainty based on extended well priority parametrization,” in Offshore Technology Conference Brasil. OTC, Rio de Janeiro, Brasil, 24-26 October 2023. D022S053R004.
Bisweswar, G., Al-Hamairi, A., and Jin, S. (2020). Carbonated water injection: an efficient EOR approach. A review of fundamentals and prospects. J. Petroleum Explor. Prod. Technol. 10, 673–685. doi:10.1007/s13202-019-0738-2
Boampong, L. O., Rafati, R., and Haddad, A. S. (2023). Modelling of carbonate rock wettability based on surface charge and calcite dissolution. Fuel 331, 125856. doi:10.1016/j.fuel.2022.125856
Dewever, B., Richard, P., Al-Otaibi, B., Al-Sultan, N., de Zwart, B. R., van Essen, G., et al. (2021). Unlocking flow pathways in complex carbonate reservoirs: benefits of an integrated subsurface study from the Cretaceous Mauddud Formation, North Kuwait. Mar. Petroleum Geol. 126, 104892. doi:10.1016/j.marpetgeo.2020.104892
Ekechukwu, G. K., Khishvand, M., Kuang, W., Piri, M., and Masalmeh, S. (2021). The effect of wettability on waterflood oil recovery in carbonate rock samples: a systematic multi-scale experimental investigation. Transp. Porous Media 138 (2), 369–400. doi:10.1007/s11242-021-01612-3
Esfandyari, H., Hoseini, A. H., Shadizadeh, S. R., and Davarpanah, A. (2021). Simultaneous evaluation of capillary pressure and wettability alteration based on the USBM and imbibition tests on carbonate minerals. J. Petroleum Sci. Eng. 200, 108285. doi:10.1016/j.petrol.2020.108285
Fabbri, C., Al, S. H. A., Wang, K., Maire, F., Romero, C., Cordelier, P., et al. (2021). “Polymer injection to unlock bypassed oil in a giant carbonate reservoir: bridging the gap between laboratory and large scale polymer project,” in Abu Dhabi International Petroleum Exhibition & Conference. OnePetro, Abu Dhabi, UAE, October 2023.
Fabbri, C., Reddicharla, N., Shi, W., Al Shalabi, A., Al Hashmi, S., and Al Jaberi, S. (2023). “Application of machine learning in a giant mature reservoir to speed-up infill prospects screening, optimize field development and improve the ultimate recovery factor,” in SPE Reservoir Characterisation and Simulation Conference and Exhibition. OnePetro, Abu Dhabi, UAE, January 2023.
Faramarzi-Palangar, M., Mirzaei-Paiaman, A., Ghoreishi, S. A., and Ghanbarian, B. (2021). Wettability of carbonate reservoir rocks: a comparative analysis. Appl. Sci. 12 (1), 131. doi:10.3390/app12010131
Farnetano, R. P., Daoud, A. M., Mogensen, K., Fawzy, A., Alnuaimi, E., and Al Sereidi, B. (2023). “Novel completion and stimulation Technologies from planning to execution tripled the injectivity index for the first water injectors in A giant tight carbonate reservoir, onshore abu dhabi,” in SPE Reservoir Characterisation and Simulation Conference and Exhibition. OnePetro, Abu Dhabi, UAE, January 2023.
Feng, Q., Shi, S., Wang, S., Feng, G., Li, X., and Yang, G. (2011). Identification of thief zones based on dynamic data. Petrol. Geol. Recovery effi. 18 (01), 74–76. doi:10.1016/S1003-9953(10)60145-4
Feng, D., Bakhshian, S., Wu, K., Song, Z., Ren, B., Li, J., et al. (2021). Wettability effects on phase behavior and interfacial tension in shale nanopores. Fuel 290, 119983. doi:10.1016/j.fuel.2020.119983
Feng, D., Chen, Z., Wu, K., Li, J., Dong, X., Peng, Y., et al. (2022a). A comprehensive review on the flow behaviour in shale gas reservoirs: multi-scale, multi-phase, and multi-physics. Can. J. Chem. Eng. 100 (11), 3084–3122. doi:10.1002/cjce.24439
Feng, D., Chen, Z., Wu, K., Li, J., Gao, Y., Bi, J., et al. (2022b). Dynamic behavior of miscible binary fluid mixtures in nanopores: implications for CO2-enhanced oil flow in shale reservoirs. Fuel 327, 125128. doi:10.1016/j.fuel.2022.125128
Feng, D., Li, X., Wang, X., Li, J., and Zhang, X. (2018). Capillary filling under nanoconfinement: the relationship between effective viscosity and water-wall interactions. Int. J. Heat Mass Transf. 118, 900–910. doi:10.1016/j.ijheatmasstransfer.2017.11.049
Ghalib, H. B., Al-Hawash, A. B., Muttashar, W. R., Bozdag, A., and Al-Saady, A. A. (2023). Determining the effect of mineral scaling formation under different injection water sources on the performance of Mishrif carbonate reservoir in Halfaya oilfield, Southern Iraq. J. Petroleum Explor. Prod. Technol. 13 (5), 1265–1282. doi:10.1007/s13202-023-01614-5
Ghedan, S. (2010). Thief zones and effectiveness of water shut-off treatments under variable levels of gravity and reservoir heterogeneity in carbonate reservoirs SPE 131055.
Hassan, A. M., Al-Shalabi, E. W., Adila, A. S., Fathy, A., Kamal, M. S., Patil, S., et al. (2023). “Surface complexation modeling for low salinity polymer (LSP) injection in carbonate reservoirs under harsh conditions,” in Abu Dhabi International Petroleum Exhibition and Conference. SPE, 2023: D031S103R005, Abu Dhabi, 4-7 November 2024.
He, E., Lu, L., Zang, K., Wu, X., Jiang, L., Sun, Z., et al. (2015). Features of produced water and countermeasures for water control in porous carbonate reservoirs in Iraq. Journal of Yangtze University (Natural Science Edition) (20), 1–7.
Jie, C., Liang, C., Songi, J., Wang, Y., and Shi, L. (2023). An experimental study on horizontal well waterflooding in the cretaceous porous carbonate reservoir of Oman. Energy Geosci., 100273. doi:10.1016/j.engeos.2023.100273
Jun, W., Rui, G., Limin, Z., Li, W., Zhou, W., and Duan, T. (2016). Geological features of grain bank reservoirs and the main controlling factors: a case study on cretaceous Mishrif formation, Halfaya Oilfield, Iraq. Pet. Explor. Dev. 43 (3), 404–415. doi:10.1016/s1876-3804(16)30047-7
Khurshid, I., and Al-Shalabi, E. W. (2022). New insights into modeling disjoining pressure and wettability alteration byengineered water: surface complexation based rock composition study. J. Petroleum Sci. Eng. 208, 109584. doi:10.1016/j.petrol.2021.109584
Lee, Y., Lee, W., Jang, Y., and Sung, W. (2019). Oil recovery by low-salinity polymer flooding in carbonate oil reservoirs. J. Petroleum Sci. Eng. 181, 106211. doi:10.1016/j.petrol.2019.106211
Li, Y., Zhang, Q., Wang, D., Song, B., and Liu, P. (2020). A fast method of waterflooding performance forecast for large-scale thick carbonate reservoirs. J. Petroleum Sci. Eng. 192, 107227. doi:10.1016/j.petrol.2020.107227
Liu, H., Shi, K., Liu, B., Song, X., Deng, L., Guo, R., et al. (2021). The characteristics and origins of thief zones in the cretaceous limestone reservoirs of Central and Southern Mesopotamian Basin. J. Petrol. Sci. Eng. 201, 108395. doi:10.1016/j.petrol.2021.108395
Liu, L., Zheng, X., He, E., Liu, F., and Luo, H. (2016). “Findings and challenges of high permeability zone on water injection pilots in Iraqi carbonate reservoirs,” in Abu Dhabi International Petroleum Exhibition & Conference, Abu Dhabi, UAE, November 2016.
Mogensen, K., and Masalmeh, S. (2020). A review of EOR techniques for carbonate reservoirs in challenging geological settings. J. Petroleum Sci. Eng. 195, 107889. doi:10.1016/j.petrol.2020.107889
Nascimento, F. P., Pereira, V. D. J., Bastos, L. D. S., Costa, G. M. N., and Vieira de Melo, S. A. B. (2023). Low salinity water–polymer flooding in carbonate oil reservoirs: a critical review. Macromol. React. Eng. 17, 2300007. doi:10.1002/mren.202300007
Nowrouzi, I., Mohammadi, A. H., and Manshad, A. K. (2020). Effects of methanol and acetone as mutual solvents on wettability alteration of carbonate reservoir rock and imbibition of carbonated seawater. J. Petroleum Sci. Eng. 195, 107609. doi:10.1016/j.petrol.2020.107609
Pamungkas, S., and Gueye, T. (2020). “Integrated reservoir model history matching workflow: unlocking reservoir opportunities, onshore abu dhabi, UAE,” in Abu Dhabi International Petroleum Exhibition & Conference. OnePetro, Abu Dhabi, UAE, November 2020.
Pamungkas, S., Gueye, T., Al Hammadi, F. Y., and Al Saadi, H. A. (2020). “A novel technique to constrains kv/kh of carbonate reservoir, A valuable uncertain parameters for history match process,” in Abu Dhabi International Petroleum Exhibition and Conference. SPE, Abu Dhabi, UAE, 9-12 November 2020. D012S116R149.
Pandey, V. K., Thankur, P. D., Pamungkas, S., Thomas, T., Lawatia, R. A., Samir, M., et al. (2023). “Vertical interference testing as a gateway to permeability anisotropy demystification and understanding fluid displacement in carbonates,” in SPE Reservoir Characterisation and Simulation Conference and Exhibition. SPE, Abu Dhabi, UAE, 24–26 January 2023. D021S012R007.
Samani, M. K., Escrochi, M., Kazemzadeh, Y., and Riazi, M. (2023). How does capillary pressure affect the relative permeability curves of heterogeneous carbonate rocks. Geoenergy Sci. Eng. 221, 211358. doi:10.1016/j.geoen.2022.211358
Singh, M., Al Arfi, S., Boyd, D., Gerges, N., Fares, W., Clegg, N., et al. (2020). “Identification & map** of water slum** fronts by ultra-deep electromagnetic logging while drilling Technology in lower cretaceous reservoirs of adnoc onshore,” in Abu Dhabi International Petroleum Exhibition & Conference. OnePetro, Abu Dhabi, UAE, November 2020.
Siyal, A., Rahimov, K., AlAmeri, W., and Al-Shalabi, E. W. (2021). “Recent advances in capillary desaturation curves for sandstone and carbonate reservoirs,” in Abu Dhabi International Petroleum Exhibition and Conference. SPE, Abu Dhabi, UAE, November 2021. D012S141R001.
Siyal, A., Rahimov, K., AlAmeri, W., Al-Shalabi, E. W., and Ahmed, S. (2023). A comprehensive review on the capillary desaturation curves for sandstone and carbonate reservoirs. SPE Reserv. Eval. Eng. 26, 651–675. doi:10.2118/207595-pa
Snosy, M. F., Abu El Ela, M., El-Banbi, A., and Sayyouh, H. (2022). Comprehensive investigation of low salinity waterflooding in carbonate reservoirs. J. Petroleum Explor. Prod. Technol. 12, 701–724. doi:10.1007/s13202-021-01330-y
Souayeh, M., Al-Maamari, R. S., Mansour, A., Aoudia, M., and Divers, T. (2022). Injectivity and potential WettabilityAlteration of low-salinity polymer in carbonates: role of salinity, polymer molecular weight and Concentration,and mineral dissolution. SPE J. 27 (1), 840–863. doi:10.2118/208581-pa
Tackie-Otoo, B. N., Ayoub Mohammed, M. A., Zalghani, H. A. B. M., Hassan, A. M., Murungi, P. I., and Tabaaza, G. A. (2022a). Interfacial properties, wettability alteration and emulsification properties of an organic alkali–surface ActiveIonic liquid system: implications for enhanced oil recovery. Molecules 27 (7), 2265. doi:10.3390/molecules27072265
Thomas, T., Singhal, S., Maire, F., Pandey, V., and Al Hashmi, S. (2020). “Unexpected high water saturation in a mature carbonate reservoir: an holistic investigation,” in Abu Dhabi International Petroleum Exhibition and Conference. SPE, Abu Dhabi, United Arab Emirates, 10–12 September 2024. D011S002R003.
Vermolen, E., Pingo Almada, M., Wassing, B. M., Ligthelm, D. J., and Masalmeh, S. K. (2014). “Low-salinity polymerflooding: improving polymer flooding technical feasibility and economics by using low-salinity make-up brine,” in PaperIPTC 17342, International petroleum technology conference, Doha, Qatar, January 2014.
Wei, C., Li, Z., Yang, J., Liu, S., and Gao, Y. (2022). A comprehensive performance evaluation methodology for miscible gas flooding: a case study in a giant carbonate reservoir in Middle East. J. Petroleum Sci. Eng. 215, 110668. doi:10.1016/j.petrol.2022.110668
Wu, Y., Hu, D., He, B., and Hu, S. (2023). Application of integrated evaluation on seawater injection to improve injectivity for carbonate reservoir in offshore oilfield. J. Phys. Conf. Ser. IOP Publ. 2594 (1), 012019. doi:10.1088/1742-6596/2594/1/012019
Xinmin, S., and Yong, L. I. (2018). Optimum development options and strategies for water injection development of carbonate reservoirs in the middle east. Pet. Explor. Dev. 45 (4), 723–734. doi:10.1016/s1876-3804(18)30075-2
Yang, C., Yang, S., Wang, J., et al. (2022). “Development strategy optimization of a giant carbonate reservoir in Middle East under the condition of water channeling along high permeability layers and interlayer crossflow,” in International Field Exploration and Development Conference, Xinjiang, China, 18th August 2022 (Singapore: Springer Nature Singapore), 4294–4314.
Yao, Y., Wei, M., and Kang, W. (2021). A review of wettability alteration using surfactants in carbonate reservoirs. Adv. Colloid Interface Sci. 294, 102477. doi:10.1016/j.cis.2021.102477
Keywords: carbonate reservoir, water hold-up, reverse coning, differential perforation principle, water-out mode
Citation: Junshuai J, Peiyuan C, Jian P and Changyong L (2024) Research on water-out mode and differential perforation in thick carbonate reservoir. Front. Energy Res. 12:1394282. doi: 10.3389/fenrg.2024.1394282
Received: 01 March 2024; Accepted: 15 April 2024;
Published: 23 May 2024.
Edited by:
Feng Dong, China University of Geosciences, ChinaReviewed by:
Guoqiang Xing, Changzhou University, ChinaCopyright © 2024 Junshuai, Peiyuan, Jian and Changyong. This is an open-access article distributed under the terms of the Creative Commons Attribution License (CC BY). The use, distribution or reproduction in other forums is permitted, provided the original author(s) and the copyright owner(s) are credited and that the original publication in this journal is cited, in accordance with accepted academic practice. No use, distribution or reproduction is permitted which does not comply with these terms.
*Correspondence: Jiang Junshuai, amlhbmdqc2gzQGNub29jLmNvbS5jbg==
Disclaimer: All claims expressed in this article are solely those of the authors and do not necessarily represent those of their affiliated organizations, or those of the publisher, the editors and the reviewers. Any product that may be evaluated in this article or claim that may be made by its manufacturer is not guaranteed or endorsed by the publisher.
Research integrity at Frontiers
Learn more about the work of our research integrity team to safeguard the quality of each article we publish.