 Zhifeng Zheng
 Shinian Peng
 Yu Liu
 Xiaoli Wu
 Yong Xin
94% of researchers rate our articles as excellent or good
Learn more about the work of our research integrity team to safeguard the quality of each article we publish.
Find out more
ORIGINAL RESEARCH article
Front. Energy Res. , 09 July 2024
Sec. Nuclear Energy
Volume 12 - 2024 | https://doi.org/10.3389/fenrg.2024.1392442
The UMo-Al monolithic fuel element has a special failure mode of blistering on the cladding surface under high temperature and high burn-up conditions. In order to provide an auxiliary means for the safety analysis and failure limit formulation of the fuel element, this study establishes a numerical simulation method of fuel failure behavior, considering the fracture behavior and the fission gas pressure acting on the cracks for the UMo-Al monolithic fuel element. Numerical simulation is based on ABAQUS software and the extended finite element method (XFEM) established by programming FORTRAN subroutines UMAT, UMATHT, and UAMP and using the thermo-mechanical sequential coupling method. Combined with Python to secondary develop ABAQUS with the FORTRAN subroutine, this study realizes the coupling of fission gas pressure load and crack propagation. This study obtained the failure threshold temperature, blistering height, area, and other blistering characteristics of the UMo-Al monolithic fuel element through numerical simulation of annealing experiments on L1P460 in RERTR-12. A comparison of the numerical simulation results with the RERTR-12 experiment shows that the method established in this study can effectively analyze blistering failures.
For nuclear non-proliferation, the Reduced Enrichment for Research and Test Reactors (RERTR) has been proposed internationally. RERTR recommends the use of low-enriched uranium without degrading the performance, economics, and safety. The research focus around the world is shifting toward advanced fuels with high uranium density, among which UMo monolithic fuel elements have become a research hotspot due to their extremely high uranium density (>15 gU/cm3) and good irradiation performance. Many countries have carried out manufacturing and irradiation testing of UMo monolithic fuel elements, conducting experiments such as the RERTR and AFIP (Meyer, 2012).
Irradiation experiments have shown that there is a failure mode of UMo monolithic fuel elements. The fuel element develops fractures, and the cladding surface blisters at high temperatures and high burn-up conditions (Meyer, 2012; Perez et al., 2012), which makes the narrow rectangular channel narrower. Meanwhile, the thermal conductivity of the fission gas gathered in cracks is small, leading to a reduction in the heat transfer performance, which may cause localized boiling of the coolant. In serious cases, the blistering on the cladding surface will rupture, and the fission product will be released into the coolant, even causing a serious accident. Therefore, the study of this failure behavior is of great significance for reactor safety.
The irradiation experiments prove that the failure behavior has a threshold temperature under a certain burn-up, but it also shows that the threshold temperature is different under different material combinations, geometric dimensions, manufacturing processes, and irradiation conditions. The safety boundary has limitations, and the experiments are time-consuming, difficult, and costly. Therefore, the establishment of appropriate theoretical models and numerical simulations are important means for the study of failure behavior.
In order to study the failure problem qualitatively, the failure problem was simplified to an axisymmetric bending model (Gao et al., 2012; Wachs et al., 2012). The model is too simplified and does not consider the effects of irradiation, temperature, and geometry. Considering the complexity of the failure behavior, many scholars choose to build finite element models for finite numerical simulations. In order to study the failure problem quantitatively, some models ignore the fuel meat fracture and set the cracked gas cavity in the geometric model by thermo-mechanical coupling, considering the gas pressure load in the gas cavity (Yan et al., 2018; Xiang et al., 2023). The numerical simulation of the failure behavior is realized, and the blistering height of the cladding surface is calculated. However, the model does not correspond to the real physical process of failure and is highly subjective.
In view of the real physical process, this paper will simulate the fracture behavior of the monolithic fuel element based on the extended finite element method (XFEM). The XFEM can realize the automatic propagation simulation of cracks, which is the mainstream method for simulating crack propagation.
Although XFEM is proposed based on the traditional finite element method, it is not easy to implement XFEM in finite element software. It was not until ABAQUS had the XFEM analysis module for the first time that a large number of scholars began to use the XFEM for crack initiation and propagation analysis.
This paper will use ABAQUS finite element software to numerically simulate fuel fracture by the XFEM on the basis of the irradiation–thermal–mechanical coupling finite element model for the UMo-Al monolithic fuel element and establish a numerical simulation method for fuel failure behavior.
The core idea of the XFEM is to deal with discontinuities in the computational domain with an extension function of the discontinuous property shape function base.
In ABAQUS software, the basic principle of the XFEM is based on the method of unit decomposition, which adds some special functions to the displacement function, reflecting the existence of discontinuity. The approximate displacement vector function based on the unit decomposition expansion can be expressed as Eq. 1 (Chen, 2013):
where
In ABAQUS software, the XFEM crack propagation analysis is achieved by defining a damage model of the material. It consists of the initiation criterion and the evolution law. The former is used to determine whether the XFEM cracking mechanism is activated, and the latter is used to determine whether the crack is formally formed.
The damage initiation criterion is represented by an indicator value
where
where
When the criterion is satisfied, the material begins to enter the fracture stage. It introduces the damage variable
where
Energy-based linear damage evolution is considered in this paper. The damage variable D is shown in Eq. 8:
where
According to Hooke’s law in general, in the linear elastic range of materials, the tensor form expresses the relationship between stress
where
where elastic strain delta
where
The thermal strain increment is expressed as Eq. 15:
The irradiation swelling strain increment is expressed as Eq. 16:
The plastic strain increment is expressed as Eq. 17:
where
The above stress update algorithm and the variable properties of the material in Section 2.3 are implemented by programming the ABAQUS subroutine UMAT.
In this paper, the UMo-Al monolithic fuel element numbered L1P460 in the RERTR-12 experiment was selected as the research object, and its fuel was the U-10Mo alloy and the cladding was the Al6061-O alloy.
The fuel density of U-10Mo of L1P460 is
Its coefficient of thermal expansion
where
Its irradiated swelling is expressed as Eq. 19 (Kim et al., 2015):
where
The heat transfer calculation equation is as Eq. 20:
where
The thermal conductivity
The specific heat capacity
The calculation of heat transfer and the physical properties of variable heat are realized by programming the ABAQUS subroutine UMATHT.
For U-10Mo, its breaking strength
The critical equivalent energy release rate of U-10Mo is expressed as Eq. 23 (Griffith, 1921):
where
For the Al6061-O alloy, its density is
where
Its coefficient of thermal expansion is expressed as Eq. 25 (Jian et al., 2019a):
Its thermal conductivity is expressed as Eq. 26 (Jian et al., 2019a):
The specific heat capacity of the constant pressure is shown in Ozaltun and Miller (2012). For Al6061-O, its breaking strength
The results of the L1P460 annealing experiment after irradiation (Meyer, 2012) show nine blisters on the cladding surface, including six on the front and three on the back, and they are numbered from 1 to 9. The threshold temperature of the nine blisters is 673 K. The experimental results show that the blisters are mostly located at the junction. The cracking occurs when the UMo-Al monolithic fuel element fails. The failure process is that the fuel meat produces cracks and propagates to the cladding under the action of fission gas pressure during the annealing experiment. Therefore, it causes the blistering on the cladding surface.
Geometric modeling is based on the UMo-Al monolithic fuel element numbered L1P460 in the RERTR-12 experiment (Miller and Ozaltun, 2012). The fuel element geometric dimension is 101.473 mm × 25.4 mm × 1.397 mm, and the geometric dimensions of the UMo fuel meat is 82.55 mm × 19.05 mm × 0.254 mm, and its structure is shown in Figure 1. The XFEM attribute is given to the No. 4 blistering area, and the mini-crack of 1 mm2 is set at the junction. Considering the amount of calculation and the convergence, the plasticity is only set in the area near the No. 4 blistering on the cladding surface.
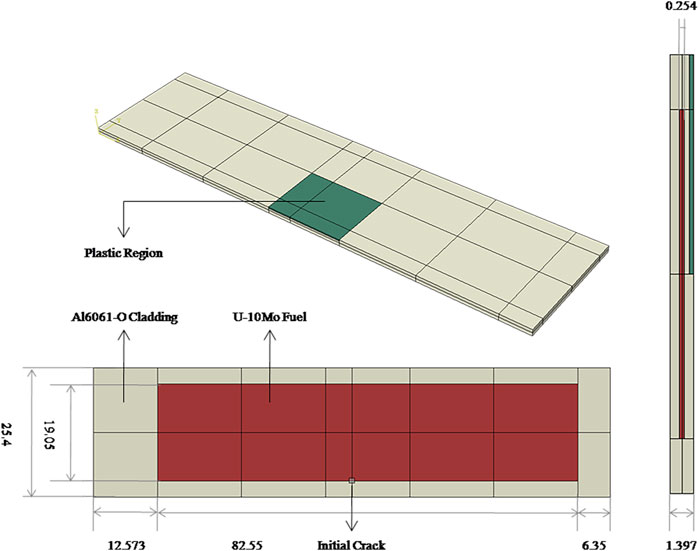
Figure 1. Geometric model of the UMo-Al monolithic fuel element with an initial crack (unit: mm).
In order to calculate the physical properties changing with irradiation of U10-Mo fuel, the burn-up of each node needs to be obtained. In this paper, based on the discrete burn-up of L1P460 after irradiation of the ATR reactor in Perez et al. (2012), the interpolation algorithm is programming by FORTRAN to allocate the burn-up to each node, and Figure 2 shows the U10-Mo burn-up distribution contour.
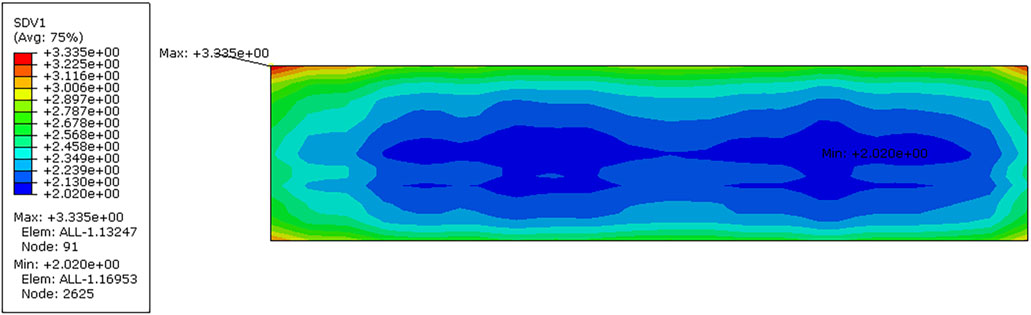
Figure 2. Burn-up distribution of the UMo fuel meat (with a maximum value of 3.335, a minimum value of 2.020, and an average value of 2.35, unit:
The boundary conditions for numerical simulation are that the xy plane, the xz plane, and the yz plane fix the displacement in the z direction, y direction, and x direction respectively, and the rest are free boundary conditions. A model is established with the element type of an eight-node linear hexahedral element and the non-coordinated mode of C3D8I. To determine the number of elements, the mesh independence verification is expanded, as shown in Figure 3, the final number of selected grid elements is 40,824, and the number of nodes is 46,870. The model is shown in Figure 4.
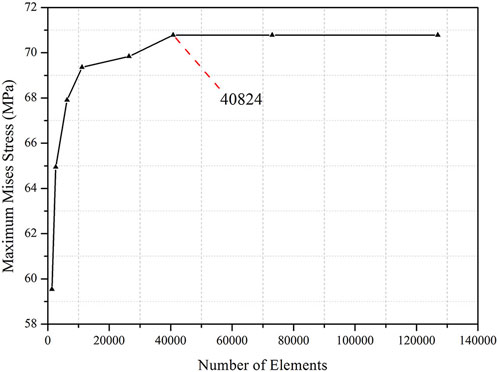
Figure 3. Grid independence verification.
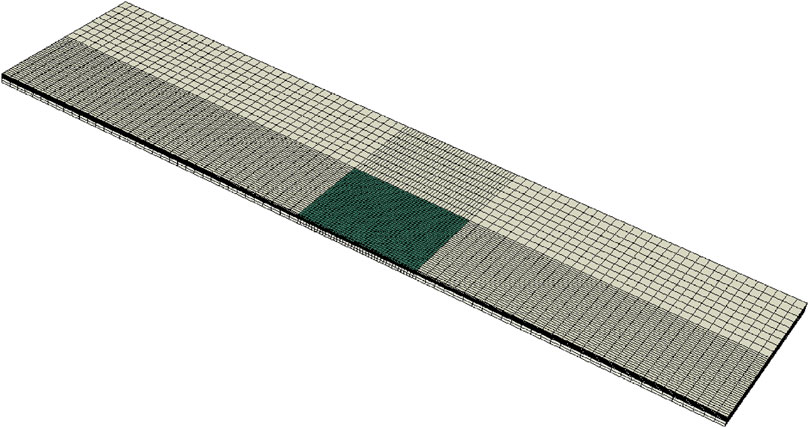
Figure 4. Finite element model of the UMo-Al monolithic fuel element.
The steps of the actual annealing experiment are to heat, hold, cool to room temperature, and visually inspect. If no failure occurs, the experimental sample is raised to a higher temperature, and the above steps are repeated until failure occurs. Therefore, the temperature is changed periodically.
In this paper, the process of cooling and then heating to a higher temperature is simplified. This process is accompanied by the unloading and reloading of the thermal loads. In this paper, the cooling process is omitted and directly heated to a higher temperature, and the final effect is the same as that before simplification. At the same time, the simplification will greatly reduce the calculation amount of numerical simulation.
For the convergence, the first 1 min was applied to the irradiation swelling strain, and no thermal load was applied. Then, the annealing experiment was simulated, starting from 273 K. The strategy of 100 K heating for 15 min and holding for 45 min was selected to raise the temperature to 673 K, and then, the rate of decreasing 100 K for 15 min was selected to reduce the temperature to 273 K. The temperature curve is shown in Figure 5.
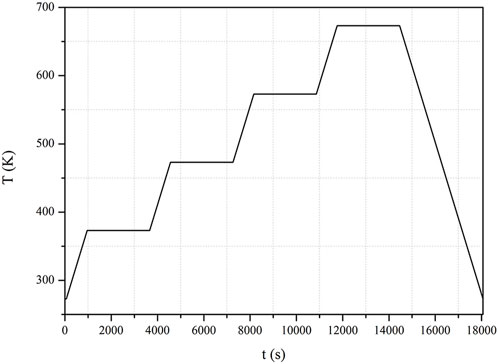
Figure 5. Surface temperature of cladding during the annealing process.
Since the XFEM Analysis Module in ABAQUS is located in the static analysis step, it cannot be used in the temperature–displacement coupling analysis. For the failure behavior, the stress is affected by the temperature, but the temperature is weakly affected by the stress. This paper chooses thermo–mechanical sequential coupling, which is less accurate but more efficient. In this paper, we first performed the heat transfer analysis through the ABAQUS subroutine UMATHT and then used the temperature field as the predefined field in the XFEM analysis and combined it with the ABAQUS subroutine UMAT to numerically simulate the failure behavior.
During the failure process, the crack propagates with the action of fission gas pressure. However, no load can be applied directly to the crack surface at the CAE interface of ABAQUS. In order to apply the gas pressure load on the propagating crack surface, this paper achieves three functions by modifying the input file of the ABAQUS model: (1) real-time creation of the XFEM crack surface, (2) application of the fission gas pressure load on the real-time XFEM crack surface and the amplitude of which is calculated by programming the ABAQUS subroutine UAMP, and (3) field output XFEM crack opening displacement, that is, the crack height.
For the calculation of the fission gas pressure load, the yield of fission gas (Burkes et al., 2016b) of UMo fuel is considered to be 26%, mainly the inert gas mixture of Xe and Kr, accounting for 93% and 7%, respectively. The gas equation of state adopts the ideal gas equation of state as shown in Eq. 27:
where
where
where
In other words, the fission gas pressure load
For the average gas temperature, the historical output request is selected, the temperature is obtained in the subroutine UAMP through the GETSENSORVALUE function, and the arithmetic mean value is taken as the average gas temperature.
Since the GETSENSORVALUE function in the subroutine UAMP can only obtain the historical output and the crack height obtained by modifying the input file is the field output, it cannot be directly obtained in the subroutine UAMP. In order to expand the functions of ABAQUS software, this paper completes the calculation of fission gas pressure and realizes the coupling of fission gas pressure and crack propagation by programming Python to secondary develop ABAQUS with the FORTRAN subroutine and combining with the restart analysis of ABAQUS. Figure 6 shows the Python program flowchart.
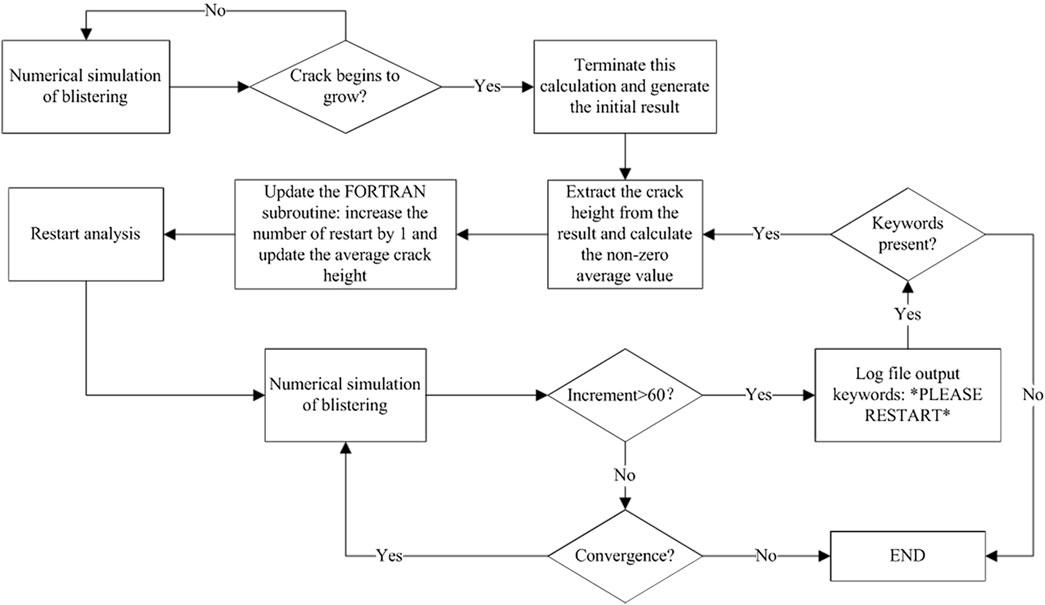
Figure 6. Python program flowchart for coupling fission gas pressure and crack growth.
Due to the good thermal physical properties, the temperature of each node of the UMo-Al monolithic fuel element calculated by the ABAQUS subroutine UMATHT heat transfer is basically the same when the external heat source is heated.
The maximum height (z-direction) displacement and temperature curves of the fuel meat and cladding surfaces obtained by numerical simulation are shown in Figure 7A. Before the temperature rises to 573 K, the maximum height displacements increase slowly with the increase in temperature during the heating period, while the maximum height displacements remain basically unchanged during the holding period, indicating that the mechanical load at this time is mainly thermal stress, the strain is mainly thermal expansion strain, and the height displacement is determined by the thermal expansion characteristics. Before 573 K, the fuel is always in the elastic stage. The maximum height displacement of the cladding is greater because the thermal expansion coefficient of the cladding is larger and the elastic modulus is smaller.
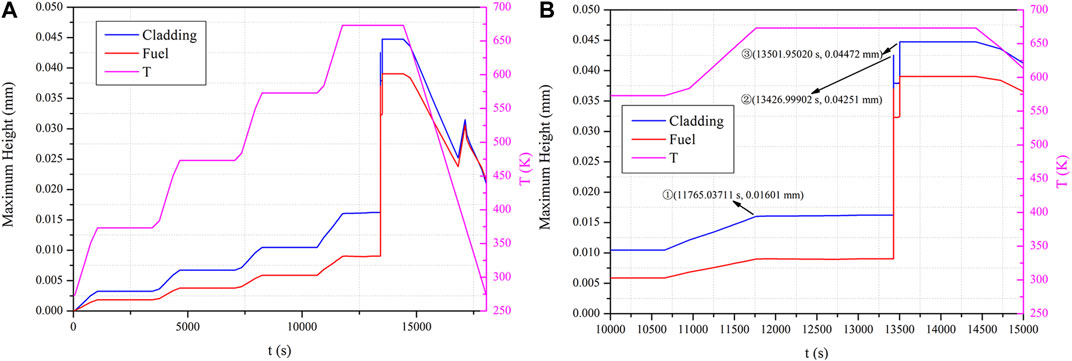
Figure 7. Maximum height (z-direction) displacement of the cladding and fuel meat and temperature curve during the annealing process. (A) Full time graph. (B) Local time graph.
In the heating stage from 573 K to 673 K, it is found that the increase in the maximum height displacement is larger than before. The state of ① in Figure 7B is just heated up to 673 K. At this time, the maximum height displacement of the cladding shell is 0.01601 mm, and the state of crack propagation corresponds to Figure 8B. Contrasting with the initial state of the crack in Figure 8A, the increase in the magnitude becomes larger due to the beginning of crack propagation and the beginning of the action of fission gas pressure.
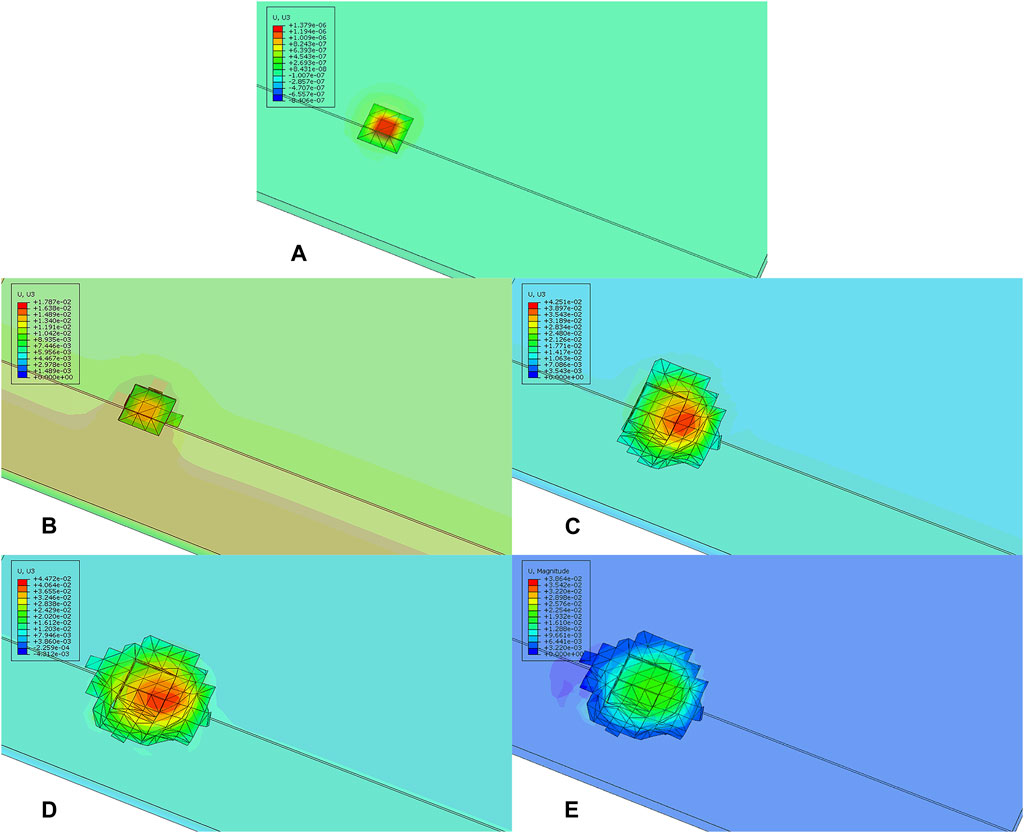
Figure 8. Crack propagation during the annealing process. (A) Initial state. (B) State ① in Figure 7B. (C) State ② in Figure 7B. (D) State ③ in Figure 7B. (E) Final state.
In the first 1,667 s of 673 K insulation, the crack basically did not propagate and the height displacement of the fuel was basically unchanged. After 1,667 s, there are two soaring of fuel height displacement. As shown in state ② in Figure 7B, the height displacement reached 0.04251 mm at 13426.99902 s, and the crack propagation state corresponds to Figure 8C. At this time, the crack further propagated, causing the height displacement to soar. As shown in the ③ state in Figure 7B, the height displacement reaches 0.04472 mm at 13501.95020 s, and the crack propagation state corresponds to Figure 8D, at which the crack shape is consistent, with the final shape of the crack at the end of annealing, as shown in Figure 8E, that is, at this time, the crack propagates sufficiently, and the height displacement soars and remains unchanged in the subsequent holding process.
The temperature at full crack propagation is designated as the blistering threshold temperature. The simulation results in this paper show that fuel failure occurs when the UMo-Al monolithic fuel is held at 673 K for approximately 1,742 s (∼29 min). The threshold temperature of 673 K obtained in this paper is consistent with the threshold temperature of 673 K for the L1P460 test in RERTR-12. The annealing test is difficult to visualize, and it is difficult to know which stage of blistering occurs during heating, holding, and cooling. The simulation results in this paper indicate that the failure occurs during the holding process and that the holding process cannot be omitted from the annealing test. It is also shown that the failure is related to the temperature duration.
In the cooling stage from 673 K to 273 K, the maximum height displacements decrease overall with the decrease in temperature but do not decrease to 0 since the fuel still has a crack with fission gas and has swelled. However, there is a height displacement rise, which is due to the negative feedback effect of a decrease in crack height, which, in turn, leads to an increase in fission gas pressure.
Figure 9A shows the crack opening displacement at the end of annealing, that is, the crack height. The maximum crack height at this point is 0.03162 mm. Figure 9B shows the height displacement of the crack at the end of annealing, where the crack height is the height displacement of the upper surface of the crack minus the height displacement of the lower surface. It can be seen that the crack propagates in all directions and basically only the center region bulges upward. Figure 9C shows a 2D sample of the fuel at the end of the annealing at the cracked surface, which is consistent in shape when compared to the experimental optical image (Meyer, 2012). Since the annealing experiment can only obtain the failure characteristics after cooling, the blistering height of the cladding surface obtained by the experiment is not the maximum height displacement. The height characteristics obtained by the experiment are not conservative enough. The maximum height displacement of the cladding surface can be obtained by numerical simulation, and the maximum height displacement and final height displacement of the cladding surface are 0.04472 mm and 0.02216 mm, as shown in Figures 10A, B, respectively, and the results are more conservation.
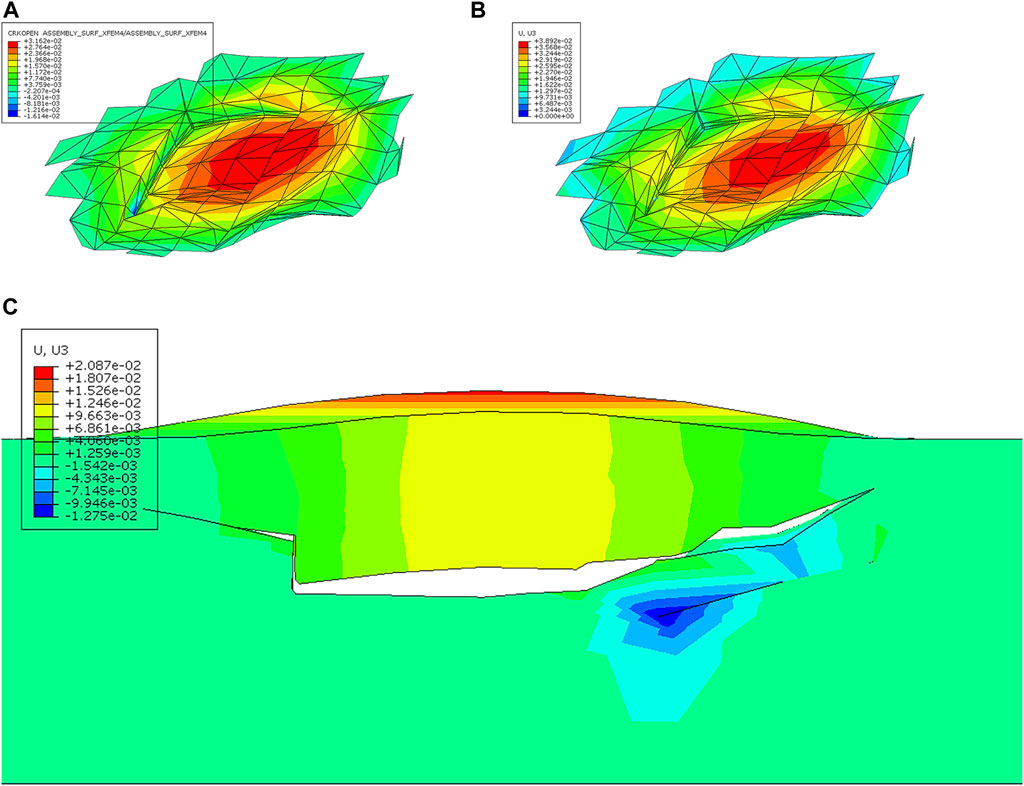
Figure 9. (A) Crack opening height. (B) Crack z-direction displacement. (C) 2D sample of the fuel at the end of the annealing at the cracked surface.
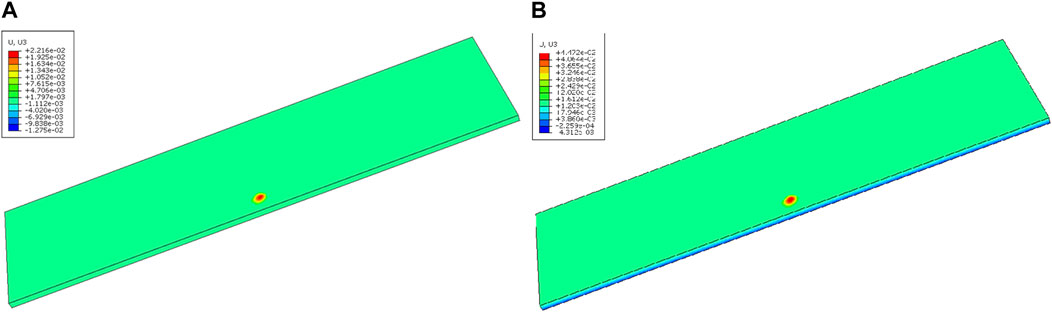
Figure 10. UMo-Al monolithic fuel element Z-direction displacement: (A) maximum value and (B) final value.
The blistering position is located at the junction, consistent with the crack position, which is mainly due to the fact that the fracture performance of Al6061-O is weaker than that of U-10Mo. Although the crack is generated in the fuel meat, the propagation direction is toward the cladding. In order to inhibit fuel failure, on the premise of not losing a large amount of heat transfer performance, the cladding material with better fracture performance can be considered instead of Al6061-O.
The maximum Mises stress, fission gas pressure, and temperature curves of the cladding surface are shown in Figure 11A. Before crack propagation, the Mises stress increases slowly with the increase in temperature and is basically unchanged during the holding period. The fission gas pressure does not act on the whole process. As shown in Figure 11B, with the crack just starting to propagate, the fission gas pressure starts to act, when the crack height is very small, leading to a rapid rise in the fission gas pressure. Before the crack propagates to a certain state, the Mises stress on the cladding surface rises slowly with the crack propagation. When the crack propagates to a certain state, the Mises stress on the surface of the clamshell rises rapidly. When the crack is fully propagated, the Mises stress on the cladding surface reaches the maximum value.
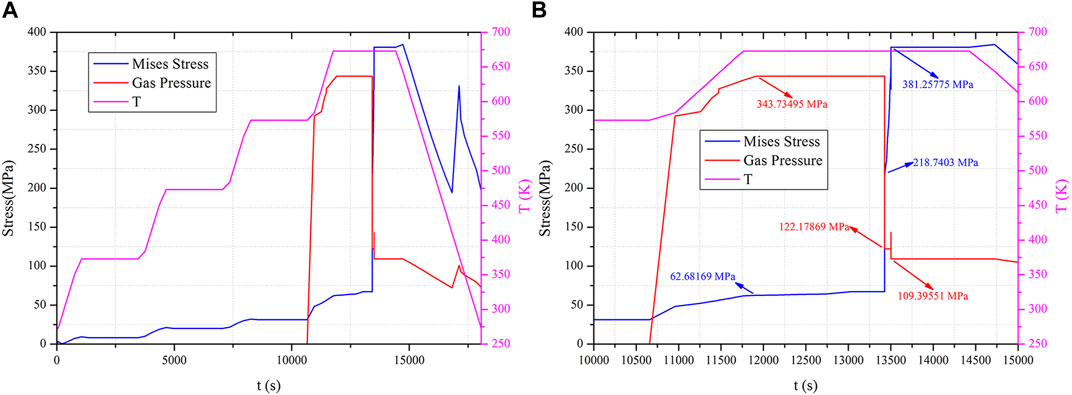
Figure 11. Maximum Mises stress of the cladding and fission gas pressure curve during the annealing process: (A) full time graph and (B) local time graph.
The left side (A, C, E) of Figure 12 shows the fuel meat stress distribution, and the right side (B, D, F) shows the cladding surface stress distribution. Figures 12A, B show the effects of irradiation swelling. Since only the fuel meat is swollen by irradiation, the stress in the fuel meat and cladding are concentrated in the areas of high burnup (long edges and corners, as shown in Figure 2. Figures 12C, D show the state before crack propagation, with the effect of thermal expansion superimposed on the irradiated swelling. Due to the different coefficients of thermal expansion of the fuel core and cladding, the stress concentration at the contact surface is caused. Figures 12E, F show the effect of crack expansion. For the fuel meat, the stress is concentrated at the tip of the crack propagation. For the cladding, there is more pressure load from the fission gas in the crack, so the stress is concentrated at the surface blistering.
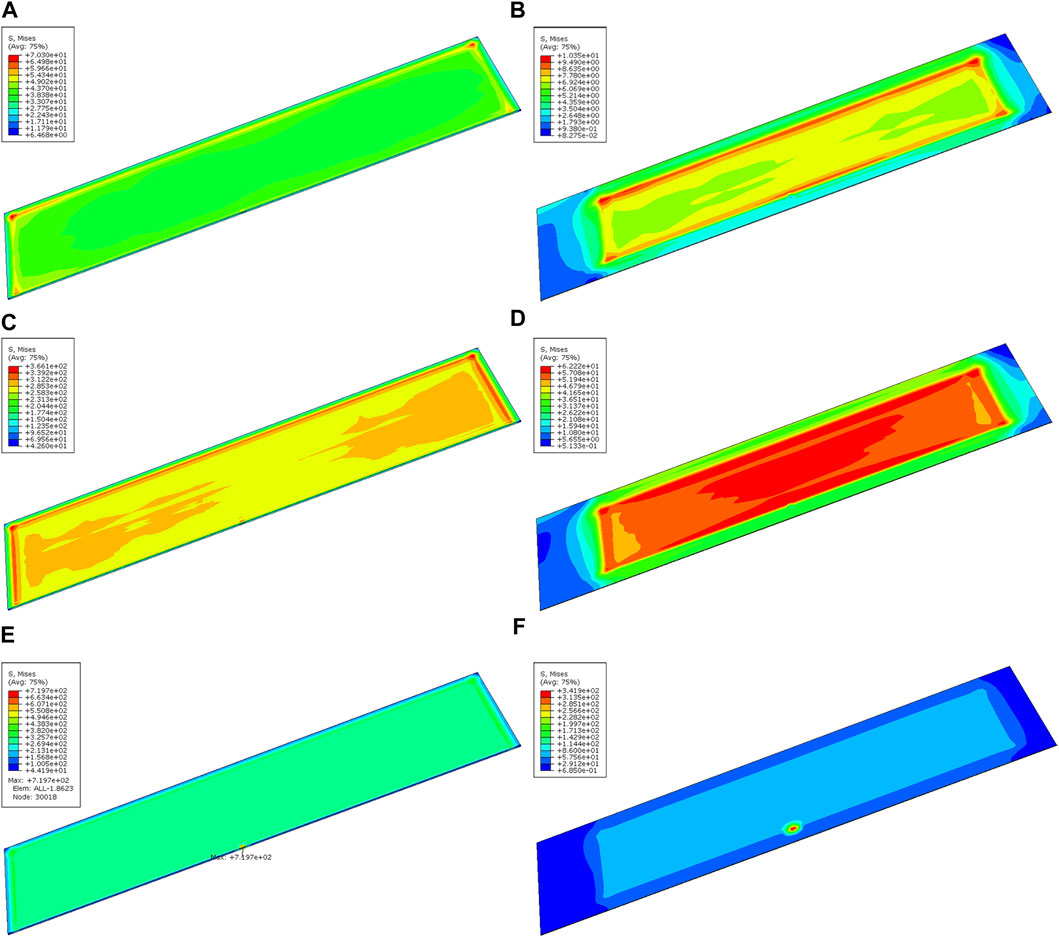
Figure 12. Mises stress distribution of (A) the fuel meat after irradiation swelling, (B) cladding after irradiation swelling (C), fuel meat before blistering, (D) cladding before blistering, (E) fuel meat during blistering, and (F) cladding during blistering.
Figures 13A, B show the Mises stress distribution at the blistering of the cladding surface at the pre-crack propagation and post-crack propagation stages, respectively. In the pre-crack propagation stage, the stress is concentrated at the highest point of the bulge. In the post-crack propagation stage, the stress concentration point is transferred to the contact position between the bottom surface of the bulge and the cladding. Therefore, during the actual operation of the reactor, the highest point of the bulge is most likely to rupture if the temperature rise transient, and during normal operation after blistering, the bottom surface of the bulge is most likely to rupture.
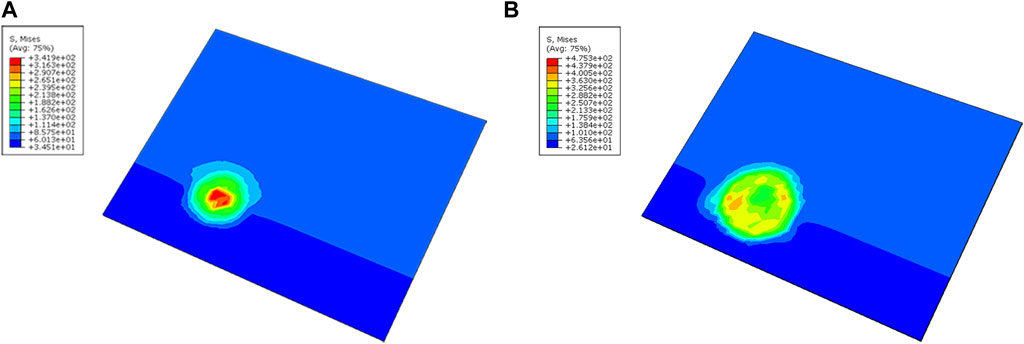
Figure 13. Mises stress distribution of the blistering area during the (A) pre-crack propagation and (B) post-crack propagation stage.
Based on the height displacement distribution at the blistering on the cladding surface in Figure 14, the blistering is approximated to be spherical crowns with a diameter of 2.4274 mm, and the blister area is calculated to be 4.63 mm2. The experimental result for L1P460 in RERTR-12 is 4 mm2 (Meyer, 2012). The simulation is slightly larger than the experiment, possibly due to the conservative fission gas release assumptions.
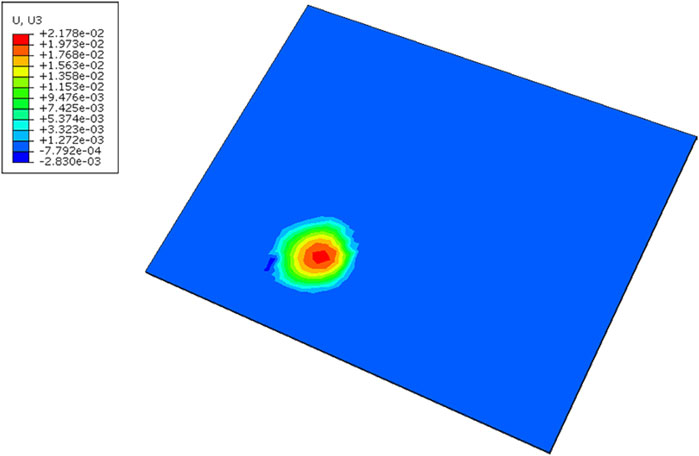
Figure 14. Z-direction displacement distribution of the blistering area after annealing.
By secondary development of ABAQUS and the XFEM, the numerical simulation method of the failure behavior is established by coupling the fission gas pressure with the crack propagation of XFEM, and the results are as follows.
(1) The method established in this study can effectively analyze blistering failures.
(2) The temperature of the UMo-Al monolithic fuel element is basically the same when heated by an external heat source.
(3) The height–direction displacement rises rapidly only after the crack has sufficiently propagated. Calculations in this paper show that the fuel fails when held at 673 K for approximately 29 min. The threshold temperature is consistent with RERTR-12. The maximum blistering height is 0.04472 mm. The blistering area is 4.63 mm2, which is slightly larger than the experimental value of 4 mm2.
(4) The point of stress concentration at the blister on the surface of the cladding transfers. It is located at the highest point of the bulge in the pre-crack propagation stage and at the bottom of the bulge in the post-crack propagation stage.
The raw data supporting the conclusions of this article will be made available by the authors, without undue reservation.
ZZ: writing–original draft and writing–review and editing. SP: writing–review and editing. YL: writing–review and editing. XW: writing–review and editing. HS: writing–review and editing. YX: writing–review and editing. JD: writing–review and editing.
The author(s) declare that financial support was received for the research, authorship, and/or publication of this article. The authors are very grateful for the support of the Rectangular Narrow Channel Core Reflooding Transient Flow and Heat Transfer Characterization Project (U2067210).
The authors declare that the research was conducted in the absence of any commercial or financial relationships that could be construed as a potential conflict of interest.
All claims expressed in this article are solely those of the authors and do not necessarily represent those of their affiliated organizations, or those of the publisher, the editors, and the reviewers. Any product that may be evaluated in this article, or claim that may be made by its manufacturer, is not guaranteed or endorsed by the publisher.
Burkes, D. E., Huber, T. K., and Casella, A. M. (2016a). A model to predict thermal conductivity of irradiated U–Mo dispersion fuel. J. Nucl. Mater. 473, 309–319. doi:10.1016/j.jnucmat.2016.01.012
Burkes, D. E., Senor, D. J., and Casella, A. M. (2016b). A model to predict failure of irradiated U–Mo dispersion fuel. Nucl. Eng. Des. 310, 48–56. doi:10.1016/j.nucengdes.2016.09.032
Chen, Z. (2013). An ABAQUS implementation of the XFEM for hydraulic fracture problems. Eff. Sustain. Hydraulic Fract. doi:10.5772/56287
Gao, L., Chen, B., Jiang, S., Xiao, Z., Yu, J., Zhang, L., et al. (2012). Analysis of blistering mechanism for dispersion-type fuel plates during irradiation. Atomic Energy Sci. Technol. 46, 819–825.
Griffith, A. A. (1921). VI. The phenomena of rupture and flow in solids. Philosophical Trans. R. Soc. Lond. Ser. A, Contain. Pap. a Math. or Phys. Character 221, 163–198. doi:10.1098/rsta.1921.0006
Hales, J. D., Williamson, R. L., Novascone, S. R., Pastore, G., Spencer, B. W., Stafford, D. S., et al. (2016). BISON theory manual the equations behind nuclear fuel analysis. doi:10.2172/1374503
Jia, J., Huang, H., Wang, Z., Zhang, P., and Wu, S. (2013). Microstructure and elevated temperature mechanical properties of cast U-10wt%Mo alloy. Rare Metal Mater. Eng. 42, 1738–1741. doi:10.3969/j.issn.1002-185X.2013.08.042
Jian, X., Kong, X., and Ding, S. (2019a). A mesoscale stress model for irradiated U10Mo monolithic fuels based on evolution of volume fraction/radius/internal pressure of bubbles. Nucl. Eng. Technol. 51, 1575–1588. doi:10.1016/j.net.2019.04.011
Jian, X., Yan, F., Kong, X., and Ding, S. (2019b). Effects of U-Mo irradiation creep coefficient on the mesoscale mechanical behavior in U-Mo/Al monolithic fuel plates. Nucl. Mater. Energy 21, 100706. doi:10.1016/j.nme.2019.100706
Kim, Y. S., Jeong, G. Y., Park, J. M., and Robinson, A. B. (2015). Fission induced swelling of U–Mo/Al dispersion fuel. J. Nucl. Mater. 465, 142–152. doi:10.1016/j.jnucmat.2015.06.006
Meyer, M. K. (2012). Investigation of the cause of low blister threshold temperatures in the RERTR-12 and AFIP-4 experiments. doi:10.2172/1055982
Miller, S. J., and Ozaltun, H. (2012). “Evaluation of U10Mo fuel plate irradiation behavior via numerical and experimental benchmarking,” in IMECE2012, Texas, United States, November 9–15, 2012, 1323–1336. doi:10.1115/IMECE2012-89588
Ozaltun, H., and Miller, S. J. (2012). “Finite element simulations of monolithic plates for the conversion of high performance research and test reactors: NBSR, MITR, MURR and AFIP,” in IMECE2012, Texas, United States, November 9–15, 2012, 1301–1321. doi:10.1115/IMECE2012-89011
Perez, D. M., Lillo, M. A., Chang, G. S., and Wools, N. E. (2012). RERTR-12 insertion 1 irradiation summary report. doi:10.2172/1083246
Rest, J., Kim, Y. S., Hofman, G. L., Meyer, M. K., and Hayes, S. L. (2006). U-Mo fuels handbook. Version 1.0. doi:10.2172/1335129
Wachs, D. M., Glagolenko, I., Rice, F. J., Robinson, A. B., Rabin, B. H., and Meyer, M. K. (2012). Blister threshold based thermal limits for the U-Mo monolithic fuel system.
Xiang, R., He, Y., Deng, C., Niu, Y., Gao, S., Wu, Y., et al. (2023). Numerical simulation on effect of Cr coating on blistering behavior of plate-type fuel element. Atomic Energy Sci. Technol. 57, 1215–1224. doi:10.7538/yzk.2022.youxian.0418
Yan, F., Ding, S., Li, Y., Zhou, Y., Tang, C., and Xin, Y. (2018). Numerical simulation of blistering behavior in UMo/Zr monolithic fuel plate. Atomic Energy Sci. Technol. 52, 1063–1069. doi:10.7538/yzk.2018.52.06.1063
Keywords: failure, monolithic fuel element, blistering, ABAQUS, extended finite element method
Citation: Zheng Z, Peng S, Liu Y, Wu X, Sun H, Xin Y and Deng J (2024) Numerical simulation method of the failure behavior of the UMo-Al monolithic fuel element. Front. Energy Res. 12:1392442. doi: 10.3389/fenrg.2024.1392442
Received: 27 February 2024; Accepted: 14 June 2024;
Published: 09 July 2024.
Edited by:
Turgay Korkut, Sinop University, TürkiyeReviewed by:
Luteng Zhang, Chongqing University, ChinaCopyright © 2024 Zheng, Peng, Liu, Wu, Sun, Xin and Deng. This is an open-access article distributed under the terms of the Creative Commons Attribution License (CC BY). The use, distribution or reproduction in other forums is permitted, provided the original author(s) and the copyright owner(s) are credited and that the original publication in this journal is cited, in accordance with accepted academic practice. No use, distribution or reproduction is permitted which does not comply with these terms.
*Correspondence: Yu Liu, bHktbGl1eXVAMTYzLmNvbQ==
Disclaimer: All claims expressed in this article are solely those of the authors and do not necessarily represent those of their affiliated organizations, or those of the publisher, the editors and the reviewers. Any product that may be evaluated in this article or claim that may be made by its manufacturer is not guaranteed or endorsed by the publisher.
Research integrity at Frontiers
Learn more about the work of our research integrity team to safeguard the quality of each article we publish.