 Bicheng Liu
 Huangqing Xiao
 Ping Yang
- School of Electric Power Engineering, South China University of Technology, Guangzhou, China
To systematically analyze the impact of the DC frequency limit controller (FLC) configuration scheme on the frequency characteristics of asynchronous interconnected power grids with renewable energy integration, a comprehensive frequency analysis model for three-area asynchronous interconnected power grids including the FLC is proposed. The model is based on the SFR model considering renewable energy integration and includes a simplified model of the DC FLC. A rigorous validation of the rationality and stability of the model is achieved through detailed mathematical calculations and pole-zero analysis. Taking the local power grids as an example, the established model is used to study the difference between single- and double-sided configuration of the DC FLC, the relationship between the increase in the renewable energy penetration rate and the frequency characteristics of each regional power grid, and the influence of DC FLC configuration on the maximum acceptance ratio of renewable energy. Through data comparison and theoretical analysis, the influence of FLC configuration on the frequency characteristics of each region of the asynchronous power grid under renewable energy integration is obtained. The results show that the configuration of a bilateral FLC on the DC line has more advantages in alleviating the complementary power disturbance at both ends and obvious limitations on the non-complementary power disturbance at both ends. Compared with the configuration of the bilateral FLC, the configuration of a unilateral FLC on the weak grid has a larger proportion of renewable energy acceptance. When the DC FLC power transmission capacity is sufficient, the weak grid and the adjacent two asynchronous grid DC tie lines are configured with a single-sided FLC, and the weak grid is theoretically connected to the renewable energy penetration rate of up to 100%.
1 Introduction
With the increasing demand for power system load, the scale of the power grid is gradually expanding, and the renewable energy industry is developing rapidly. The power supply structure is changing from fossil energy power generation to large-scale renewable energy power generation (Bedi et al., 2018). Large short-circuit current and large-scale power flow transfer are prone to occur when AC faults occur in large-scale synchronous power grids (O'Sullivan et al., 2014). Decoupling the synchronous power grid into a multi-area asynchronous power grid and interconnection through DC lines can effectively isolate faults (Xiao et al., 2024). The rapid controllability of the DC line also enables the AC system to obtain power support in a timely manner when faults occur, improving the reliability of the system operation (Wang et al., 2019). However, after asynchronous interconnection, the scale of synchronous generators in each regional power grid is reduced, and the reduction in rotational inertia and load increases the risk of frequency instability in each regional power grid. DC block, commutation failure, and large-scale unit failure will cause serious frequency fluctuations (Wang et al., 2023b). In addition, the continuous expansion of the proportion of renewable energy integration causes the asynchronous power grid to experience more serious frequency stability problems (He et al., 2024; Xie et al., 2024). Therefore, the development and improvement of the rapid power regulation technology of DC lines is an important way to maintain frequency stability in the current grids.
At present, the modulation methods of DC lines participating in frequency control mainly include emergency DC power support (EDCPS) and DC power additional control (Xiao et al., 2022). EDCPS is triggered by events and adjusts the DC transmission power according to different strategies, but it relies on complex stability control systems and cannot continuously adjust the frequency in real-time (Zhu et al., 2013). In addition, some scholars have proposed the load frequency control (LFC) based on deep learning (Yan and Xu, 2020). A frequency limit controller (FLC) is widely used in DC power additional control. The FLC can improve the transient frequency stability of weak AC power grids (Sanpei et al., 1994). The principle is to use the fast-response ability of power electronic devices in the controller to quickly mobilize the frequency modulation resources in other regions to suppress the power imbalance of weak AC power grids (Zhang et al., 2022). Regarding power grid frequency modulation, many scholars have done a significant amount of research on the FLC. Scherer and Zolotarev (2015) analyzed the principle and characteristics of the FLC and put forward the cooperation measures between the FLC and other frequency modulation measures. Yogarathinam et al. (2017) explained the regulation characteristics of the FLC and the coordination relationship with the primary frequency control and then proposed the optimal FLC frequency modulation configuration scheme. Xia et al. (2018) studied the characteristics of the FLC and generators and proposed the variable-parameter FLC regulation strategy based during the black start. You et al. (2019) explored the control strategy scheme of power support through the FLC between two power grids with the same intensity and pointed out that the adjustment of the proportional coefficient and dead zone can flexibly control the utilization of frequency modulation resources in the one-sided power grid. On this basis, Wang et al. (2023a) proposed the FLC control logic under different fault scenarios, and the basic framework of FLC configuration for the multi-area asynchronous interconnected power grid is designed. The above research focuses on the principle and coordination of the FLC. There are few studies on the problem of maintaining the frequency stability of regional power grids through the FLC in asynchronous power grids with renewable energy integration.
Based on the analysis of the frequency characteristics of the multi-area asynchronous power grid under different renewable energy penetration rates, this paper reasonably simplifies the mathematical model of the FLC, establishes a multi-area asynchronous interconnected system model including the synchronous generator, FLC, and load frequency response, and verifies the rationality of the model. Based on the model, the influence of different renewable energy penetration rates on the frequency response index of asynchronous power grids is studied. At the same time, the configuration scheme of the FLC to maintain the stability of the regional weak power grid is studied for the proportion of renewable energy integration.
2 Working principle and mathematical model of the DC FLC
2.1 Working principle of the DC FLC
The converter station of the DC transmission line generally adopts constant active power or constant DC voltage control, which does not have a power frequency characteristic, so it cannot participate in frequency regulation. By equipping the FLC to the power outer loop of the constant active power control, the DC transmission lines can adjust the power and realize the frequency modulation. At the same time, in order to ensure the safe and stable operation of the DC line and avoid frequent fluctuation, the DC FLCs generally add a dead zone link. To improve the sensitivity of the response and sufficient power transmission, the FLC adopts the PI control of isochronous control and suppresses the large-scale fluctuation of the system by power reset. The control logic of the DC FLC is divided into two types: reverse frequency difference regression model and integral negative feedback regression model.
The control block diagram of the reverse frequency difference regression model is shown in Figure 1, and the integral negative feedback regression model is shown in Figure 2.
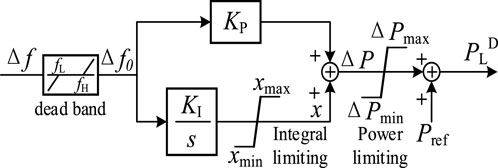
Figure 1. Reverse frequency difference regression model control block.
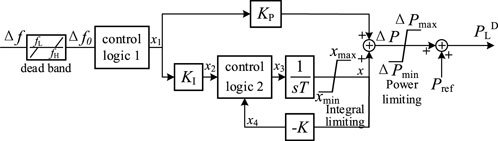
Figure 2. Integral negative feedback regression model control block.
2.2 Reverse frequency difference regression model
In Figure 1, Δf represents the system frequency deviation detected by the DC FLC, which is the difference between the current frequency f and the reference frequency fref of the system; fH and fL represent the upper and lower critical values of the frequency deviation dead zone, respectively; S represents the Laplace operator; KP and KI represent the proportional coefficient and integral coefficient of the PI controller, respectively; xmax and xmin represent the upper and lower limit of the integral state quantity, respectively; symbol x represents the integral state quantity of the PI controller; ΔPmax and ΔPmin represent the upper and lower limit of DC power modulation, respectively; ΔP represents DC power modulation; Pref represents the reference value of the DC transmission power; PLD represents the set value of the DC transmission power; and Δf0 represents the frequency deviation through the dead zone.
If the system frequency deviation Δf is in the dead zone, the frequency state quantity Δf0 is 0, and the DC power modulation amount is also 0, that is, the FLC does not act on the frequency deviation within this range, and the DC line power is transmitted according to the rated value. If the frequency deviation Δf exceeds the upper limit of the dead zone fH, and Δf0 is greater than 0, it is superimposed into the DC modulation amount ΔP after the proportional link and the integral link, and the DC FLC transmission power setting value is added to the power reference value. After the DC transmission power increases, the frequency slowly recovers until the frequency deviation reaches the dead zone. This stage is the FLC regression link. At this moment, the state quantity Δf0 gradually becomes smaller, and the modulation quantity still exists after passing the proportional integral module. When the frequency deviation reaches the dead zone, the integral state quantity x is reduced to 0, and the DC modulation power is also reduced to 0 so that the DC transmission power setting value is consistent with the reference value. The response and regression speed of the FLC depend on the proportional and the integral coefficient. When the frequency deviation Δf is lower than the lower limit fL, the frequency adjustment process and the regression process are similar to the above analysis.
2.3 Integral negative feedback regression model
In Figure 2, x1, x2, x3, and x4 represent the intermediate state variables of the control process. K represents the regression coefficient; t represents the integral time constant; other symbols are the same as those shown in Figure 1. The function of control logic 1 is that when |Δf0|≥0.005 Hz, a delay of 100 ms makes the output state x1 to Δf0, and the FLC is started; when |Δf0|<0.005 Hz, the forced output state x1 is 0. The function of control logic 2 is that when x1 ≠ 0, the output signal x3 selects x2; when x1 = 0, the output signal is selected as x4 after a 60-s delay.
According to the above logic and control, we can see that when the frequency deviation is greater than the upper limit of the dead zone, the DC FLC will delay the action by 100 ms, control logic 1 outputs the frequency state quantity Δf0 after passing through the dead zone, control logic 2 selects the output x2, and the negative feedback regression part stops. At this time, the DC modulation amount ΔP increases continuously so that the DC FLC transmission power setting value will also increase, thereby reducing the system frequency deviation. This process is consistent with the modulation process of the inverse frequency difference regression model. When the frequency is restored to the dead zone of the FLC, the output of control logic 1 is 0, the output of control logic 2 is x4, the FLC enters the regression state, the output state quantity x of the integral negative feedback link gradually decreases to 0, and the transmission power set value PLD is consistent with the reference value Pref. When the frequency deviation is lower than the lower limit of the dead zone, the frequency adjustment process is similar to the above analysis.
The control logic of the integral negative feedback regression model is similar to the reverse frequency difference regression model. The structural difference is mainly reflected in the integral negative feedback link and two logic control parts. The functional difference is mainly reflected in the regression process during frequency recovery.
3 Frequency response model of the multi-area asynchronous interconnected system
At present, the frequency analysis methods of the AC synchronous power grid mainly include ASF and SFR models and improvement methods (Chan et al., 1972). The essence is to model the frequency response of the generator governor, turbine, synchronizer inertia, and load frequency characteristics, and construct the analysis model of frequency characteristics (Kundur, 1994). After the asynchronous partition of the synchronous power grid, the DC lines and its additional control will become an important factor affecting the frequency regulation.
Based on the SFR model, this section constructs a multi-area interconnected power grid frequency response model by the asynchronous interconnection of multi-area power grids and realizes power support and the frequency analysis of asynchronous power grids.
3.1 SFR model of the AC synchronous grid
The SFR model is a simplified model in ASF. It is assumed that the whole power system frequency is uniform, and the frequency modulation control of all units is equivalent to a reheat link speed control system, and the system is converted into a single machine model. The model is shown in Figure 3.
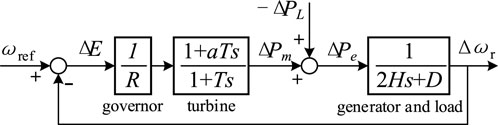
Figure 3. SFR model of the AC synchronous power grid.
In Figure 3, H represents the rotor inertia time constant; D represents the damping coefficient of the load; T represents the equivalent inertia time constant of the turbine; a represents the characteristic coefficient of the turbine, where a = −2 for the water turbine and 0<a<1 for the steam turbine; R represents the adjustment coefficient of the governor; ΔE represents the angular frequency adjustment; ΔPm represents the output power of the generator (mechanical power); ΔPL represents the disturbance power (load power); ΔPe represents the active power difference (electromagnetic power); ωref denotes the reference angular frequency; and Δωr represents the angular frequency deviation of the generator. In the AC synchronous system, the spatial distribution difference of frequency is very small, and the output frequency of the generator can be considered as the frequency of the whole system (Anderson and Mirheydar, 1990).
For power systems with renewable energy integration, it is necessary to introduce parameters that characterize the permeability of renewable energy based on the SFR model (Dai et al., 2022). The renewable energy integration method of the synchronous power grid is mainly realized by replacing synchronous units with renewable energy units. However, renewable energy generators generally do not have frequency modulation capabilities (Ye et al., 2016). Therefore, the synchronous machine per unit coefficient KG participating in frequency modulation is introduced in the turbine part and generator part. The renewable energy permeability λ is expressed as 1-KG.
3.2 Simplified model of the DC FLC
According to the analysis in Section 2, the frequency regulation process of the DC FLC is mainly based on the PI controller of isochronous control, and some limiting links are ignored. The simplified model of the bilateral DC FLC is obtained, as shown in Figure 4.
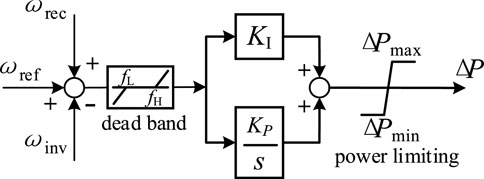
Figure 4. Simplified bilateral DC frequency limit controller (FLC) model.
In the figure, ωrec represents the frequency of the rectifier side, ωinv represents the frequency of the inverter side, and ΔP represents the power modulation amount. When the DC FLC is configured on one side of the rectifier side, the FLC only monitors the frequency deviation of the rectifier side. The DC power modulation amount will be accessed through the additional control of the power outer loop of the converter station. The power adjustment amount only responds to the frequency deviation of the rectifier side, adjusts the DC transmission power, and affects the power distribution at both ends of the transmission and reception.
3.3 Frequency analysis model of the three-area asynchronous interconnected power grid
For multi-area asynchronous interconnected power grids, the power regulation of DC lines will be used as the main frequency regulation measure, and the power regulation effect of the FLC is equivalent to reducing power disturbance (Liu et al., 2023). Therefore, the DC modulation power can be connected to the disturbance power to offset the frequency deviation. According to the characteristics of power generation and load type, each synchronous power grid can be equivalent to an SFR model, which comprises a single turbine, governor, and generator. The interconnection of the three-area asynchronous interconnected power grid can be equivalent to three DC lines and the FLC. By adjusting the signal of FLC input control, one-sided configuration and two-sided configuration of the DC FLC can be selected.
The frequency analysis model of the three-area asynchronous interconnected power grid is shown in Figure 5. In the figure, R1, a1, T1, H1, and D1 represent the equivalent adjustment coefficient, equivalent turbine characteristic coefficient, equivalent turbine inertia time constant, equivalent rotor inertia time constant, and equivalent load damping coefficient of synchronous power grid 1, respectively. KP1 and KI1 represent the proportion coefficient and integral coefficient of the FLC between synchronous power grids 1 and 2. KG1 represents the unit coefficient of the synchronous machine participating in the frequency modulation of synchronous power grid 2. Other parameters are similar.

Figure 5. Frequency analysis model of the three-region asynchronous interconnection network.
3.4 Theoretical analysis
In order to verify the rationality and stability of the proposed model, the theoretical analysis is carried out. Ignoring the dead zone and amplitude limiter module, ωref is set to 0, and only the transfer function relationship between ΔPL1, ΔPL2, and ΔPL3 and the frequency of the three regions Δω1, Δω2, and Δω3 are considered.
Considering only ΔPL1, the whole transfer model shown in Figure 5 is split and simplified to obtain the simplified transfer function model shown in Figure 6.
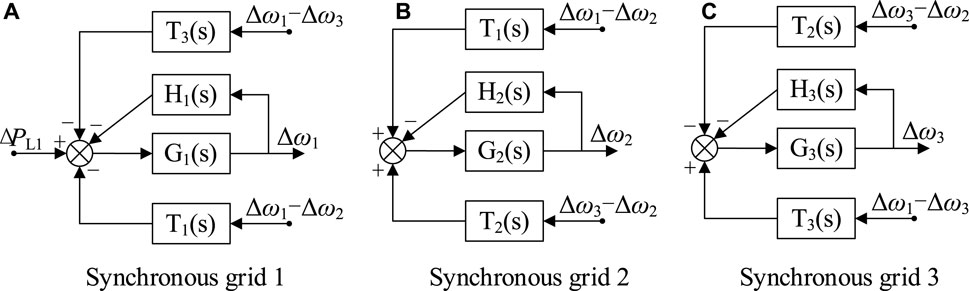
Figure 6. Transfer function simplification model.
In the Figure 6, G1(s) represents the forward path of the transfer function in synchronous grid 1, H1(s) represents the negative feedback path, and T1(s) represents the DC line transfer function between grid 1 and grid 2. Other symbols are similar.
For the convenience of calculation, the transfer function is expressed by symbols. Taking synchronous grid 1 as an example, G1(s), H1(s), and T1(s) are expressed as follows:
According to the simplified rules of the transfer function structure diagram, the negative feedback module is simplified as follows:
G2(s), H2(s), T2(s), G3(s), H3(s), and T3(s) are similar. The transfer function equations of synchronous power grids 1, 2, and 3 are listed as follows:
The transfer function relations between ΔPL1 and Δω1(s), Δω2(s), and Δω3(s) are obtained by solving Eqs 1–5. Similarly, the transfer function relations between ΔPL2, ΔPL3, and Δω1(s), Δω2(s), and Δω3(s) are calculated. The transfer function matrix of the frequency deviation of each region under different disturbance inputs, as shown in Eq 6, is established by the calculation results. The detailed calculation process is shown in Supplementary Material.
For the above matrix expression, the poles of the first-column parameters of the matrix are calculated under typical parameters, as shown in Figure 7. All poles appear in the negative half-plane. According to the necessary and sufficient conditions for the stability of the linear system (Xiao et al., 2023), the model has good stability and can meet the frequency analysis requirements of multi-area asynchronous interconnected power grids.
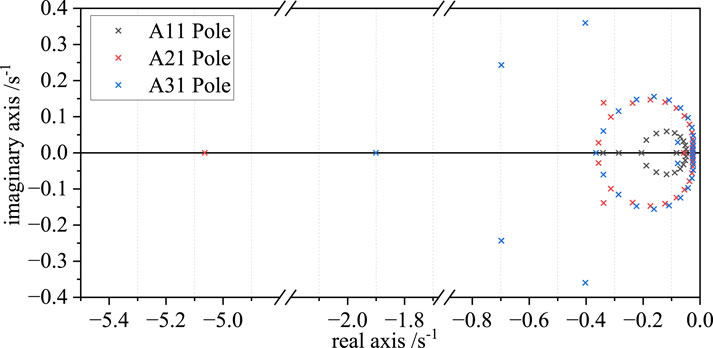
Figure 7. Partial transfer function pole diagram.
According to the frequency response model of the multi-area asynchronous interconnected power grid proposed in this section, the following will take a three-area asynchronous power grid as an example: grid I is rich in hydropower resources and is a sending-end power grid. Grid II is a receiving-end power grid, with a small scale of power generation and load, low grid strength, and poor frequency anti-disturbance ability. Grid III is the main receiving-end area, its power generation and load scale are large, the power grid strength is high, and the frequency stability is good. The following section studies two topics by combining the permeability changes of renewable energy. On one hand, the influence of renewable energy penetration on the lowest frequency decrease is studied, and on the other hand, the relationship between the FLC configuration scheme and the maximum acceptance ratio of renewable energy is studied.
4 Influence of renewable energy permeability on the frequency of the asynchronous power grid
Based on the frequency response model of the multi-area asynchronous interconnected power grid proposed in Section 3, this section studies the influence of DC FLC single and bilateral configurations and the renewable energy penetration rate on the frequency response index of each region.
4.1 DC FLC single- and double-sided configuration difference
Due to the influence of the single-sided and double-sided configuration of the DC FLC on the frequency support capability of each region, the fault type is analyzed by taking the blocking loss of DC lines between synchronous grids I and II as 5,000 MW. At this moment, the two ends belong to complementary power disturbance, only the DC lines and FLC between synchronous grids I and II are considered, and other power grids and lines are not considered.
First, we analyze the maximum frequency deviation of the sending and receiving power grids when the penetration rate of grid II changes. The penetration rate is simulated to increase from 0% to 60% at a step size of 10%. The asynchronous grid connection line is set on the grid-I side and the bilateral FLC. The maximum frequency deviation and quasi-steady state frequency of the two regions are extracted, and the simulation and theoretical analysis are carried out.
The simulation results of one-sided FLC configuration are shown in Figure 8. The frequency decrease of power grid II has reached the set value of low-frequency load shedding, which seriously affects the stable operation of the grid system. With the increase in renewable energy permeability, the frequency of the power grid continues to decrease, and the downward trend of the lowest point becomes larger. The quasi-steady state frequency deviation decreases slowly, but it also continues to increase. The frequency response index of grid I and the FLC transmission power remain.

Figure 8. Simulation results of the DC FLC unilateral configuration.
The increase in grid II permeability leads to a decrease in frequency modulation capacity, and the frequency deviation becomes larger. Since only the one-sided FLC is configured on the grid-I side, the FLC transmission power is determined by the frequency deviation of the one-sided power grid. The permeability of the grid-I side remains, and the frequency response curve is unchanged, so the FLC transmission power remains unchanged. The deterioration in the frequency characteristics of the grid-II side is mainly due to the reduction in frequency modulation resources.
The simulation results of the two-sided FLC configuration are shown in Figure 9. With the increase in the permeability of grid II, the frequency of grid II gradually decreases, the downward trend of the lowest point gradually increases, and the quasi-steady state deviation increases. The frequency deviation of grid I becomes smaller, the trend of the deviation becomes approximately linear, and the quasi-steady state deviation is basically stable. The FLC transmission power increases gradually, and the peak power increases accordingly.

Figure 9. Simulation results of the DC FLC two-sided configuration.
Because the permeability of grid II becomes larger, its frequency modulation resources decrease, and the frequency deviation becomes larger. The power support of grid I obtained through the bidirectional FLC increases, and the effect equivalent to the disturbance power of grid I decreases, so the frequency deviation becomes smaller.
Combined with the above analysis, we can see that the bilateral FLC can adjust the transmission power of the DC line according to the frequency decrease difference between the two sides, which has more advantages in alleviating two-end complementary power disturbances, and can restore the frequency deviation to the range of non-triggering under-frequency load shedding. However, the single-sided FLC can only respond to the permeability change on the FLC configuration side, and the weakening of the frequency modulation resources on the other side cannot be adjusted.
4.2 Study on different permeabilities under a multi-region FLC interconnection
In order to study the influence of different configuration schemes of the DC FLC on the penetration rate of renewable energy, taking a three-area grid as an example, the fault type of blocking 5,000 MW of DC lines between power grids I and II is also set up, and the simulation is carried out considering different FLC configurations. The influence of the permeability change of synchronous grid III on the frequency response index of each grid is analyzed, and the conclusion of DC FLC configuration under the condition of renewable energy integration is summarized.
When the FLC is configured only on the grid-I side, the simulation results are shown in Figure 10. After the fault occurs, grids I and III have a positive frequency deviation, and grid II has a negative frequency deviation. With the increase in the renewable energy penetration rate of grid III, the maximum frequency deviation of grid III increases, the quasi-steady state frequency change is consistent with the maximum frequency deviation trend, and the frequency characteristics of grids I and II do not change. The adjustment of the FLC of each DC line remains unchanged.
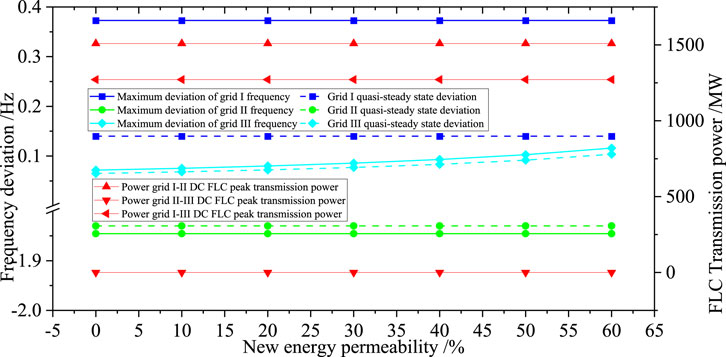
Figure 10. Simulation results of the FLC configuration of the DC line only on the I-side of the power grid.
At this time, non-complementary power disturbances occur in grids I and III. Since only the grid-I side is equipped with the FLC, the DC transmission line only responds to the frequency deviation of the grid-I side, and the change in the renewable energy penetration rate in grid III will not affect the transmission power between grids I, II, and III. The blocking fault of the transmission line leads to an active power surplus of grid I, and the system frequency has a positive deviation so that the power is transmitted to grids II and III through the FLC to adjust the power and reduce the frequency deviation. The active power shortage of grid II causes a negative frequency deviation. The transmission power from grids I to II can reduce the frequency deviation of grid II, but it is not enough to compensate for it completely. Grid III receives the power adjustment transmitted by grid I, resulting in a power surplus and a positive frequency deviation. At the same time, the increase in permeability leads to the decrease in the frequency modulation capacity of power grid III, the weakening of active power consumption capacity, and the increase in the frequency deviation of grid III.
When grid I–II DC lines are configured with the one-sided FLC and grid I–III lines are configured with the bilateral FLC, the simulation results are shown in Figure 11. After the fault occurs, grids I and III have a positive frequency deviation, and grid II has a negative frequency deviation. With the increase in the renewable energy penetration rate of grid III, the frequency positive deviation of grids I and III becomes larger, but the frequency variation of grid I is smaller, and the frequency negative deviation of grid II becomes smaller.
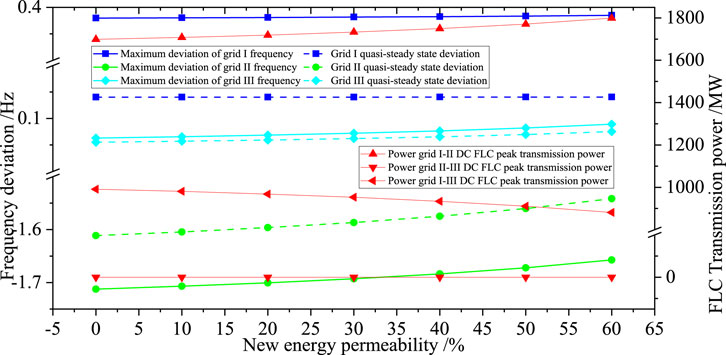
Figure 11. Simulation results of I–II connection lines with the one-sided FLC and I–III connection lines with double-sided FLC.
Grid I will transmit the adjustment power to grids II and III through the FLC. Due to the active power surplus caused by the acceptance power of grid III, the frequency has a positive deviation. The increase in the renewable energy penetration rate of grid III leads to a decrease in frequency modulation capacity, the positive frequency deviation becomes larger, and the frequency difference between grids I and III decreases. According to the control characteristics of the bidirectional FLC, the transmission power of the grid I–III DC FLC is reduced; grid I gains more active surplus, and the positive frequency deviation becomes larger. According to the characteristics of the one-sided FLC, the transmission adjustment power to grid II increases. More active power compensates the power shortage of grid II, and the reverse frequency deviation of grid II decreases.
When only grid I and III sides are configured with the FLC, the results given in Figure 11 are completely consistent. When configuring the FLC on the grid-III side of the grid II–III lines, the frequency deviation range of grid III is in the dead zone of the FLC due to the large frequency modulation capacity. The FLC configured on the line does not respond, and the FLC adjustment power is still zero, that is, the frequency response index of each grid is consistent that given in Figure 11.
When only the I–II lines of the grid are configured with the one-sided FLC, and the other lines are configured with the bilateral FLC, the simulation results are shown in Figure 12. After the fault occurs, grid I has a positive frequency deviation, and grids II and III have a negative frequency deviation. With the increase in the penetration rate of renewable energy in grid III, the negative deviation of the frequency of grids II and III becomes larger, and the positive deviation of grid I frequency decreases.
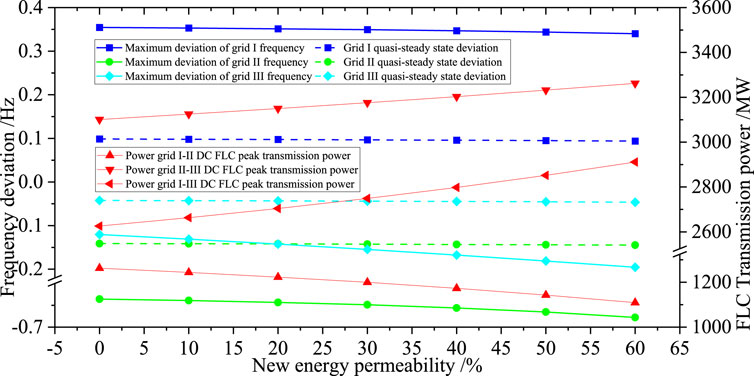
Figure 12. Simulation results of I–II connection lines configured with the one-sided FLC and other connection lines configured with the bilateral FLC.
Because only one-sided FLC is configured in the grid I–II lines, the other lines are configured on both sides. After the fault occurs, grid I surpluses a large amount of power and transmits the power to power grids II and III, and grid II loses a large amount of power and absorbs power from grid III through the line. Because the frequency modulation capacity of grid II is smaller than that of grid I, the frequency deviation is larger than that of grid I. Through the bilateral FLC characteristics, power grid III mainly undertakes the function of transmitting power to power grid II, resulting in frequency reverse deviation. The increase in the permeability of grid III leads to an increase in the negative frequency deviation, and the frequency difference between grids I and II becomes larger. Therefore, the transmission power of grid I to grid III becomes larger, and the power of grid III to absorb power from grid II through the FLC becomes larger. The power disturbance of grid I decreases, and the frequency deviation becomes smaller.
When all DC lines are configured with the bilateral FLC, the simulation results are shown in Figure 13. There is a positive frequency deviation in grid I and a negative frequency deviation in grids II and III. With the increase in the permeability of grid III, the frequency deviation of grids II and III becomes larger, the frequency deviation of grid III becomes more obvious, and the frequency deviation of grid I decreases slightly. After the renewable energy penetration rate increases, the transmission power of grid II–III lines decreases, and the transmission power of grid I–II and I–III lines becomes larger.
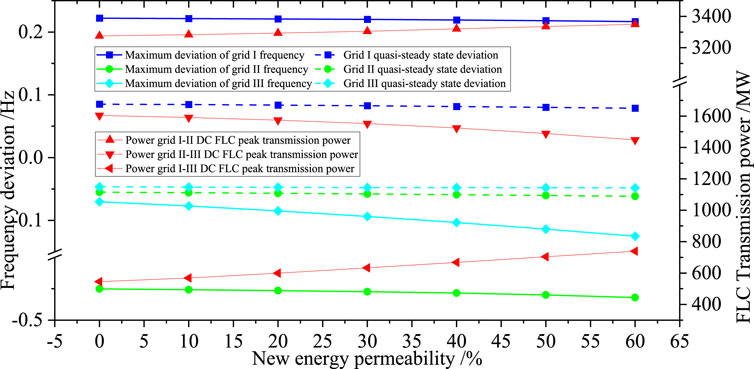
Figure 13. Simulation results of all lines configured with the bilateral FLC.
Due to the configuration of the bilateral FLC on all lines, after the fault occurs, grid I surpluses a large amount of power and transmits the power to the power grids II and III through the FLC. Grid II absorbs power from grids I and III through the line FLC due to the loss of a large amount of power. Similarly, because the frequency modulation capacity of grid II is smaller than that of grid I, grid III mainly undertakes the function of transmitting power to grid II, resulting in a negative frequency deviation. The frequency modulation capacity of grid III is reduced, the power support provided to grid I becomes larger, and the power support provided to grid II becomes smaller, so the positive frequency deviation of grid I becomes smaller, and the negative frequency deviation of grid II becomes larger. Because the frequency modulation capacity of grid II is small, the frequency deviation of grid II decreases more, so the frequency difference between the grid I and II is larger. According to the characteristics of the bilateral FLC, the FLC adjustment of the line between grids I and II is slightly larger.
Combined with the above analysis and comparison, it can be seen that the bilateral FLC has limitations in alleviating the non-complementary power disturbance at both ends. The fault side cannot make full use of the contralateral frequency modulation resources, and the power regulation effect of the DC FLC is not good. At the same time, when the frequency modulation capacity at one end is small, the configuration of the bilateral FLC will lead to excessive power support on the opposite side. After the integration of renewable energy, the frequency deviation on the support side increases in reverse.
5 The impact of FLC configuration on the maximum acceptance ratio of renewable energy
The maximum acceptance ratio of renewable energy in the synchronous power grid is mainly related to the available frequency modulation capacity and system inertia. The stronger the system inertia is, the stronger the renewable energy acceptance ability of the strong power grid is. For the multi-area asynchronous power grid, the DC line configured with the FLC can quickly transfer the frequency modulation capacity of the adjacent regional grid, which can improve the renewable energy acceptance capacity of the weak power grid. Therefore, this section uses the model proposed to study the impact of DC FLC configuration on the maximum acceptance ratio of renewable energy.
Taking grid II with weak and poor renewable energy acceptance ability as an example, the fault type is set to be locked in the 2,000-MW generator set in grid II, and the maximum renewable energy acceptance ratio of grid II under different FLC configuration conditions is compared. The maximum frequency deviation limit of a grid transient is ±0.4 Hz. The simulation results are shown in Table 1.
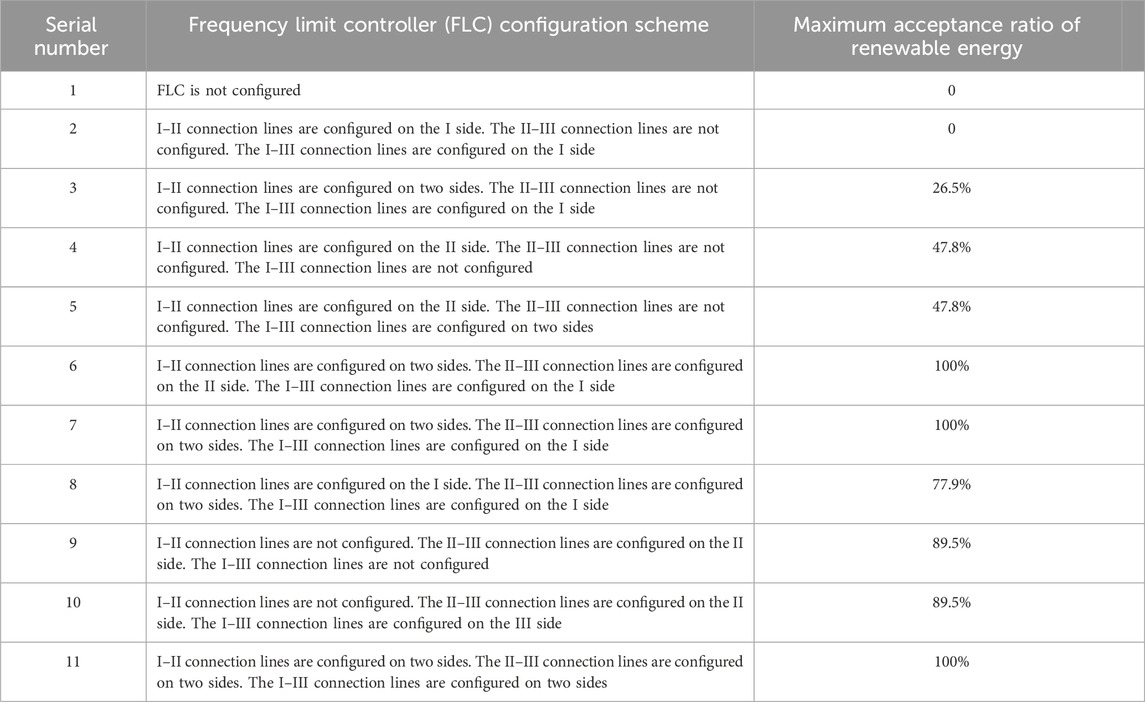
Table 1. Relationship between frequency limit controller (FLC) configuration and renewable energy acceptance ratio.
The simulation analysis shows that when grid II and the external line are not configured with the two-sided FLC, the system frequency deviation exceeded the set transient maximum frequency deviation limit after the large-scale generator off-grid fault occurs in synchronous grid II with small frequency modulation capacity, and it does not have the capacity to accept renewable energy. When the grid-II DC line is configured with a single FLC with II-side, the grid can have a certain renewable energy acceptance capacity. By this time, the renewable energy acceptance ratio is positively correlated with the strength of the opposite grid. Combined with the analysis conclusions and simulation results given in Section 4, only the double-sided configuration has a stronger renewable energy acceptance capacity than the bilateral configuration of grid II. By this time, the FLC configured on the opposite power grid has little effect on the renewable energy acceptance capacity of grid II. When the grid-II DC line is configured with two double-sided FLCs, the grid can theoretically accept 100% renewable energy, and the power regulation of the line FLC is sufficient to support all power disturbances of the grid in a short time.
6 Conclusion
This paper first analyzes the control process and working principle of the FLC and then simplifies the FLC model. Based on the SFR model with a synchronization coefficient, a frequency analysis model of the three-area asynchronous interconnected power grid is proposed. Detailed theoretical calculation is carried out to verify the validation and effectiveness of the proposed model. Building upon this model, the influence of the renewable energy penetration rate on the frequency characteristics of the asynchronous grid under different FLC configuration schemes is studied, and the relationship between FLC configuration and renewable energy acceptance capacity of the weak power grid is analyzed. The main conclusions of this paper are as follows:
(1) The bilateral FLC demonstrates superior effectiveness in mitigating two-end complementary power disturbances but exhibits obvious limitations in the face of two-end non-complementary power disturbances. The configuration of the bilateral FLC may result in an excess of frequency modulation capacity, leading to a greater frequency deviation on the support side.
(2) In the cases where the weak grid lacks inherent capacity to accept renewable energy, configuring the FLC on the DC line enables the weak grid to assimilate some renewable energy. Notably, the unilateral FLC on the weak grid side facilitates a larger proportion of renewable energy acceptance than the bilateral FLC.
(3) Under conditions of sufficient DC FLC power transmission capacity, configuring the unilateral FLC on the weak grid and its adjacent two asynchronous grid DC lines enables the grid to theoretically accommodate 100% renewable energy.
Data availability statement
The original contributions presented in the study are included in the article/Supplementary Material; further inquiries can be directed to the corresponding author.
Author contributions
BL: writing–original draft, writing–review and editing, and formal analysis. HX: methodology, writing–review and editing, resources, and validation. PY: supervision, writing–review and editing, and funding acquisition. ZC: supervision, writing–review and editing, and validation.
Funding
The author(s) declare that financial support was received for the research, authorship, and/or publication of this article. This work was supported in part by the National Key R&D Program of China under Grant 2023YFB4203102.
Conflict of interest
The authors declare that the research was conducted in the absence of any commercial or financial relationships that could be construed as a potential conflict of interest.
Publisher’s note
All claims expressed in this article are solely those of the authors and do not necessarily represent those of their affiliated organizations, or those of the publisher, the editors, and the reviewers. Any product that may be evaluated in this article, or claim that may be made by its manufacturer, is not guaranteed or endorsed by the publisher.
Supplementary material
The Supplementary Material for this article can be found online at: https://www.frontiersin.org/articles/10.3389/fenrg.2024.1392285/full#supplementary-material
References
Anderson, P. M., and Mirheydar, M. (1990). A low-order system frequency response model. IEEE Trans. Power Syst. 5, 720–729. doi:10.1109/59.65898
Bedi, G., Venayagamoorthy, G. K., Singh, R., Brooks, R. R., and Wang, K. C. (2018). Review of internet of things (IoT) in electric power and energy systems. IEEE Internet Things J. 5, 847–870. doi:10.1109/JIOT.2018.2802704
Chan, M. L., Dunlop, R. D., and Schweppe, F. (1972). Dynamic equivalents for average system frequency behavior following major distribances. IEEE Trans. Power Apparatus Syst. PAS 91, 1637–1642. doi:10.1109/TPAS.1972.293340
Dai, B., Ye, L., Zhao, Y., Wang, K., and Liao, H. (2022). Review of frequency response analysis and evaluation methods for new power system. 4th Int. Conf. Smart Power Internet Energy Syst. SPIES 2022, 1279–1283. doi:10.1109/SPIES55999.2022.10082231
He, H., Xiao, H., and Yang, P. (2024). Analysis and quantitative evaluation of wind turbine frequency support capabilities in power systems. Front. Energy Res. 12. doi:10.3389/fenrg.2024.1363198
Liu, B., Xiao, H., Cai, Z., and Yang, Y. (2023). Study on frequency characteristics of receiving power system with large-scale offshore wind power generation. Energy Rep. 9, 596–607. doi:10.1016/j.egyr.2023.04.054
O'Sullivan, J., Rogers, A., Flynn, D., Smith, P., Mullane, A., and O'Malley, M. (2014). Studying the maximum instantaneous non-synchronous generation in an Island system-frequency stability challenges in Ireland. IEEE Trans. Power Syst. 29, 2943–2951. doi:10.1109/TPWRS.2014.2316974
Sanpei, M., Kakehi, A., and Takeda, H. (1994). Application of multi-variable control for automatic frequency controller of HVDC transmission system. IEEE Trans. Power Deliv. 9, 1063–1068. doi:10.1109/61.296291
Scherer, M., and Zolotarev, P. (2015) Frequency-response coupling between synchronous areas in Europe. IEEE Eindh. PowerTech, PowerTech. 2015 - July 2, 2015. doi:10.1109/PTC.2015.7232681
Wang, Y. Z., Wen, W. J., Wang, C. S., et al. (2019). Adaptive voltage droop method of multiterminal VSC-HVDC systems for DC voltage deviation and power sharing. IEEE Trans. Power Deliv. 34, 169–176. doi:10.1109/tpwrd.2018.2844330
Wang, J., Chen, Y., Xu, G., et al. (2023a). Coordination strategy of frequency limit control on multi-area HVDCs under asynchronous interconnection. Power Syst. Technol. 47, 3971–3979. doi:10.13335/j.1000-3673.pst.2022.2386
Wang, S., Li, F., Zhang, G., and Yin, C. (2023b). Analysis of energy storage demand for peak shaving and frequency regulation of power systems with high penetration of renewable energy. Energy 267, 126586. doi:10.1016/j.energy.2022.126586
Xia, C., Li, C., Lan, H., Du, Z., and Chen, Y. (2018). Frequency regulation strategy based on variable-parameter frequency limit control during black start. IET Generation, Transm. Distribution 12, 4002–4008. doi:10.1049/iet-gtd.2018.5416
Xiao, H., Gan, H., Yang, P., Li, L., Hao, Q., et al. (2023). Robust submodule fault management in modular multilevel converters with nearest level modulation for uninterrupted power transmission. IEEE Trans. Power Deliv., 1–16. doi:10.1109/TPWRD.2023.3343693
Xiao, H., He, H., Zhang, L., and Liu, T. (2024). Adaptive grid-synchronization based grid-forming control for voltage source converters. IEEE Trans. Power Syst. 39, 4763–4766. doi:10.1109/TPWRS.2023.3338967
Xiao, H., Liu, B., Huang, X., and Cai, Z. (2022). Synchronous generator imitation control and dynamic power sharing for distributed power generation systems. Front. Energy Res. 10. doi:10.3389/fenrg.2022.842318
Xie, X., Zhang, J., Sun, Y., and Fan, J. (2024). A measurement-based dynamic harmonic model for single-phase diode bridge rectifier-type devices. IEEE Trans. Instrum. Meas. 73, 1–13. doi:10.1109/TIM.2024.3370782
Yan, Z., and Xu, Y. (2020). A multi-agent deep reinforcement learning method for cooperative load frequency control of a multi-area power system. IEEE Trans. Power Syst. 35, 4599–4608. doi:10.1109/TPWRS.2020.2999890
Ye, H., Pei, W., and Qi, Z. (2016). Analytical modeling of inertial and droop responses from a wind farm for short-term frequency regulation in power systems. IEEE Trans. Power Syst. 31, 3414–3423. doi:10.1109/TPWRS.2015.2490342
Yogarathinam, A., Kaur, J., and Chaudhuri, N. R. (2017). Impact of inertia and effective short circuit ratio on control of frequency in weak grids interfacing LCC-HVDC and DFIG-based wind farms. IEEE Trans. Power Deliv. 32, 2040–2051. doi:10.1109/TPWRD.2016.2607205
You, G., Guo, X., Zhu, X., Li, L., Xiao, L., Xu, Z., et al. (2019). Parameters tuning and coordination control of the frequency limit controller. J. Eng. (Stevenage). 2019, 2102–2105. doi:10.1049/joe.2018.8893
Zhang, H., Wei, K., Wei, Y., and Zhu, H. (2022). Emergency power control strategy of HVDC FLC based on modified SFR model in islanded HVDC sending system. Int. J. Electr. Power Energy Syst. 142, 108314. doi:10.1016/j.ijepes.2022.108314
Keywords: asynchronous interconnection, frequency limit controller, renewable energy permeability, frequency characteristic, analytical model
Citation: Liu B, Xiao H, Yang P and Cai Z (2024) Influence of the DC frequency limit controller on the frequency characteristics of the multi-area asynchronous interconnected power grid with renewable energy integration. Front. Energy Res. 12:1392285. doi: 10.3389/fenrg.2024.1392285
Received: 27 February 2024; Accepted: 11 March 2024;
Published: 25 March 2024.
Edited by:
Wei Qiu, Hunan University, ChinaCopyright © 2024 Liu, Xiao, Yang and Cai. This is an open-access article distributed under the terms of the Creative Commons Attribution License (CC BY). The use, distribution or reproduction in other forums is permitted, provided the original author(s) and the copyright owner(s) are credited and that the original publication in this journal is cited, in accordance with accepted academic practice. No use, distribution or reproduction is permitted which does not comply with these terms.
*Correspondence: Huangqing Xiao, eGlhb2hxQHNjdXQuZWR1LmNu