 Amel Ali Alhussan1*
 Doaa Sami Khafaga
 El-Sayed M. El-kenawy
 Marwa M. Eid
 Abdelhameed Ibrahim
- 1Department of Computer Sciences, College of Computer and Information Sciences, Princess Nourah bint Abdulrahman University, Riyadh, Saudi Arabia
- 2MEU Research Unit, Middle East University, Amman, Jordan
- 3Department of Communications and Electronics, Delta Higher Institute of Engineering and Technology, Mansoura, Egypt
- 4Faculty of Artificial Intelligence, Delta University for Science and Technology, Mansoura, Egypt
- 5Computer Engineering and Control Systems Department, Faculty of Engineering, Mansoura University, Mansoura, Egypt
The study of electric vehicles (EVs) aims to address the critical challenges of promoting widespread adoption. These challenges include EVs’ high upfront costs compared to conventional vehicles, the need for more sufficient charging stations, limitations in battery technology and charging speeds, and concerns about the distance EVs can travel on a single charge. This paper is dedicated to designing an innovative strategy to handle EV charging station arrangement issues in different cities. Our research will support the development of sustainable transportation by intelligently replying to the challenges related to short ranges and long recharging times through the distribution of fast and ultra-fast charge terminals by allocating demand to charging stations while considering the cost variable of traffic congestion. A hybrid combination of Dynamic Greylag Goose Optimization (DGGO) algorithm, as well as a Long Short-Term Memory (LSTM) model, is employed in this approach to determine, in a cost-sensitive way, the location of the parking lots, factoring in the congestion for traffic as a variable. This study examines in detail the experiments on the DGGO + LSTM model performance for the purpose of finding an efficient charging station place. The results show that the DGGO + LSTM model has achieved a stunning accuracy of 0.988,836, more than the other models. This approach shapes our finding’s primary purpose of proposing solutions in terms of EV charging infrastructure optimization that is fully justified to the EV’s wide diffusion and mitigating of the environmental consequences.
1 Introduction
Electric Vehicle (EV) charging stations are the key facilities on which the infrastructure of the future that is necessary for the massive use of electric vehicles is built. These stations are a vital service for recharging the batteries of EVs. Thus, they are able to increase their range and work properly. The more electric cars are used, the more charging stations are needed. Thus, their availability and accessibility have become a vital issue. There are numerous kinds of charging stations, such as slow, fast, and ultra-fast chargers, each of which is distinguished by the speed at which they can charge an EV (Grimaccia et al., 2023). The strategic distribution of these stations, specifically in the cities, is the key to dealing with the range anxiety, which is a usual worry of EV users. Besides, the creation of a solid charging infrastructure can greatly diminish the environmental influence of transportation by promoting the use of clean energy vehicles. Hence, the proper placement of EV charging stations is a crucial aspect in the development of sustainable urban mobility and the decrease of greenhouse gas emissions (Niccolai et al., 2023).
The problem of navigating through vast search spaces to locate optimal solutions is a perpetual challenge in optimization, necessitating continual refinement and innovation (Nasser AlEisa et al., 2022). The quest to identify the best solutions without resorting to brute-force methods underscores the essence of optimization, where the deployment of exploration and exploitation strategies is pivotal (Alhussan et al., 2023a). By strategically balancing these tactics, optimization algorithms can efficiently converge toward the desired goal within a reasonable timeframe, yielding optimal solutions that meet predefined criteria. Metaheuristic and evolutionary optimization algorithms play a pivotal role in this pursuit, offering versatile frameworks capable of traversing complex solution spaces without succumbing to local optima (Abdel Samee et al., 2022). Their efficacy has been demonstrated across diverse domains, spanning engineering (Ahmadi et al., 2019) and economics (Lin, 2016), healthcare (Gwon et al., 2021), transportation (Wang et al., 2018), mechanics (Rao and Waghmare, 2017), and academia (Oppong, 2023), underscoring their versatility and applicability.
In recent years, the optimization landscape has witnessed a proliferation of metaheuristic and evolutionary algorithms, each tailored to address specific challenges and exploit unique optimization landscapes. Among these innovative methodologies, the Particle Swarm Optimization (PSO) algorithm (Kennedy and Eberhart, 1995) has emerged as a prominent contender, drawing inspiration from the collective behavior of birds and fish. Its decentralized approach facilitates efficient exploration and exploitation of solution spaces, making it particularly adept at tackling complex optimization problems. Similarly, the Whale Optimization Algorithm (WOA) (Khafaga et al., 2022a) has garnered attention for its ability to emulate the social behavior of whales, striking a balance between exploration and exploitation in optimization tasks. The Grey Wolf Optimization (GWO) algorithm (Mirjalili et al., 2014) leverages insights from the hierarchical structure of wolf packs, enabling effective solution refinement and adaptation to diverse problem types. Meanwhile, the Genetic Algorithm (GA) (Holland, 1992), a stalwart in the field of optimization, simulates natural selection processes to evolve potential solutions iteratively, demonstrating remarkable versatility and widespread applicability. The Gravitational Search Algorithm (GSA) (Rashedi et al., 2009) introduces a unique metaphor by modeling solutions as masses interacting through gravitational forces, enabling effective global exploration and local exploitation.
The Al-Biruni Earth Radius (BER) algorithm (El Sayed et al., 2023) and the Waterwheel Plant Algorithm (WWPA) (Abdelhamid et al., 2023a) represent novel additions to the optimization arsenal, drawing inspiration from distinct natural phenomena to address specific problem characteristics. In summary, the landscape of metaheuristic and evolutionary optimization algorithms has undergone significant expansion in recent years, with each algorithm offering a distinct set of advantages for tackling diverse problem types. The continual evolution of these methodologies underscores researchers’ commitment to exploring innovative approaches and pushing the boundaries of optimization capabilities. As these algorithms mature and diversify, their application across various domains is poised to catalyze breakthroughs and unlock new frontiers in optimization research.
The research presented herein follows a systematic methodology encompassing multiple phases. Initially, the data undergoes preprocessing, incorporating techniques such as data augmentation and feature extraction to enhance quality and accuracy. Subsequently, the proposed dynamic optimization algorithm, inspired by the collaborative behavior of geese in nature, is introduced (El-Kenawy et al., 2024). This algorithm, represented by the graylag goose optimization (GGO) algorithm, mirrors geese’s teamwork and navigation strategies, which are crucial for dynamically selecting optimal charging station parameters to enhance performance. Finally, the study focuses on predicting the optimal parameter set of LSTM models to improve charging station performance further, leveraging advanced machine learning classification models. The ongoing progress of this research is illustrated in a plot below, showcasing preliminary results from the parameter prediction phase. Furthermore, to elucidate factors contributing to dataset variability, an analysis of variance (ANOVA) is employed. Additionally, a Wilcoxon Signed Rank Test compares theoretical and actual median accuracy values for several methods, with results indicating significant improvements in accuracy for DGGO + LSTM, GGO + LSTM, Grey Wolf Optimization Algorithm (GWO)+LSTM, Particle Swarm Optimization (PSO)+LSTM, and Genetic Algorithm (GA)+LSTM. These techniques collectively contribute to a comprehensive exploration of optimization strategies in the context of electric vehicle charging station allocation.
To address the critical challenges to promoting EVs widespread adoption, different studies are carried out. These challenges include EVs’ high upfront costs compared to conventional vehicles, the lack of sufficient charging stations, limitations in battery technology and charging speeds, and concerns about the distance EVs can travel on a single charge. This research introduces innovations in metaheuristic optimization, named DGGO + LSTM, to enhance the efficiency of classifying electric vehicle stations as follows:
1. First, the widespread adoption of electric vehicles plays a pivotal role in mitigating greenhouse gas emissions and addressing climate change. By optimizing the charging infrastructure for electric vehicles, this research contributes to facilitating the transition towards a low-carbon transportation system, a crucial step in aligning with global climate objectives.
2. Furthermore, the optimization of charging infrastructure carries the potential to alleviate air pollution in urban areas. Electric vehicles, known for their reduced emissions of harmful pollutants like nitrogen oxides and particulate matter, can significantly enhance urban air quality and mitigate health risks. Simplifying access to charging stations through this research may encourage more individuals to embrace electric vehicles, thereby contributing to improved public health and air quality.
3. Additionally, the optimization of charging infrastructure can lead to reduced energy consumption and lowered electricity costs. Through strategic placement of charging stations and demand management utilizing metaheuristic optimization, this research aids in easing the strain on the electrical grid during peak hours, potentially resulting in decreased electricity prices for consumers. In summary, the optimization of electric vehicle charging infrastructure holds substantial potential for delivering significant social benefits, encompassing emissions reduction, enhanced air quality and public health, as well as decreased energy consumption and costs.
2 Materials and methods
2.1 Dataset
The Electric Vehicle Population Data, maintained by the Washington State Department of Licensing (DOL), presents a thorough overview of currently registered Battery Electric Vehicles (BEVs) and Plug-in Hybrid Electric Vehicles (PHEVs) in the state (Data.wa.gov, 2024). Figure 1 shows the distribution of BEVs and PHEVs in the state according to year and company in the tested dataset. This dataset, publicly accessible and regularly updated, serves as a valuable resource for scrutinizing the evolving landscape of electric vehicles. It encompasses detailed information about BEVs and PHEVs, empowering researchers and analysts to explore diverse facets of sustainable transportation. With its last update on 16 December 2023, this dataset, covering the period from its creation on 10 November 2020, provides a dynamic and evolving portrayal of the electric vehicle population in Washington. Hosted on data.wa.gov and managed by the Department of Licensing, it not only aids in evaluating the current growth and adoption of electric vehicles but also furnishes indispensable data for policymakers, urban planners, and industry stakeholders committed to advancing sustainable mobility initiatives in the region.
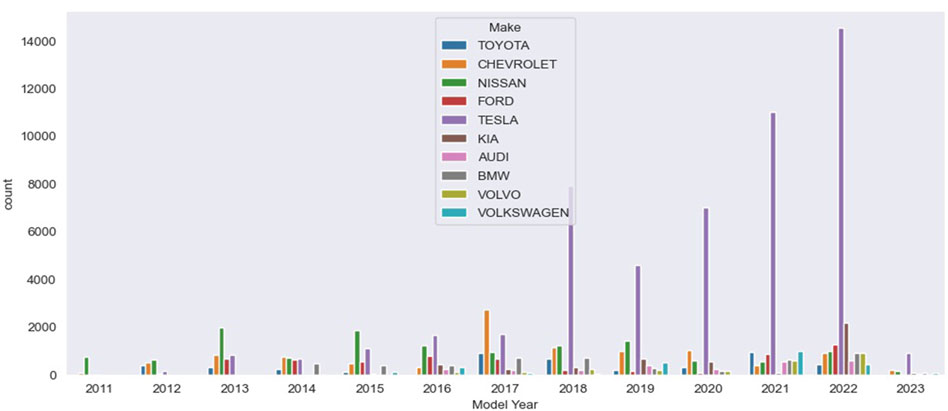
Figure 1. Distribution of Battery Electric Vehicles (BEVs) and Plug-in Hybrid Electric Vehicles (PHEVs) in the state according to year and company in the tested dataset.
Table 1 illustrates the distribution of BEVs and PHEVs across various counties. King County shows a significantly higher number of electric vehicles than other counties, with Snohomish, Pierce, and Clark counties following. The number of electric vehicles decreases progressively in the other countries, as shown. Table 2 presents the most common electric vehicles currently registered, grouped by model.
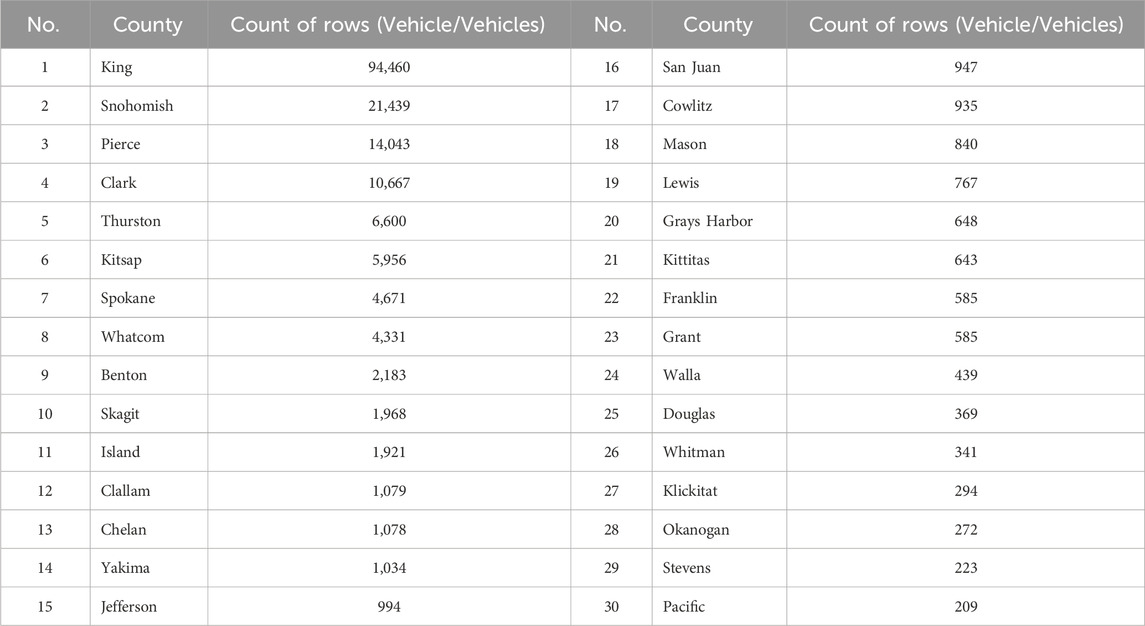
Table 1. Distribution of battery electric vehicles (BEVs) and plug-in hybrid electric vehicles (PHEVs) in cities with more than 200 vehicles.
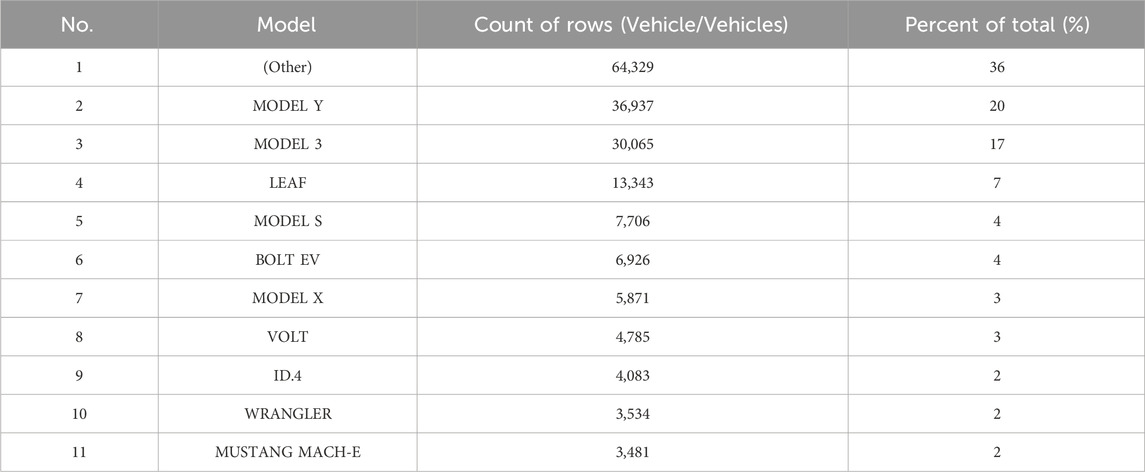
Table 2. Most common electric vehicles currently registered, grouped by model.
2.2 Machine learning basic models
Within the scope of this investigation, various machine learning classification techniques were utilized, and the following components represent those algorithms. Long-short-term memory, also known as LSTM, is a form of neural network that was developed primarily to overcome the difficulties associated with capturing long-term dependencies inside sequential data collections (Alhussan et al., 2023b). LSTMs are adept at preserving and utilizing knowledge over extended periods of time, which, in turn, makes them useful for predicting patterns in time-series data. LSTMs are widely used in tasks that include sequences, such as natural language processing and speech recognition. LSTM is a type of recurrent neural network (RNN) suitable for sequence-based tasks, effectively capturing long-term dependencies in data. Each of these methods has its strengths and weaknesses, making them suitable for specific machine learning applications.
Random Forest is a classification system that is well-known for its capacity to generate reliable predictions while simultaneously minimizing the danger of overfitting. It is composed of numerous decision trees, each of which is trained on a random sample of the data. Random Forest Classifier aggregates predictions from multiple decision trees, providing robust performance and reducing overfitting. This is one of the reasons why it is such a popular choice for classification and regression problems because it can utilize the collective intelligence of a wide variety of trees (Khafaga et al., 2022b). The basic machine learning methods encompass a diverse set of algorithms used in this study. The SGD Classifier, based on Stochastic Gradient Descent, is particularly useful for large-scale optimization problems, often employed in linear classification tasks (El-Kenawy et al., 2022a). Decision Tree Classifier constructs a tree structure to make decisions based on input features, suitable for both classification and regression problems (Hassan et al., 2022). K Neighbors Classifier, part of the k-Nearest Neighbors algorithm, makes predictions by considering the majority class of its nearest neighbors, making it effective for both simple and complex datasets (El-Kenawy et al., 2022b). SVC (Support Vector Classifier) is a powerful classification algorithm that aims to find the optimal hyperplane separating different classes (Khafaga et al., 2022c). NN Classifier typically refers to a neural network-based classifier, offering the flexibility to model complex relationships in data (Abdelhamid et al., 2023b).
3 Proposed Dynamic Greylag Goose Optimization (DGGO) algorithm
This study presents a groundbreaking algorithm, the Dynamic Greylag Goose Optimization (DGGO), which is a sequential process outlined in Algorithm 1. The DGGO operates with a gaggle of individuals and characters, Xi (i = 1,2,.,n), where n represents the number of individuals in the gaggle. Each individual in this population represents a potential solution to the problem at hand. The effectiveness of these solutions is evaluated using an objective function, Fn, applied to each individual in Xi. Following the evaluation of multiple sets of solutions, the DGGO algorithm identifies the best solution, denoted as p, as the leader guiding the optimization process. What distinguishes the proposed DGGO from the original graylag goose optimization (GGO) algorithm, presented in (El-Kenawy et al., 2024), is its dynamic grouping behavior, where all individuals are categorized into two distinct groups: the research and development (exploration) group and the industrialization and commercialization (exploitation) group. Initially, these groups are evenly divided, providing equal numbers of individuals for exploration and exploitation purposes.
Nonetheless, in the later stages of optimization, these groups’ makeup is gradually changing. Homogeneous behavior can be seen in the number of agents in the exploration group (n1), which decreases, but the number of agents in the exploitation group (n2) increases. Smart search space is exploited through the combination of thinking globally and acting locally, thus ensuring optimal and more intensified exploitation around the converging regions. If the value of an objective function of the agent that has the best solution is unchangeable for the last three iterations, then to increase the number of agents in the exploration group (n1) dynamically, the DGGO algorithm is used. This strategic tactic is considered to discover other potential global optimal solutions and may work toward jumping over some local optima, thus rectifying the convergence property of the algorithm. The DGGO algorithm mainly focuses on a dynamic group formation strategy, which gives it a chance to achieve a delicate balance between exploration and exploitation without fail. This, in turn, facilitates better solution optimization in complex problem domains.
Algorithm 1.Proposed Dynamic GGO Algorithm.
1: Initialize DGGO population Xi (i = 1,2,n), size n, iterations tmax, objective function Fn.
2: Initialize DGGO parameters
3: Calculate objective function Fn for each agents Xi
4: Set P = best agent position
5: Update Solutions in exploration group (n1) and exploitation group (n2)
6: while t ≤ tmax do
7: if (Best Fn is same as previous two iterations) then
8: Increase solutions of exploration group (n1)
9: Decrease solutions of exploitation group (n2)
10: end if
11: for (i = 1: i < n1 + 1) do
12: if (t%2 = = 0) then
13: if (r3 < 0.5) then
14: if (|A| < 1) then
15: Update position of current search agent as X (t + 1) = X∗(t)− A.|C.X∗(t) − X(t)|
16: else
17: Select three random search agents XPaddle1, XPaddle2, and XPaddle3
18: Update (z) by the exponential form of
19: Update position of current search agent as X (t + 1) = w1 ∗XPaddle1 +z∗w2 ∗(XPaddle2 −XPaddle3)+(1− z) ∗ w3 ∗ (X − XPaddle1)
20: end if
21: else
22: Update position of current search agent as X (t+1) = w4 ∗|X∗(t)−X(t)|.ebl.cos (2πl)+[2w1 (r4 +r5)]∗X∗(t)
23: end if
24: else
25: Update individual positions as X (t + 1) = X(t) + D (1 + z) ∗ w ∗ (X − XFlock1)
26: end if
27: end for
28: for (i = 1: i < n2 + 1) do
29: if (t%2 = = 0) then
30: Calculate X1 = XSentry1−A1.|C1. XSentry1−X|, X2 = XSentry2− A2.|C2. XSentry2 − X|, X3 = XSentry3 − A3.|C3. XSentry3 − X|
31: Update individual positions as
32: else
33: Update position of current search agent as X (t + 1) = X(t) + D (1 + z) ∗ w ∗ (X − XFlock1)
34: end if
35: end for
36: Calculate Fn for each agents
37: Update parameters
38: end while
39: Return best agent P
4 Experimental results
In this study, we optimized the LSTM classifier hyperparameters using the DGGO algorithm. The performance metrics, such as accuracy, pertain to the classification model’s performance. While the primary contribution focuses on optimization, the results presented in this section are for the model’s classification accuracy after hyperparameter optimization. The hyperparameter settings of the LSTM classifier, which are crucial for the model’s performance, are shown in Table 3. Using 3 layers provides enough depth for the LSTM network t`o capture complex patterns in the data. It balances the model’s capacity to learn intricate temporal relationships without being overly complex. Each layer has 100 units (neurons), which allows the network to learn enough features from the input data. This value helps in capturing detailed patterns while maintaining computational efficiency. A dropout rate of 0.3 means that 30% of the neurons will be randomly set to zero during each training step. This helps prevent overfitting by ensuring that the model does not rely too heavily on any particular set of neurons, promoting generalization.
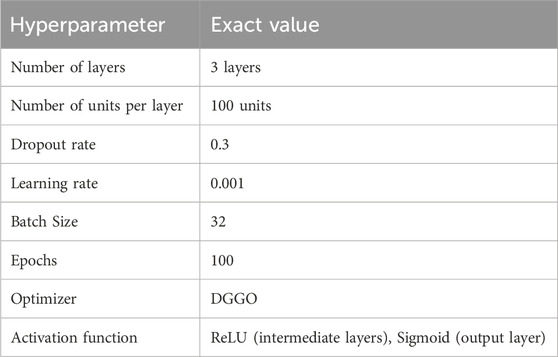
Table 3. LSTM model hyperparameter settings.
A learning rate of 0.001 is a common choice for LSTM networks as it provides a good balance between convergence speed and the stability of the training process. It allows the optimizer to make minor, precise updates to the model parameters. Using a batch size of 32 means that the model will process 32 samples at a time before updating the model parameters. This size is small enough to provide a smooth gradient descent process, helping in stable and efficient training. Training the model for 100 epochs allows it to make multiple passes over the entire training dataset. This ensures that the model has sufficient opportunity to learn the underlying patterns in the data. Early stopping can halt training if the validation performance stops improving. The DGGO optimizer is a novel optimization algorithm inspired by the collaborative behavior of greylag geese. It balances exploration and exploitation dynamically, making it well-suited for complex optimization problems like training an LSTM model. It has shown promising results in finding optimal solutions efficiently. ReLU (Rectified Linear Unit) is used in the intermediate layers because it can mitigate the vanishing gradient problem and accelerate the training process. Sigmoid activation is used in the output layer for binary classification tasks, providing output probabilities between 0 and 1.
The electric vehicle population data that presents the currently registered BEVs and PHEVs in the state is divided randomly into 80% for training the classifier and 20% for testing. After the training stage, the accuracy and other performance metrics are evaluated based on the correct selection from the 20% testing samples. This evaluation, which is a crucial step in assessing the quality of the LSTM classifier, reflects the impact of the optimization based on the proposed DGGO algorithm. It provides a clear picture of how the model performs in real-world scenarios.
4.1 Performance metrics
The accuracy, sensitivity, and specificity of the classification module are metrics used to evaluate its performance. Additional performance metrics consist of Precision (PPV), F-score, and Negative Predictive Value (NPV). The respective abbreviations for the true-positive (TP), true-negative (TN), false-negative (FN), and false-positive (FP) values are provided here. The value of TP signifies a successful prediction that an instance is a member of the positive class; FP signifies a false prediction that the predicted instance is in the positive class; and TN signifies a correct prediction that the instance is a member of the negative class. These measurements delineate the characteristics of each indicator.
• Accuracy: the model’s ability to recognize full cases, regardless of positive or negative cases and is formed as shown in Equation 1
• Sensitivity: referred to as the true positive rate (TPR), represents the capability of positive cases and is computed as shown in Equation 2
• Specificity: referred to the negative rate and gain the capacity to locate cases in which there is no match. It can be formed as shown in Equation 3
• Precision (PPV): controls the proportion of positives relative to the total positive results. It can be formed as shown in Equation 4
• NPV: controls the proportion of negatives relative to other negative values as shown in Equation 5.
• F-score: calculates the harmonic value of the precision and sensitivity as shown in Equation 6.
The results presented in Table 4 showcase the performance metrics of various classification models across different evaluation criteria. The SGD Classifier demonstrates a commendable overall accuracy of 79.53%, with a high True Positive Rate (TRP) of 90.09% but a relatively low True Negative Rate (TNP) of 6.25%. The decision tree classifier exhibits an improved accuracy of 82.89%, with a higher TRP and TNP than the SGD classifier, resulting in a superior F1 Score of 90.58%. K-Neighbors Classifier further enhances the accuracy to 84.97%, with notable increases in TRP and TNP, contributing to an enhanced F1 Score of 91.77%. The Support Vector Classifier (SVC) exhibits a higher accuracy of 86.21%, with substantial improvements in TRP and TNP, leading to an elevated F1 Score of 92.02%. The NN Classifier demonstrates increased accuracy at 87.68%, with significant improvements in TRP and Positive Predictive Value (PPV), resulting in an F1 Score consistent with the SVC. The random forest classification achieves a noteworthy accuracy of 90.70%, with a high TRP and TNP, contributing to an impressive F1 score of 93.75%. The LSTM model surpasses all others with an accuracy of 92.86%, showcasing the highest TRP, TNP, and F1 Score among the presented models. These results provide a comprehensive evaluation of the models’ classification performance, highlighting strengths and weaknesses across various metrics. Figure 2 shows visualization of the basic classification models’ results applied to the tested dataset.
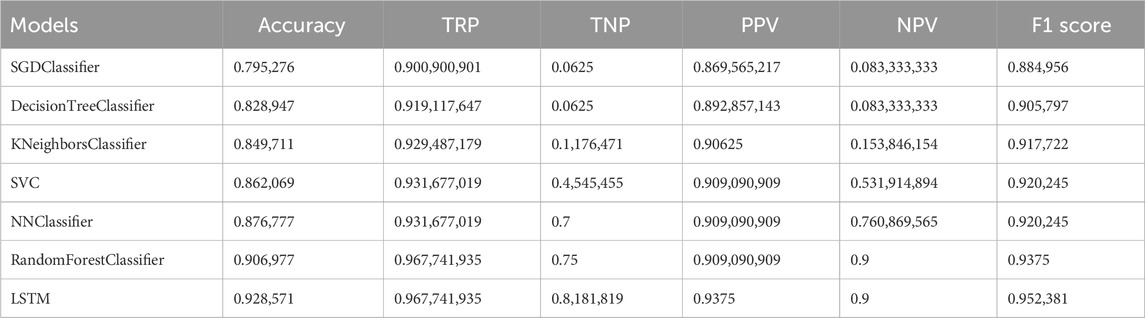
Table 4. Results from the basic classification models applied to the tested dataset.
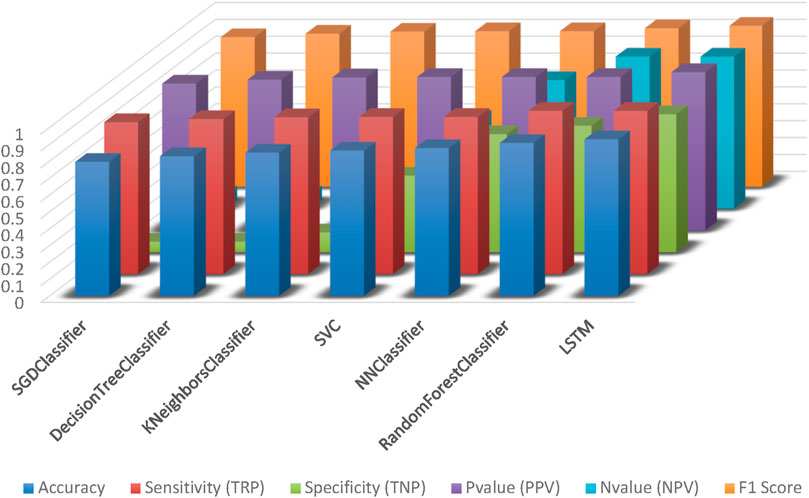
Figure 2. The basic classification models’ results applied to the tested dataset.
The presented results in Table 5 offer a detailed evaluation of various hybrid models combining optimization algorithms with Long Short-Term Memory (LSTM) networks, focusing on their performance across multiple metrics. The DGGO + LSTM model stands out with an exceptionally high accuracy of 98.88%. This model exhibits a remarkable True Positive Rate (TRP) of 98.36% and an impressive True Negative Rate (TNP) of 99.38%, resulting in a robust Precision (PPV) of 99.34% and a high Negative Predictive Value (NPV) of 98.46%. The F1 Score of 98.85% further underscores the overall excellence of DGGO + LSTM in classification tasks. The GGO + LSTM model also demonstrates strong performance, achieving an accuracy of 96.66%. It maintains a balanced True Positive Rate (TRP) of 97.40% and a high True Negative Rate (TNP) of 95.79%, contributing to a solid Precision (PPV) of 96.46% and an F1 Score of 96.93%.
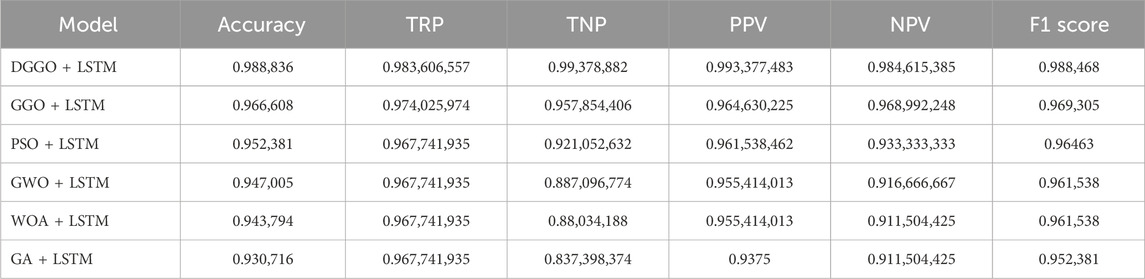
Table 5. Assessment of the effectiveness of proposed and compared models to the tested dataset.
The PSO + LSTM, GWO + LSTM, WOA + LSTM, and GA + LSTM models exhibit slightly lower but still commendable accuracies ranging from 95.24% to 93.07%. These models show variations in their True Positive Rates, True Negative Rates, and other metrics, reflecting nuanced differences in their abilities to correctly classify positive and negative instances. These results demonstrate the efficacy of the DGGO + LSTM model, surpassing others in terms of accuracy and overall classification performance. The GGO + LSTM model also performs well, and the other hybrid models, while achieving slightly lower accuracies, still showcase respectable performance across various evaluation metrics. These findings suggest the potential of combining optimization algorithms with LSTM networks to enhance the predictive capabilities of classification models, with DGGO + LSTM leading the pack in this set of experiments. Figure 3 shows the effectiveness of proposed (DGGO + LSTM) and compared optimization models to the tested dataset.

Figure 3. The effectiveness of proposed (DGGO + LSTM) and compared optimization models to the tested dataset.
The presented statistics in Table 6 provide a comprehensive overview of the performance measures for six different models, each combining DGGO, GGO, PSO, GWO, WOA, or GA with LSTM. The models are assessed based on various statistical measures, including minimum and maximum values, percentiles, confidence intervals, mean, standard deviation, coefficient of variation, and measures of central tendency. The range of accuracy across the models is relatively narrow, with coefficients of variation ranging from 0.2827% to 0.7615%. DGGO + LSTM consistently exhibits the highest accuracy, with the narrowest range and standard deviation, while GWO + LSTM shows a slightly wider range and standard deviation. The confidence intervals at different percentiles provide insights into the precision of the estimated means, with DGGO + LSTM showing consistently narrow intervals. The skewness values indicate the asymmetry of the data distribution, and all models exhibit varying degrees of skewness. The kurtosis values suggest the tail heaviness of the distributions, with DGGO + LSTM and GA + LSTM showing higher kurtosis values. In terms of the geometric mean, harmonic mean, and quadratic mean, all models demonstrate similar patterns, reinforcing the stability and consistency of the results. The sum of the values across all models remains close to 10, indicating a relatively consistent overall performance. The statistical analysis provides a detailed characterization of the performance distribution for each model, offering valuable insights into the reliability and variability of their accuracy measures. DGGO + LSTM consistently emerges as a high-performing model with narrow confidence intervals and stable statistical properties. These results facilitate a nuanced understanding of the models’ performance and aid in making informed comparisons between the different optimization algorithm-LSTM combinations
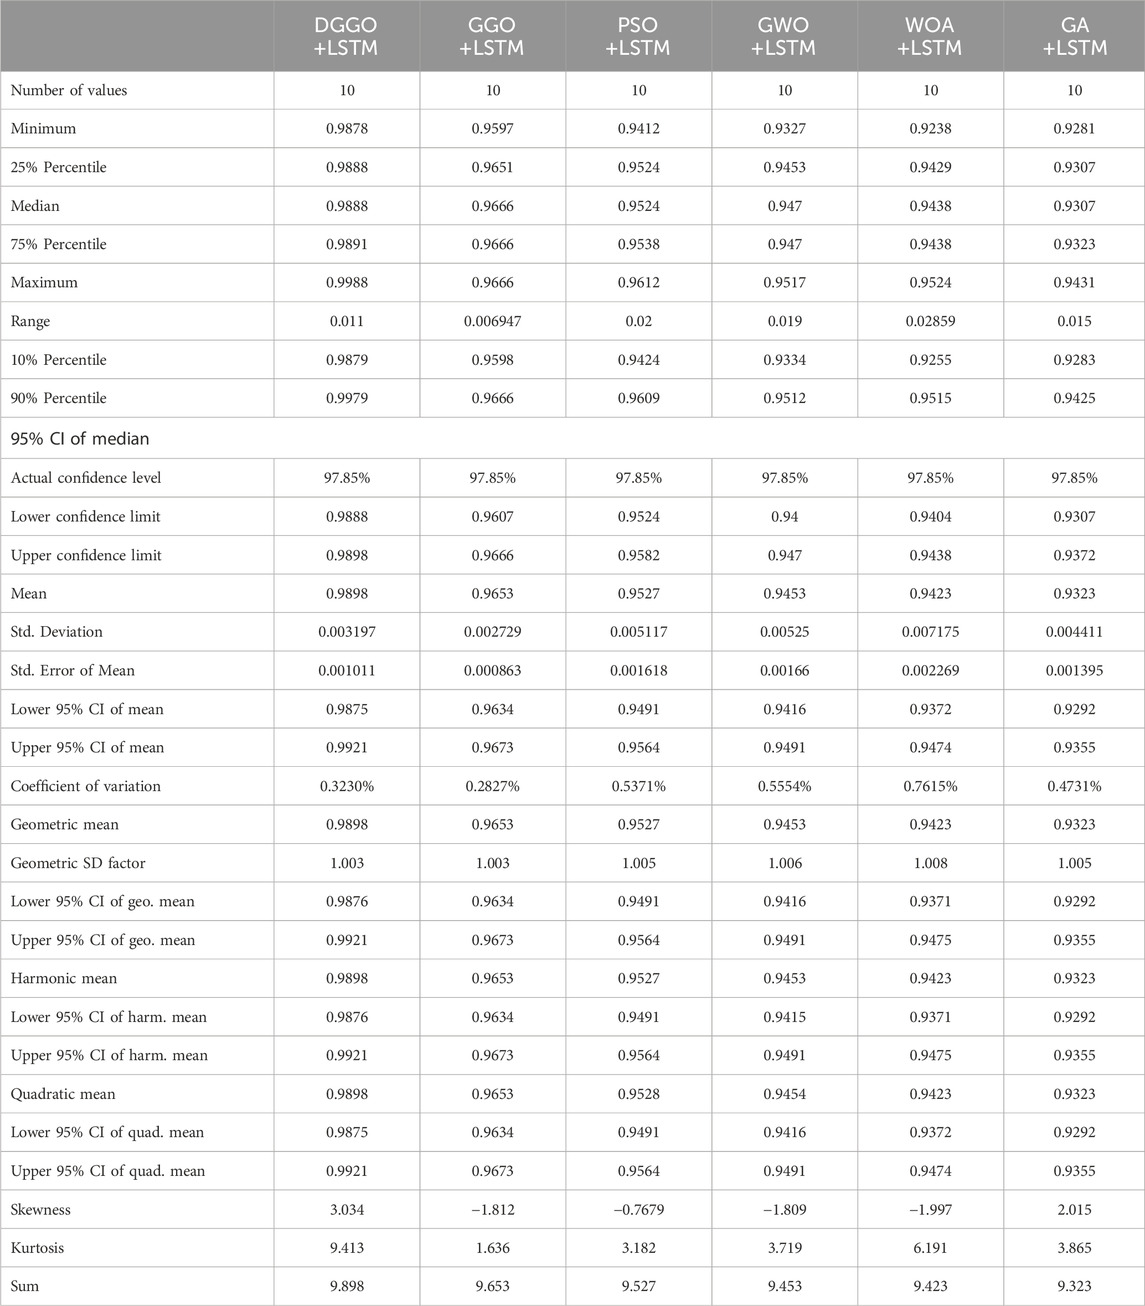
Table 6. Thorough examination of the performance metrics for DGGO + LSTM, GGO + LSTM, PSO + LSTM, GWO + LSTM, WOA + LSTM, and GA + LSTM models.
Following the previous experiment, several different classifiers, including DGGO + LSTM, GGO + LSTM, PSO + LSTM, GWO + LSTM, and GA + LSTM, were examined by applying them to the dataset that had been specifically described earlier. The primary purpose was to evaluate and contrast the degree of accuracy exhibited by each solution. Figure 4 illustrates that the findings indicate that the DGGO + LSTM algorithm beats other solutions, demonstrating a much greater accuracy rate than the other alternatives.
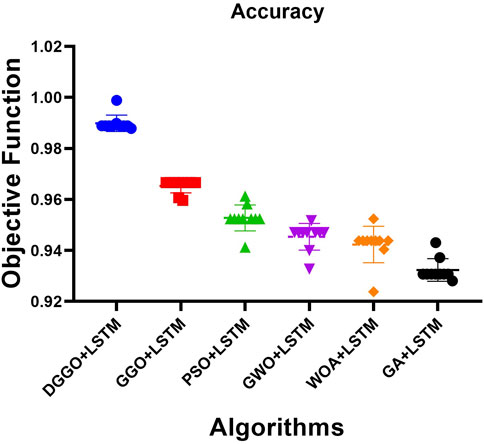
Figure 4. Assessment of the accuracy of proposed and compared models.
In the following experiment, we will investigate how hybrid algorithms exhibit varying degrees of accuracy. Repeating the experiment ten times and displaying the results of each iteration in the form of a histogram is the method that is utilized to arrive at an average. The numbers that were collected from each iteration of the experiment are depicted in Figure 5, which provides a visual depiction of the accuracy distribution over several repetitions.
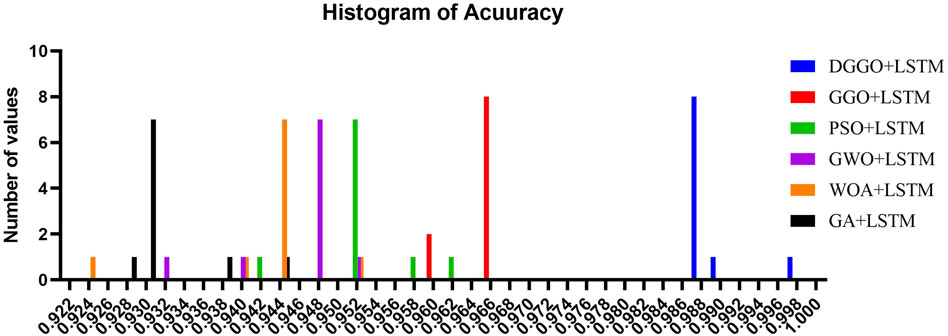
Figure 5. Exploration of the histogram of accuracy for different classifiers.
The computation of residual values and heat is included in the experiments, and the results are visually shown through a variety of charts and comparisons. During the first computation, the residual values are graphically displayed on a dispersed y-axis that is grouped within columns. A representation of the distribution of these residual values may be found in Figure 6. To determine the degree of similarity between the anticipated and actual residual values, a QQ plot is utilized. This plot illustrates that the two sets of values are in tight alignment with one another. To compare the variances of the various groups, the homoscedasticity plot shown in Figure 6 is utilized. This reveals the consistent variances that exist between the groups. In addition, the heatmap shown in Figure 6 is utilized to accurately assess the magnitude of the individual values contained within the dataset. These studies, when taken as a whole, provide a thorough insight into the characteristics of residual values, their distribution, and the variance among groups, which ultimately helps to improve the interpretation of the results of the experiment. The ROC curve of the proposed DGGO + LSTM versus the original GGO + LSTM is shown in Figure 7.
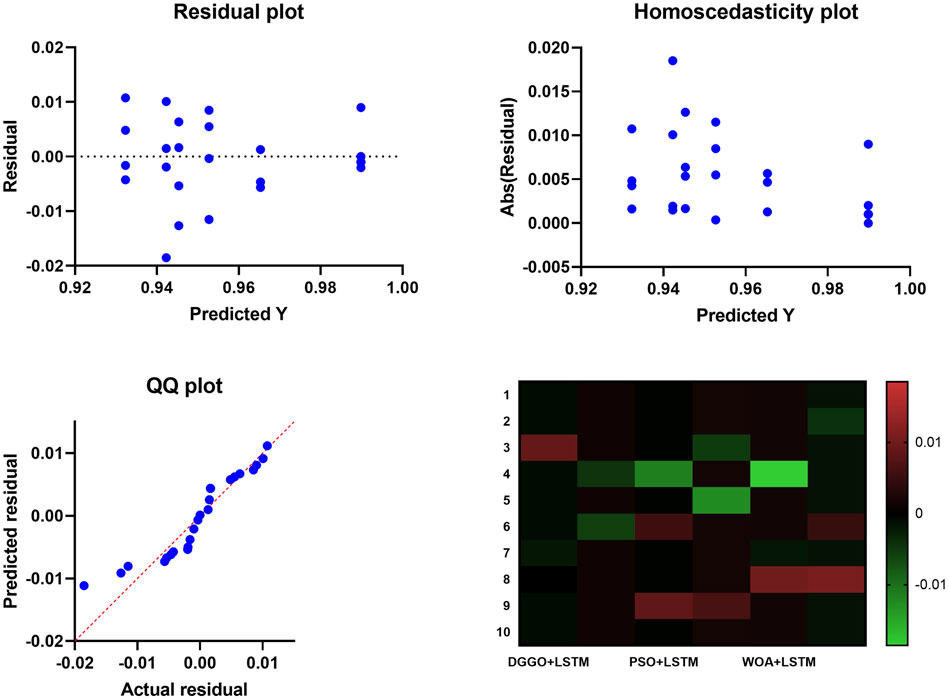
Figure 6. Residual values and heatmap analysis for DGGO + LSTM and compared models.
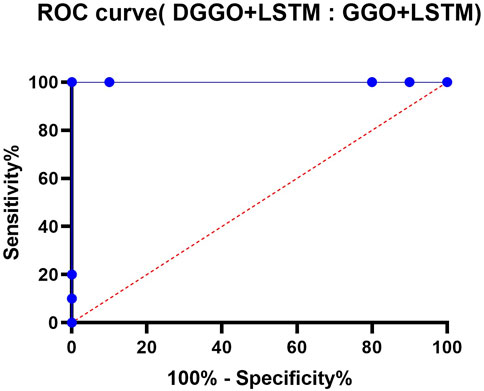
Figure 7. The ROC curve of the proposed DGGO + LSTM versus the original GGO + LSTM.
As shown in Table 7, the results of the Analysis of Variance (ANOVA) prove markedly distinguishable that there are notable disparities among treatment groups within the datasets. Through the application of the above-described statistical technique, different patterns have been identified that reveal the effectiveness of the applied treatments that lead to the variations. More specifically, the sum of squares distributed along the lines of treatment groups turns out to be 0.02092, which is in conjunction with 5 degrees of freedom linked to treatment variables. Moreover, the SS residuals are obtained, meaning the variability within each treatment group is 0.001281 degrees of freedom assigned to residuals. In order to compare within and between group variances, this analysis uses an F-statistic, presumed with 5 and 54 degrees of freedom, equal to the F-ratio of 176.4. The result of this test is a very small p-value (p < 0.0001), which is high enough to reject the null equal-means hypothesis across groups managed by different treatments being used. Those results are the robust ground of statistically correlated data, which showed that regarding the applied treatment, a clear forerunner/champion between groups is observed. The ANOVA results reveal the main influence of treatments used in creating the dataset, which implies the superiority of intentionally applied experimental interventions in setting a quite significant ground for variation of the different treatment groups.
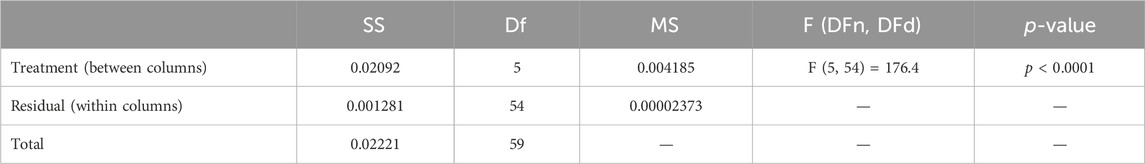
Table 7. ANOVA findings for DGGO + LSTM and comparing algorithms.
A modified Wilcoxon Signed Rank Test was used on six models combining optimization algorithms with the LSTM network that were formulated to examine the ability of each to outperform the theoretical mid-point of 0, as given in Table 8. Based on actual media results, they differ from theoretical ones, revealing their respective efficiencies. The medians for DGGO + LSTM, GGO + LSTM(eps), PSO + LSTM, GWO + LSTM, WOA + LSTM, and GA + LSTM were obtained as 0.9888, 0.9666, 0.9524, 0.947, 0.9438, and 0.9. Strikingly, all the models provided similar results regarding the population of the signed-rank S = 55 and no negative ranks, while positive ones were solely present. Here, the uniformity, which serves as the cornerstone and the rock of the work, makes the whole literature review series trustworthy and further helps to secure the credibility of the coming conclusions. Secondly, these two-way p-values of 0.002 each, which noticeably deviate from the theoretical mean, clearly demonstrate the statistically significant divergence from the calculated mean. Indeed, the smoking gun effect of the null hypothesis shows this, as well as the actual medians, in comparison to the theoretical probability. These simulations show that they do inherit the idea of medians from the software, and their improvement over the baseline median is partly due to that characteristic. This outstanding improvement clearly reveals the capability of the mentioned techniques when it comes to analytical models and data prescriptive tasks. Specifically, LSTM, together with optimization approaches, proved to be useful.
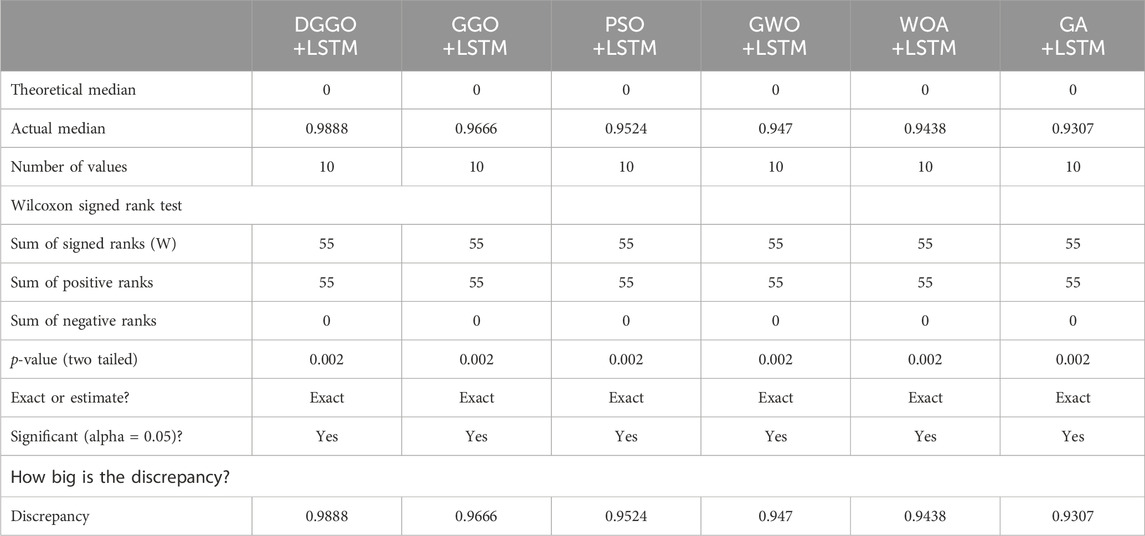
Table 8. DGGO + LSTM and other algorithms’ wilcoxon signed rank test statistics.
5 Conclusion and future directions
In conclusion, this study addresses critical challenges in promoting the widespread adoption of electric vehicles (EVs) by focusing on the establishment of efficient urban charging infrastructure. The challenges include EVs’ high upfront costs compared to conventional vehicles, the lack of sufficient charging stations, limitations in battery technology and charging speeds, and concerns about the distance EVs can travel on a single charge. Recognizing the potential hindrances posed by limited range and prolonged recharging times, the research emphasizes the importance of strategically locating fast and ultra-fast charging terminals. However, the energy requirements of these terminals present a formidable challenge that could affect service quality. The research employs a dynamic greylag goose optimization (DGGO) algorithm and a Long Short-Term Memory (LSTM) model as decision-making tools for the optimal classification of electric vehicle stations.
Future directions for this research include expanding the scope of analysis to incorporate geographic traffic patterns derived from detailed analyses of road networks, route specifics, junction density, and economic zones. Leveraging OpenStreetMap for road network topology analysis will enhance the precision of these evaluations. Additionally, integrating emerging technologies and renewable energy sources, such as solar and wind energy, could significantly reduce the carbon footprint of EVs. Further research could explore the potential of wireless charging technologies to enhance convenience and reduce the need for physical charging stations. Another promising direction is the development of real-time adaptive systems that dynamically adjust charging station locations based on real-time traffic and usage data. This would ensure that the infrastructure remains responsive to changing conditions and continues to meet the needs of EV users. Collaboration with urban planners, energy providers, and policymakers will be crucial in implementing these innovations and achieving a sustainable and efficient EV charging network.
Data availability statement
The original contributions presented in the study are included in the article/supplementary material, further inquiries can be directed to the corresponding author.
Author contributions
AA: Writing–original draft. DK: Writing–original draft. E-SE-K: Writing–original draft, Writing–review and editing. ME: Writing–original draft, Writing–review and editing. AI: Writing–original draft, Writing–review and editing.
Funding
The author(s) declare financial support was received for the research, authorship, and/or publication of this article. This research project was funded by the Deanship of Scientific Research, Princess Nourah bint Abdulrahman University, through the Program of Research Project Funding After Publication, grant No (44- PRFA-P- 48).
Conflict of interest
The authors declare that the research was conducted in the absence of any commercial or financial relationships that could be construed as a potential conflict of interest.
Publisher’s note
All claims expressed in this article are solely those of the authors and do not necessarily represent those of their affiliated organizations, or those of the publisher, the editors and the reviewers. Any product that may be evaluated in this article, or claim that may be made by its manufacturer, is not guaranteed or endorsed by the publisher.
References
Abdelhamid, A., Towfek, S., Khodadadi, N., Alhussan, A., Khafaga, D., Eid, M. M., et al. (2023a). Waterwheel plant algorithm: a novel metaheuristic optimization method. Processes 11 (5), 1502. doi:10.3390/pr11051502
Abdelhamid, A. A., Eid, M. M., Abotaleb, M., and Towfek, S. K. (2023b). Identification of cardiovascular disease risk factors among diabetes patients using ontological data mining techniques. J. Artif. Intell. Metaheuristics 4 (2), 45–53. doi:10.54216/JAIM.040205
Abdel Samee, N., El-Kenawy, E.-S. M., Atteia, G., Jamjoom, M., Ibrahim, A., et al. (2022). Metaheuristic optimization through deep learning classification of COVID-19 in chest X-ray images. Comput. Mater. and Continua 73 (2), 4193–4210. doi:10.32604/cmc.2022.031147
Ahmadi, M., Kazemi, K., Aarabi, A., Niknam, T., and Helfroush, M. S. (2019). Image segmentation using multilevel thresholding based on modified bird mating optimization. Multimed. Tools Appl. 78 (1), 23003–23027. doi:10.1007/s11042-019-7515-6
Alhussan, A., Abdelhamid, A., Towfek, S., Ibrahim, A., Marwa, H., Khafaga, D. S., et al. (2023a). Classification of diabetes using feature selection and hybrid Al-Biruni earth radius and dipper throated optimization. Diagnostics 13 (12), 2038. doi:10.3390/diagnostics13122038
Alhussan, A., El-Kenawy, E.-S. M., Abdelhamid, A., Ibrahim, A., Eid, M., and Khafaga, D. S. (2023b). Wind speed forecasting using optimized bidirectional LSTM based on dipper throated and genetic optimization algorithms. Front. Energy Res. 11 (1), 1–25. doi:10.3389/fenrg.2023.1172176
Data.wa.gov (2024). Department of licensing, electric vehicle population data. Available at: https://catalog.data.gov/dataset/electric-vehicle-population-data (accessed January 24, 2024).
El-Kenawy, E.-S. M., Khodadadi, N., Mirjalili, S., Abdelhamid, A. A., Eid, M. M., and Ibrahim, A. (2024). Greylag goose optimization: nature-inspired optimization algorithm. Expert Syst. Appl. 238 (Part E), 122147. doi:10.1016/j.eswa.2023.122147
El-Kenawy, E. S. M., Mirjalili, S., Alassery, F., Zhang, Y. D., Eid, M. M., El-Mashad, S. Y., et al. (2022b). Novel meta-heuristic algorithm for feature selection, unconstrained functions and engineering problems. IEEE Access 10, 40536–40555. doi:10.1109/ACCESS.2022.3166901
El-Kenawy, E. S. M., Zerouali, B., Bailek, N., Bouchouich, K., Hassan, M. A., Almorox, J., et al. (2022a). Improved weighted ensemble learning for predicting the daily reference evapotranspiration under the semi-arid climate conditions. Environ. Sci. Pollut. Res. 29 (54), 81279–81299. doi:10.1007/s11356-022-21410-8
El Sayed, M., Abdelhamid, A. A., Ibrahim, A., Mirjalili, S., Khodadad, N., Alhussan, A. A., et al. (2023). Al-biruni earth radius (BER) metaheuristic search optimization algorithm. Comput. Syst. Sci. Eng. 45 (2), 1917–1934. doi:10.32604/csse.2023.032497
Grimaccia, F., Leva, S., Niccolai, A., Ranjgar, B., and Trimarchi, S. (2023). “Social network optimization for electric vehicles charging stations deployment,” in 2023 IEEE International Conference on Artificial Intelligence and Green Energy (ICAIGE), USA, 12-14 Oct. 2023, 1–6. doi:10.1109/ICAIGE58321.2023.10346450
Gwon, H., Ahn, I., Kim, Y., Kang, H. J., Seo, H., Cho, H. N., et al. (2021). Self–TrainingWith quantile errors for multivariate missing data imputation for regression problems in electronic medical records: algorithm development study. JMIR Public Health Surveill. 7, e30824. doi:10.2196/30824
Hassan, M. A., Bailek, N., Bouchouicha, K., Ibrahim, A., Jamil, B., Kuriqi, A., et al. (2022). Evaluation of energy extraction of PV systems affected by environmental factors under real outdoor conditions. Theor. Appl. Climatol. 150 (1-2), 715–729. doi:10.1007/s00704-022-04166-6
Holland, H. (1992). Genetic algorithms. Sci. Am. 267 (1), 66–72. doi:10.1038/scientificamerican0792-66
Kennedy, J., and Eberhart, R. (1995). Particle swarm optimization. Proc. Int. Conf. Neural Netw. 4 (6), 1942–1948. doi:10.1109/ICNN.1995.488968
Khafaga, D. S., Alhussan, A. A., El-kenawy, E. M., Ibrahim, A., Abd Elkhalik, S. H., Y. El-Mashad, S., et al. (2022a). Improved prediction of metamaterial antenna bandwidth using adaptive optimization of LSTM. Comput. Mater. and Continua 73 (1), 865–881. doi:10.32604/cmc.2022.028550
Khafaga, D. S., Alhussan, A. A., El-Kenawy, E. S. M., Ibrahim, A., Eid, M. M., and Abdelhamid, A. A. (2022c). Solving optimization problems of metamaterial and double T-shape antennas using advanced meta-heuristics algorithms. IEEE Access 10, 74449–74471. doi:10.1109/ACCESS.2022.3190508
Khafaga, D. S., El-kenawy, E. M., Karim, F. K., Alshetewi, S., Ibrahim, A., and A. Abdelhamid, A. (2022b). Optimized weighted ensemble using dipper throated optimization algorithm in metamaterial antenna. Comput. Mater. and Continua 73 (3), 5771–5788. doi:10.32604/cmc.2022.032229
Lin, W.-Y. (2016). A novel 3D fruit fly optimization algorithm and its applications in economics. Neural Comput. Appl. 27 (5), 1391–1413. doi:10.1007/s00521-015-1942-8
Mirjalili, S., Mirjalili, S. M., and Lewis, A. (2014). Grey wolf optimizer. Adv. Eng. Softw. 69 (1), 46–61. doi:10.1016/j.advengsoft.2013.12.007
Nasser AlEisa, H., El-kenawy, E. M., Alhussan, A. A., Saber, M., Abdelhamid, A. A., et al. (2022). Transfer learning for chest x-rays diagnosis using dipper throated algorithm. Comput. Mater. and Continua 73 (2), 2371–2387. doi:10.32604/cmc.2022.030447
Niccolai, A., Ranjgar, B., and Trimarchi, S. (2023). “A GIS-based approach for optimal electric vehicles charging stations deployment,” in 2023 IEEE International Conference on Environment and Electrical Engineering and 2023 IEEE Industrial and Commercial Power Systems Europe (EEEIC/I&CPS Europe), China, 6-9 June 2023, 1–5. doi:10.1109/ICAIGE58321.2023.10346450
Oppong, S. O. (2023). Predicting students’ performance using machine learning algorithms: a review. Asian J. Res. Comput. Sci. 16 (3), 128–148. doi:10.9734/ajrcos/2023/v16i3351
Rao, R. V., and Waghmare, G. G. (2017). A new optimization algorithm for solving complex constrained design optimization problems. Eng. Optim. 49 (1), 60–83. doi:10.1080/0305215X.2016.1164855
Rashedi, E., Pour, H. N., and Saryazdi, S. (2009). GSA: a gravitational search algorithm. Inf. Sci. 179 (13), 2232–2248. doi:10.1016/j.ins.2009.03.004
Keywords: electric vehicle, graylag goose optimization, metaheuristics, optimization, machine learning
Citation: Alhussan AA, Khafaga DS, El-kenawy E-SM, Eid MM and Ibrahim A (2024) Optimization of classification model for electric vehicle charging station placement using dynamic graylag goose algorithm. Front. Energy Res. 12:1391085. doi: 10.3389/fenrg.2024.1391085
Received: 24 February 2024; Accepted: 21 August 2024;
Published: 19 September 2024.
Edited by:
Alessandro Niccolai, Polytechnic University of Milan, ItalyReviewed by:
Nizar M. Soufian, Palestine Polytechnic University, PalestineRiccardo Enrico Zich, Polytechnic University of Milan, Italy
Silvia Tirimarchi, Polytechnic University of Milan, Milan, Italy in collaboration with reviewer REZ
Copyright © 2024 Alhussan, Khafaga, El-kenawy, Eid and Ibrahim. This is an open-access article distributed under the terms of the Creative Commons Attribution License (CC BY). The use, distribution or reproduction in other forums is permitted, provided the original author(s) and the copyright owner(s) are credited and that the original publication in this journal is cited, in accordance with accepted academic practice. No use, distribution or reproduction is permitted which does not comply with these terms.
*Correspondence: Amel Ali Alhussan, YWFhbGh1c3NhbkBwbnUuZWR1LnNh; Marwa M. Eid, bW1tQGllZWUub3Jn