- 1Department of Electrical Engineering, Mizoram University, Aizawl, Mizoram, India
- 2Department of Electric Energy, Norwegian University of Science and Technology, Trondheim, Norway
- 3School of Physics, Engineering an Technology, University of York, York, United Kingdom
- 4Fukushima Renewable Energy Institute, AIST (FREA), Koriyama, Japan
Currently, electric vehicles (EVs) are the most liked mode for green transportation. However, the vehicle-to-grid (V2G) technology can reduce the peak demand on the power grid, which is an efficient way to encourage the integration of EVs. This paper proposes a multi-objective-based economic dispatch management including EVs to minimize the generator cost and active power loss. The entire system is retained for keeping in mind the economic operation of the whole system. Then, EVs are introduced to the system, taking into account vehicle requirements and load demands and considering EV constraints. The target of the proposed work is to demonstrate how effectively large-scale EVs can participate in valley filling and peak load shaving along with multi-objective-based cost and loss reduction. The proposed optimization problem is employed in an IEEE 30-bus system. The multi-objective grasshopper optimization algorithm and the ant-lion optimization are compared to observe the minimum cost and total loss of the system. The results show that the total generation cost and power loss of the system decrease due to the V2G mode of operation. In addition, EVs provide an alternative method for dealing with peak load, while filling the off-peak hours effectively. The total generation cost and power loss for 24 h using MOGOA without implementation of EVs are 8,757.128 $/hr and 65.28509 MW, respectively, and with EVs, the total generation cost and power loss for 24 h are 8,617.077 $/hr and 55.65349 MW, respectively. Thus, with the implementation of EVs, the total generation cost reduced by 1.59% and the total power loss reduced by 14.75%, and with MOALO, the total generation cost and power loss for 24 h without EVs are 8,977.077 $/hr and 44.20877 MW, respectively, and with EVs, the total generation cost and power loss for 24 h are 8,923.529 $/hr and 41.69524 MW, respectively. Thus, with the implementation of EVs, the total generation cost reduced by 0.59% and the total power loss reduced by 5.68%. The analysis of the results demonstrates how effectively EVs in the V2G mode can reduce the dependency over the grid power during the time of peak load demand.
1 Introduction
The goal of economic dispatch (ED), which is a crucial task in power systems and is essentially a multi-objective optimization problem, is to determine the best schedule for generators to minimize the overall fuel cost under specific limitations, including loss in the system (Jayabarathi et al., 2016; Latif et al., 2020). Minimization of generation costs is the goal of the significant, practical optimization problem known as economic dispatch in power systems (Dey et al., 2020). Given the significance of ED, efforts to solve the ED problem date back to the early 1970s. ED can be resolved using the gradient method, the projection method, and the λ-iteration method as a restricted optimization problem (Wood et al., 2012). In the studies by Chiang (2005) and Sahoo et al. (2024), the existence of forbidden operation zones is one of the requirements that the ED problem must meet. Bahrani and Patra (2017) used the orthogonal PSO (OPSO) algorithm for solving the ED problem by taking three power systems under several power constraints imposed by thermal generating units (TGUs) and smart power grid (SPG), for example, ramp rate limits and prohibited operating zones. Chatuanramtharnghaka et al. (2021) used a multi-objective optimization method called grasshopper optimization algorithm (GOA) to manage congestion in the system transmission line. The algorithm adjusts parameters to ensure that the system operates at the lowest possible cost. Sahoo et al. (2023) investigated the role of flexible AC transmission systems in managing congestions in a deregulated market for different topologies. Latif et al. (2021) estimated the optimal power dispatch for a marine microgrid using the GOA. The findings when contrasted with those of the most popular and contemporary algorithms demonstrate that the GOA produces more robust results that capture more renewables and provides more stability. Lalhmachhuana et al. (2024) utilized a multi-objective engineering design issue to apply MOALO, which is contrasted with MOPSO. The findings demonstrate how the excellent convergence and coverage of the GOA help its test functions. The algorithm’s performance on economic and emission dispatch problems shows how well it works to solve difficult real-world issues as well.
Sen and Mathur (2016) suggested a better method for creating artificial bee colonies (ABCs) to address the dynamic economic emission dispatch (DEED) issue. The suggested method provides superior optimum solutions when compared to over ten metaheuristic techniques, according to the results. The problem of environmental issues and the energy crisis has drawn significant attention to PEVs as a crucial component for future power systems (Safiullah et al., 2022; Xing et al., 2016). However, as PEV charging habits are variable, when more PEVs are sold, the peak–valley load disparity will widen even more, increasing the load demand (Ranjan et al., 2021; Ma et al., 2017). Tappeta et al. (2022) examined the framework of the V2G technology and its advantages, drawbacks, and optimization techniques. The authors concluded that V2G can assist the electricity system with peak load cutting and load leveling. Hussain et al. (2020) showed that with V2G, air pollution and power outages can be reduced, system efficiency can be increased, and the grid can become more stable and dependable. They play a critical role in supporting supply and demand balancing by reducing peaks and filling valleys. The EV batteries can be charged during the evenings, when there is less demand (Han et al., 2010a). The bidirectional inductive power transfer (IPT) charger is developed by Madawala and Thrimawithana (2011) with a control system that may be utilized to set a boundary for the maximum value of the primary side current when it increases, thereby safeguarding the IPT system. Srivastava et al. (2010) addressed the various modeling approaches and optimization techniques used in the studies of the market penetration rates of electric vehicles, hybrid electric vehicles, plug-in hybrid electric vehicles, and battery electric vehicles. Sioshansi and Denholm (2009) conducted an in-depth review of the current state of EVs and related grid-interfacing technologies in the literature. The primary conclusions and data information are taken from recent publications that emphasize the most recent developments in technology, their drawbacks, and possible directions for future market growth. Kempton and Tomic (2005) determined the grid power capacities of three different types of electric drive cars by the developed formulae. The revenue and expenses that supply electricity to different electric marketplaces are assessed using these equations. Han et al. (2010b) examined the response of EVs in frequency regulation. Certain distinct scenarios have been taken into account when assessing the impact of disturbances in system frequency: the non-availability of grid-connected EVs and EVs that provide frequency response. Nsonga et al. (2017) suggested a methodical strategy in which every charging and discharging sequence for electric vehicles is recognized.
Following that, ratings and suggestions on which tactics to use for particular purposes are also given. The viability of charging PHEVs at off-peak hours on Ontario’s grid is examined (Hajimiragha et al., 2010). By storing surplus energy generated during windy periods and delivering it back into the grid during times of high demand, V2G can be used to buffer renewable energy sources, such as wind turbine generators. This essentially stabilizes the alternating nature of wind power. Kempton et al. suggested using V2G for electric vehicles, in which it enabled the EVs to function as part of the power system (Kempton and Letendre, 1997; Ustun et al., 2021). When EVs take part in V2G, they can charge at a lower cost during off-peak hours and absorb more energy as an allocated battery to stabilize the power grid. When peak load demands arise, the discharge function is then utilized to supply electricity to the grid (Peng et al., 2012).
In the near future, when huge numbers of EVs will be used, they will take part in smart discharging and charging, which is an area of study that is starting to gain attention. Some solutions and models have been suggested for the scheduling challenge for charging and discharging of EVs (Galus and Andersson, 2008; Yao et al., 2013). Saber and Venayagamoorthy (2011) utilized PEVs and renewable energy sources to the fullest extent possible, taking into account the economic and emission goals while planning PEV usage. Hoehne and Chester (2016) put forth an ideal charging schedule, taking into account both standard and V2G PEV usage, to reduce carbon emissions. The authors concluded that using V2G during peak hours helps minimize carbon dioxide emissions. Ustun et al. (2013) examined the impact of PEVs on the power grid using three methods. PEVs can provide a way to replace fuel with domestic resources for energy independence, minimized carbon dioxide emissions, and lower fuel cost by developing advanced battery technologies. When compared with other technologies, Li-ion batteries have shown higher energy storage and power delivery capabilities, but they also have a far longer life in the deep-discharge cycling required for EV development (Keshan and Thornburg, 2016). Wei et al. (2022) studied the degrading characteristics of Li (NiMnCo)O2 batteries under V2G applications and demonstrated that even if additional energy leads to cyclic degradation, V2G discharging reduces battery decay by 0.95% as compared to charging since it extends the battery’s calendar life. Bhoir et al. (2021) evaluated the potential earnings for an auxiliary service provider using a fleet of EVs to offer various ancillary services on the power market in Li-ion batteries through a case study utilizing this battery concept. It demonstrates that the most profitable endeavor is to offer both peak shaving and frequency containment reserve. Hadi Amini et al. (2017) proposed fast-charging strategies for preventing or minimizing lithium plating. The charge profiles for both online and offline applications are obtained using the impedance tracking (IT) approach. When compared to current/constant voltage (CC-CV), the suggested solutions increased battery life by over 75%, with only a slight increase in the related charge time. Shargh et al. (2016) studied the Li-ion battery to reduce degradation through state-of-charge pre-conditioning strategies that allow an electric vehicle to participate in vehicle-to-grid operations during periods in which the vehicle is parked. In comparison to the reference standard charging approach, the analytical results demonstrate that the proposed charging strategies do not accelerate battery degradation and can mitigate the entire aging process, starting at 7.3 26.7% for the first 100 days of operational life and gradually increasing to 8.6 12.3% for a year of continuous operation. Shazly et al. (2023) developed a double-stage method for distributing EV parking spaces with distributed renewable resources throughout the power distribution system. It takes into account the financial gains of parking lot investors as well as the operational technical limitations of distribution network operators. Singh et al. (2014) used a point estimate method (PEM) for Nataf transformation, and the joint probability density function (PDF) of wind speed related to different places was generated using marginal PDF, and the correlation matrix is available in most cases, which satisfy the service condition of Nataf transformation. Xie et al. (2024) suggested two-layer optimal dispatch systems to fully realize the promise of the EV demand response and address the issues caused by the integration of new energy vehicles into the power grid. The first approach is to evaluate the potential for an EV load demand response, and the second is to use the evaluation value of the EV response potential as the load adjustment range. These tactics are used in real-time, and the scheduling outcomes demonstrate the strategy’s greater economic viability. Nourianfar and Abdi (2023) used an improved multi-objective exchange market algorithm to resolve the multi-objective dynamic economic emission dispatch problem in the presence of wind farms and EVs simultaneously. The performance of the suggested strategy and the efficacy of the suggested method are examined. The findings demonstrate that the addition of EVs lowered both the system’s operating costs and emissions. Guo et al. (2021) presented a new multi-level optimal V2G scheduling approach to guarantee seamless operation and control from the V2G control center to the EV users, in addition to introducing a new EV economic dispatch optimization model to reduce the operating expenses of regional V2G systems. Furthermore, the viability of the suggested model suggested that extra load variations caused by large-scale vehicle fleets may be minimized through appropriate size regulation of the total EV battery capacity. Dynamic economic emission dispatch is simultaneously solved by Tawfak Al-Bahrani et al. (2020) on 30,000 electric vehicles during crest shaving and valley filling (CSVF) regions, while applying load demand management (LDM) under different actual equality and inequality operating power limitations. Zou et al. (2022) suggested a novel NSGA-II (NNSGA-II) to address dynamic economic emission dispatch with plug-in electric vehicles. This new method takes into account both the density and evenness of solutions by incorporating a rewarding coefficient into the crowding distance during density estimation.
Motivation: although implementation of EVs has limitations, with the development of technologies, infrastructures, and power grids, EVs will dominate the car market. In addition, with the depletion of fossil fuel supplies, the production and consumption of electric power can be resolved by considering renewable energy resources and EV technologies. Wind power is a renewable energy source that has drawn considerable attention. Their quick development has presented the electrical grid with additional difficulties. That is why large-scale deployment of EVs and renewable energy resources is inevitable in future microgrids. With the development of V2G applications, batteries can also be improved to act as an energy storage system (ESS), and thus, a certain number of V2G vehicles can act as a small power plant and reduce peak demand on the power grid. EVs can lead to sustainable development in the power distribution network. The EV industry is booming around the world, which may further impose much pressure on the existing network infrastructure. Therefore, there is lot of scope to verify the impact of EVs on the power system. This motivates the authors to work on the topic of EVs’ impact on the power system operation.
Research gap: from the literature review, it is observed that EVs, at V2G and G2V modes of operation, can be used for valley filling and peak shaving, so in this paper, valley filling and peak shaving are achieved by implementing large-scale EVs during peak hours, as well as minimizing the generation cost and power loss of the system.
Novelty: we have tried to demonstrate the impact of a large scale of EVs on the power system cost and loss minimization based on a multi-objective problem. In addition, the demonstration on the peak load shaving and valley filling considering large-scale EVs in V2G and G2V modes has been analyzed in the proposed work.
The contribution of the work is summarized below:
• A 30-bus test is optimized using the MOGOA and MOALO to reduce the generation cost and loss of the system.
• Four different types of EVs are integrated into the system with different parameters and SOCs.
• During off-peak hours, all the EVs are set to charge, and during peak hours, all the EVs are set to discharge.
• This operation of V2G vehicles can reduce the power generation of the conventional power plants, which ultimately reduces the generation cost and power loss of the plant.
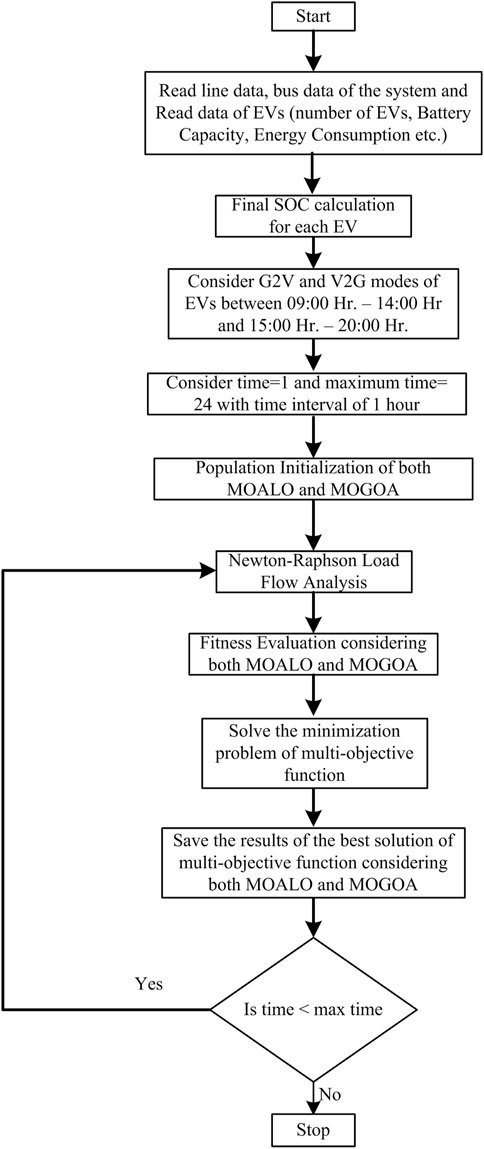
The rest of this paper is organized as follows: Section 2 shows the mathematical formulation of ED problems with several power constraints. Section 3 shows the algorithms for applying the MOGOA and MOALO with flowcharts as shown in Figure 1. The experimental results and discussions are provided in Section 4, and Section 5 shows the conclusion and future scope of the work.
2 Mathematical formulation
2.1 Objective functions
The curve for the generator cost can be obtained by the quadratic function. The equation for the total generation cost F(PG) can be written as (Sahoo et al., 2024) in Equation 1.
Here, N is the number of thermal units; ai, bi, and ci are the cost coefficients of the ith unit in $/hr; and Pi is the active power output of the ith generator expressed in MW.
The resistances present in transmission lines and various pieces of equipment cause power loss in the system. Active power loss is given in Equation 2 (Bahrani and Patra, 2017):
where Vi and θi symbolize the voltage magnitude and voltage angle at bus i, respectively, Gq(ij) represents the transfer conductance between bus i and bus j, and NL symbolizes the number of transmission lines.
The multi-objective-based proposed objective function can be utilized for minimization of loss in active power and generation cost. Thus, the objective function is as in Equation 3 (Sahoo et al., 2024):
The independent/control variables of the proposed work are PG and VG.
Here, PG represents the active output power generation at PV buses, and VG represents the voltage at generator buses. In addition, the dependent variable is VL, and it represents the voltage value at PQ or load buses. The fitness function for the minimization problem is as in Equation 4:
Here, Fobjmin is the multi-objective function to be minimized (Nourianfar and Abdi, 2023).
2.2 Constraints
Constraints can be defined as a condition that a solution must satisfy in solving an optimization problem.
2.2.1 Power balance constraints
Considering the charging and discharging of EVs, the power balance equation of the system can be expressed as in Equation 5 (Tappeta et al., 2022):
Here, PV2G and PG2V are the discharging power and charging load of PEVs, respectively, and PD and PL are the power load demand and active power loss in the system, respectively.
2.2.2 Equality constraints
It defines that power generation should be enough to supply load demand, including losses, to obtain the best value for the proposed optimization. The equations for power balance are in (Equations 6, 7).
Here, index
The inequality constraints are given in (Equations 8–11).
i. Generator constraints: it refers to the reactive power, active power, and voltage outputs in the system, which is bounded as follows (Jayabarathi et al., 2016):
Here, the indexes VGp and PGp indicate the magnitude of voltage and generation of real power, respectively, and the number of the generating unit is represented as NG.
ii. Security constraints: the term “security constraints” refers to the restrictions on the load bus voltage and the line’s maximum power flow rate. It can be formulated as follows (Jayabarathi et al., 2016):
2.3 Single EV recharge energy
This section develops the energy consumption for charging an EV using the proposed probabilistic model in Shazly et al. (2023), such that the key determinants of how an EV charges, such as its battery capacity, operating condition, daily driving range, and other parameters, are taken into account.
According to statistics on EV driving behavior in Shazly et al. (2023), the daily miles that an EV travels, denoted as Md, generally adheres to the lognormal distribution, in Equation 12.
Here, the standard normal variate is given as N; μm and σm are the parameters for log-normal obtained from the mean and standard variation of Md, represented as
Then, the maximum achievable driven distance, Mdmax, can be calculated as in Equation 14 (Shazly et al., 2023):
Here, β is the battery capacity of each EV, and Em denotes the energy consumption of the EVs.
The anticipated energy requirement of an electric vehicle based on the maximum distance traveled can be calculated as in Equation 15 (Shazly et al., 2023):
The initial SOC is given as SOCini, and the final state of charge, SOCf, can be expressed as in Equation 16 (Shazly et al., 2023):
Here, “d” is the daily traveled distance of each vehicle.
The charging time of a single EV can be expressed as in Equation 17, (Shazly et al., 2023):
3 Multi-objective optimization and work flowchart
3.1 Grasshopper optimization algorithm
This technique copies the swarming nature of grasshoppers as a reference. The inspiration was obtained from how grasshoppers swarm on food locations. The algorithm proceedings show a similar function to that of the particle swarm optimization algorithm. The searching process includes exploration of random areas where food will most likely be available, as in the case of grasshoppers (Latif et al., 2021).
The grasshopper swarm’s social interaction, gravitational pull, and wind advection are the three factors that make up the optimization. The positions of grasshoppers are theoretically predicted as in Equation 18:
Here, Xp represents the pth grasshopper position, Sp represents the pth grasshopper social interaction, Gp is the gravitational force, and Ap is the wind advection. The social interaction between the grasshoppers is given as in Equations 19, 20:
The social force influencing the grasshopper is denoted as the function s in Equation 15, whereas f denotes the attraction’s strength, y denotes the separation of the grasshopper, and kk is the attraction’s length. Using the equation below, the grasshopper position can be implemented as in Equations 21, 22.
Here, “G” is the optimization algorithm’s parameter, “p” denotes the position of the zth variable, “
3.2 Ant-lion optimization
This optimization technique copies the hunting behavior of the ant lion, i.e., how they interact with their prey such as ants in nature. The MOALO was an extended edition of the ant lion optimizer (ALO). The operation of this optimization shares some similarity with the other population-based optimization techniques such as the MOPSO and MOGOA (Lalhmachhuana et al., 2024).
The algorithm of the multi-objective ant lion optimizer is as follows (Lalhmachhuana et al., 2024):
1. Initialize the population of the ant having random values.
2. The individual in the population is evaluated for objective function.
3. A random walk-around technique is used to explore the search space. It is given as in Equation 23.
Here, r is a random value in the range 0–1, cumsum is a term for calculating the cumulative sum, and y is the steps of iteration.
4. The ants are then normalized such that the position of the ants is maintained inside the search space, which is given as in Equation 24:
Here,
5. The ant lion population is not evaluated because they are assumed to be in the location of the ant position for the first iteration and relocate their position accordingly based on the position of the ants.
6. An elite ant lion also exists to follow the position of the ant regardless of their distance.
7. If only the ant lion is fitter than the elite, then the elite will be replaced by the ant lion.
8. Increasing the generation or iteration.
9. If the generation reaches its maximum, END the loop.
3.3 Work flowchart of the proposed work
The work flowchart is summarized below:
First, the line data and bus data are collected from the 30-bus test system. The information of EVs such as the number of EVs, battery capacity, and energy consumption is read. Then, Newton–Raphson load flow analysis is performed with and without considering EVs. The final SOC of each vehicle is calculated. Based on the different SOCf, the EVs are set to G2V and V2G modes of operation between 09:00 to 14:00 and 15:00 to 20:00. Then, MOGOA and MOALO optimization techniques are used to minimize the multi-objective functions, and the results are saved accordingly.
4 Results and discussions
A total of six generator bus, 20 loads, and 41 transmission lines can be obtained in an IEEE 30-bus system. The generators buses are located at 1, 2, 13, 22, 23, and 27. The line data and bus data are taken from Singh et al. (2014). The boundary limits of all the constraints are also taken from Singh et al. (2014).
In this work, to demonstrate the key characteristics of the suggested MOGOA and MOALO with the fuzzy satisfaction maximization approach, simulation results are provided and represented in an hourly basis.
4.1 Parameters of both the multi-objective optimization techniques are set as shown below
• Population size (Np) is set at 100.
• Random populations are generated by bus generator limits and bus voltage limits.
• Repository size (Nr) is set at 100.
• Maximum number of iterations is set at 100.
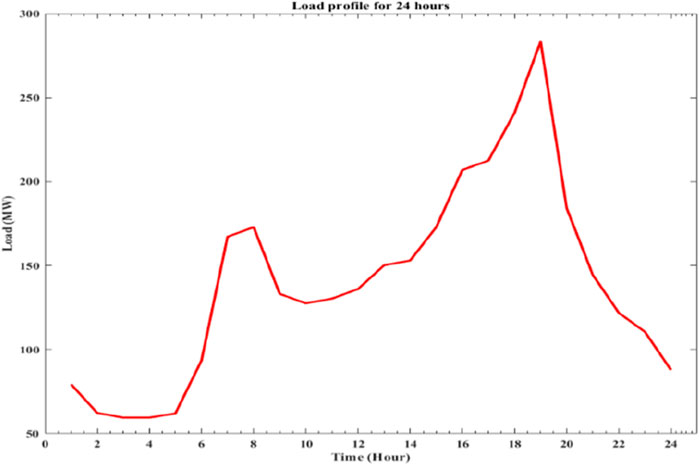
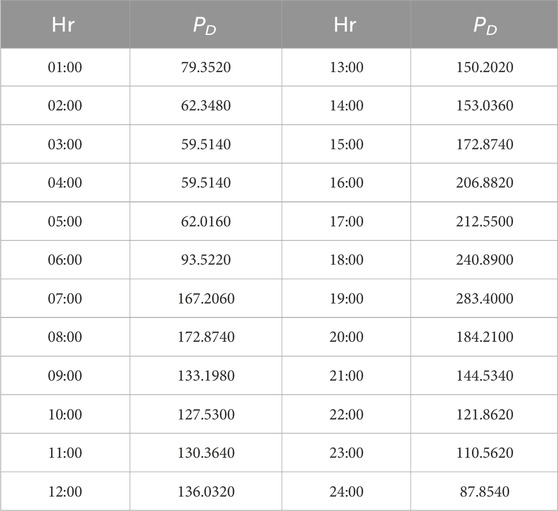
In addition, a daily load profile is generated using a scaling factor ranging from [0, 1] against the total active power load of 283.4 MW for the IEEE 30-bus test system, as shown in Figure 2.
In addition, according to the above load profile, the table for load demand is given in Table 1.
In this work, most vehicles are assumed to leave home at 09:00 and reach home at 20:00. Thus, much of the comparison of the data will be done between these intervals (09:00–20:00 Hr.).
4.2 Case I: ED problems without EVs
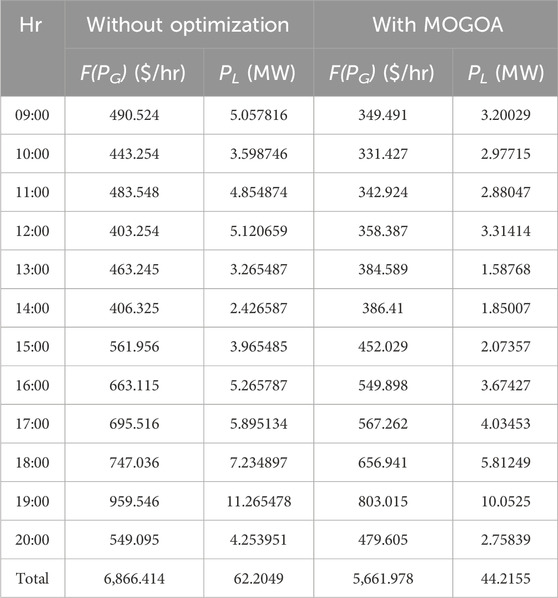
Initially, the IEEE 30-bus test system is studied using Newton–Raphson load flow, without considering any optimization algorithm. The total power loss within the interval 09:00–20:00 in the IEEE 30-bus system is 62.2049 MW, and the generation cost is 6,866.414 $/hr.
Now, the proposed optimization technique, the multi-objective grasshopper optimization algorithm (MOGOA), is used. The two objective functions are optimized using the GOA and fuzzy satisfaction maximization approach. Comparison between the two systems is shown in Table 2.
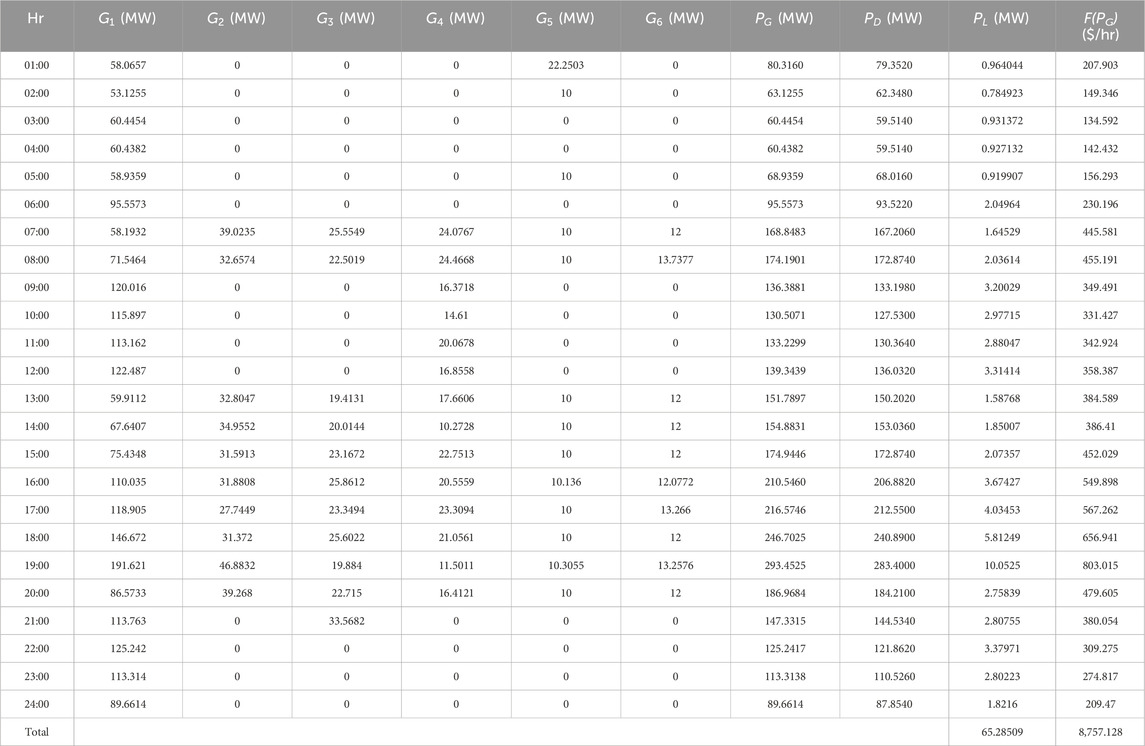
Table 2 shows that the proposed algorithm already improves the generation cost and power loss of the system. Table 3 shows the complete power generation, generation cost, and power loss of the system for 24 h.
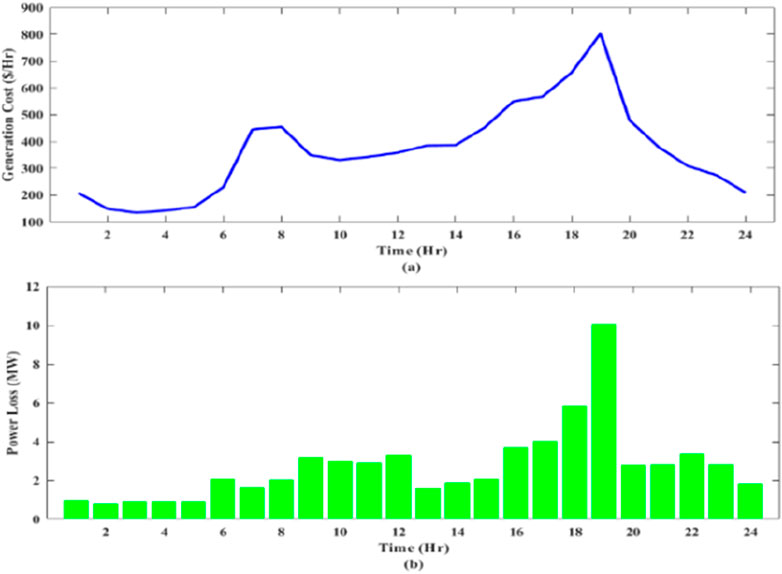
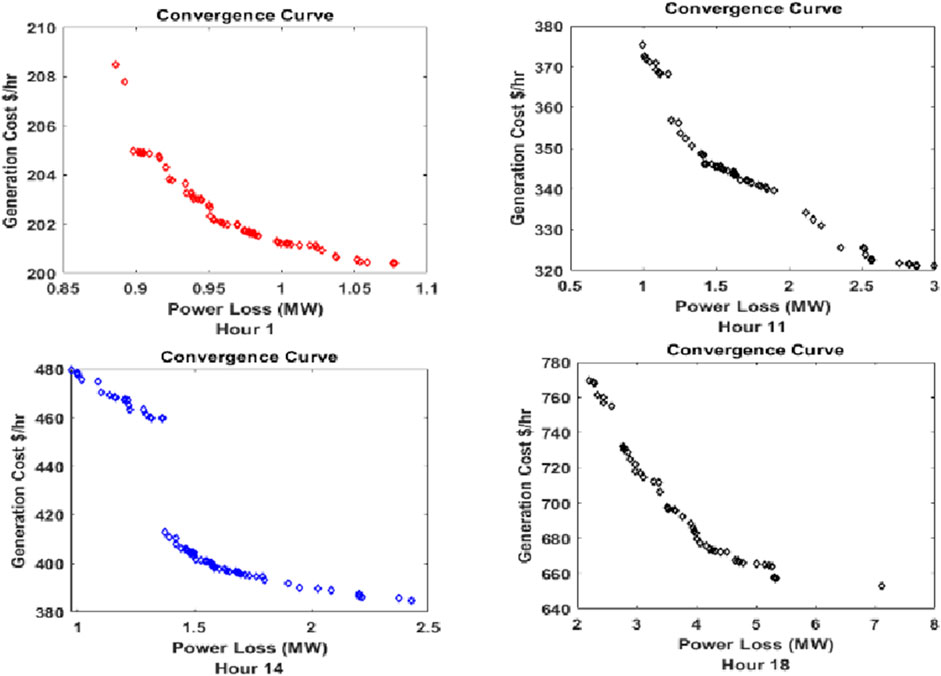
As given in Table 3, for hour 1, the load demand (PD) is 79.3520 MW. In order to meet the load demand, the power generated (PG) at this particular hour is 80.3160 MW, which is the sum of the power generated by the six generators (G1–G6). Active power loss (PL) is observed to be 0.964044 MW, and the total cost of power generation is 207.903 $/hr. The power generated can be observed for each hour and cost of power generation. It can be seen that the total generation cost and power loss for 24 h are 8,757.128 $/hr and 65.28509 MW, respectively. Figure 3 shows the graphical representations for the cost and loss using the MOGOA. Figure 4 shows some selected convergence curves for 24 h due to limitations of the number of figures.
Figure 4 shows the convergence curve for 01:00, 11:00, 14:00, and 18:00, respectively. Due to limitations of number of figures, convergence for all hours cannot be shown. So these hours are randomly selected. It should be noted that in some hours, there are few solutions. This is because the load demand is low during these hours, and only the slack bus is assumed to be generating power, and thus, minimum solutions can be seen during these convergences. This can also be seen in future cases. Now, another algorithm, called MOALO, is used to observe the performance of the objective functions, with the same parameters set as those of the MOGOA.
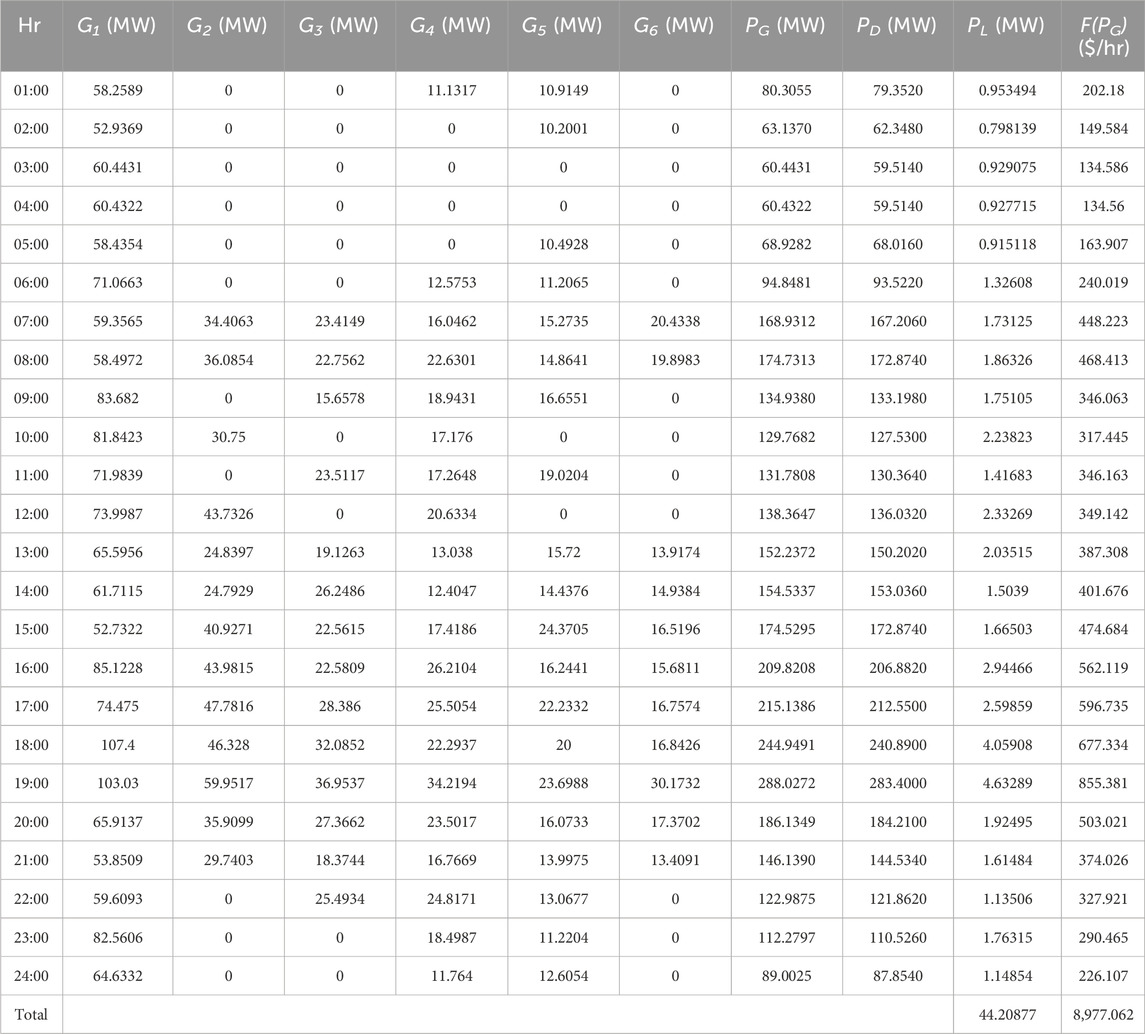
Table 4 shows the complete power generation, generation cost, and power loss of the system for 24 h. For 01:00, the load demand (PD) is 79.3520 MW. In order to meet the load demand, the power generated (PG) at this particular hour is 80.3055 MW, which is the sum of the power generated by the six generators (G1–G6). Active power loss (PL) is observed to be 0.953494 MW, and the total cost of power generation is 202.18 $/hr. The rest of the power generations can be observed for each hour. In addition, it can be observed that the total generation cost and power loss for 24 h are 8,977.062 $/hr and 44.20877 MW, respectively. If we compare the multi-objective function of the MOGOA and MOALO, it is observed that the MOGOA performs better at minimizing the generation cost, while MOALO performs better at minimizing the power loss.
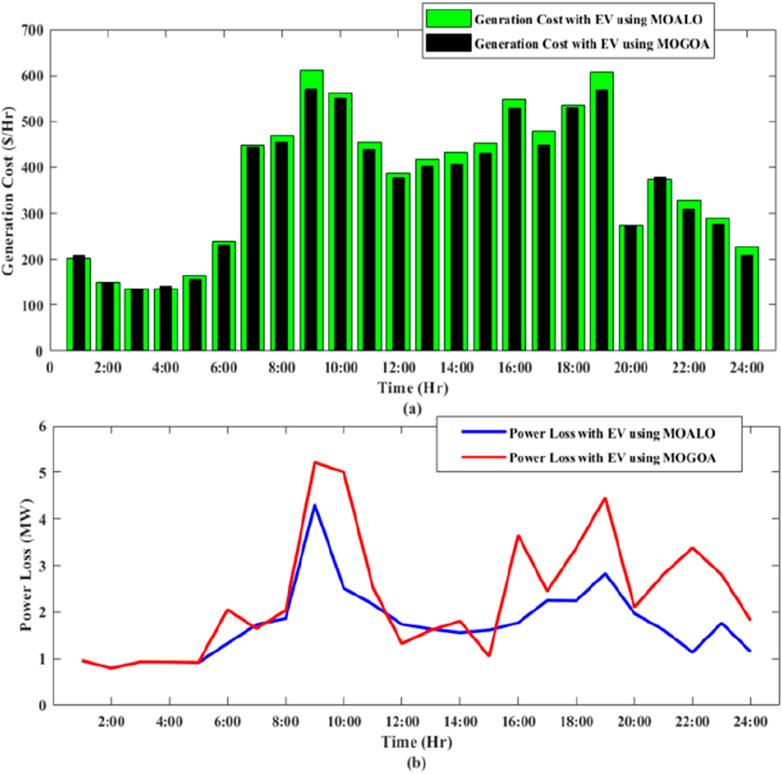
From Figure 5, it is clear that both the MOGOA and MOALO have better performances for the multi-objective functions compared to the others. It is clear that the MOGOA is better at minimizing the generation cost, while MOALO is better at minimizing power loss of the system. The convergence curve for MOALO can be seen in Figure 6. As mentioned before, due to limitations of the number of figures, some selected hours are shown.
4.3 Case II: ED problems with G2V and V2G
As shown in Table 5, a total number of 32,800 EVs is considered. In addition, for this case, most vehicles are assumed to leave home at 09:00 and leave their workplace at 20:00, so all the EVs are charging and discharging between these hours. The daily travel distance is assumed to be between 8 and 12 miles for all types of EVs. Four types of EVs are considered, and the parameters of each type of EVs are shown in Table 5. The final SOCf is calculated using Equation 16, and the calculated values are shown in the last column of Table 6. The energy consumption and battery capacity of each EV are taken from Shazly et al. (2023), while the total number of vehicles has been limited to meet the system demand. The number of micro cars is assumed to be highest as it is the most affordable by the common users. The economy cars, mid-size cars, and light trucks/SUVs are used for public and goods transportation and assumed to be approximately 3,500–4,500.
4.4 For charging condition using the MOGOA:
During 09:00 to 14:00, all EVs are set to the charging mode since it is the off-peak period. SOCf is the state of charge that each vehicle is having when they reach their workplace at 09:00 (9 a.m.). If all vehicles are set to charging at 90%, then the amount of time required for each vehicle to reach 90% SOC is calculated using Equation 17 and shown in Table 6. PG2V is the amount of energy required to charge EV, so it will be considered part of the load in the power balance constraint. This PG2V will be randomly distributed to four buses, which produce the minimum values for the objective functions. During the charging condition, since there is extra energy required, the conventional power needs to produce more power to satisfy the power demand as well as the amount of energy for charging EVs. So the power balance constraint can be written as in Equation 25:
As shown in Table 3, at 09:00, the generation cost without EVs is 349.491 $/hr. When EVs are set to charging, the power generated (PG) has to satisfy the load demand (PD) as well as the charging load (PG2V), so higher power is generated during this period. Thus, the generation cost with EVs increased to 571.004 $/hr, and the power loss will also be increased from 3.20029 MW to 5.21714 MW at this particular hour, as shown in Table 7. Thus, the generation cost and active power loss are higher in the presence of EVs within these hours.
4.5 For discharging condition using the MOGOA
During 15:00 to 20:00, all EVs are set to the discharging mode as it approaches the peak load hours. Final state of charge (SOCf) for all the vehicles at 15:00 is 90%. Micro cars are set to discharge 45%, economy cars are set to discharge 46%, mid-size cars are set to discharge 48%, and light truck/SUVs are set to discharge 50%. Then, the time required for V2G is calculated using Equation 17 and shown in Table 8. PV2G is the stored power discharged by the EVs from their battery to the grid, preferably during peak hours, so as to reduce power generation as well as peak demand. The discharged powers are again randomly distributed to four buses of the system, which also produce the minimum values for the objective functions. Since EVs act as a power plant during this period, the power generated by the conventional power will be reduced. Then, the power balance constraint for discharging can be written as in Equation 26:
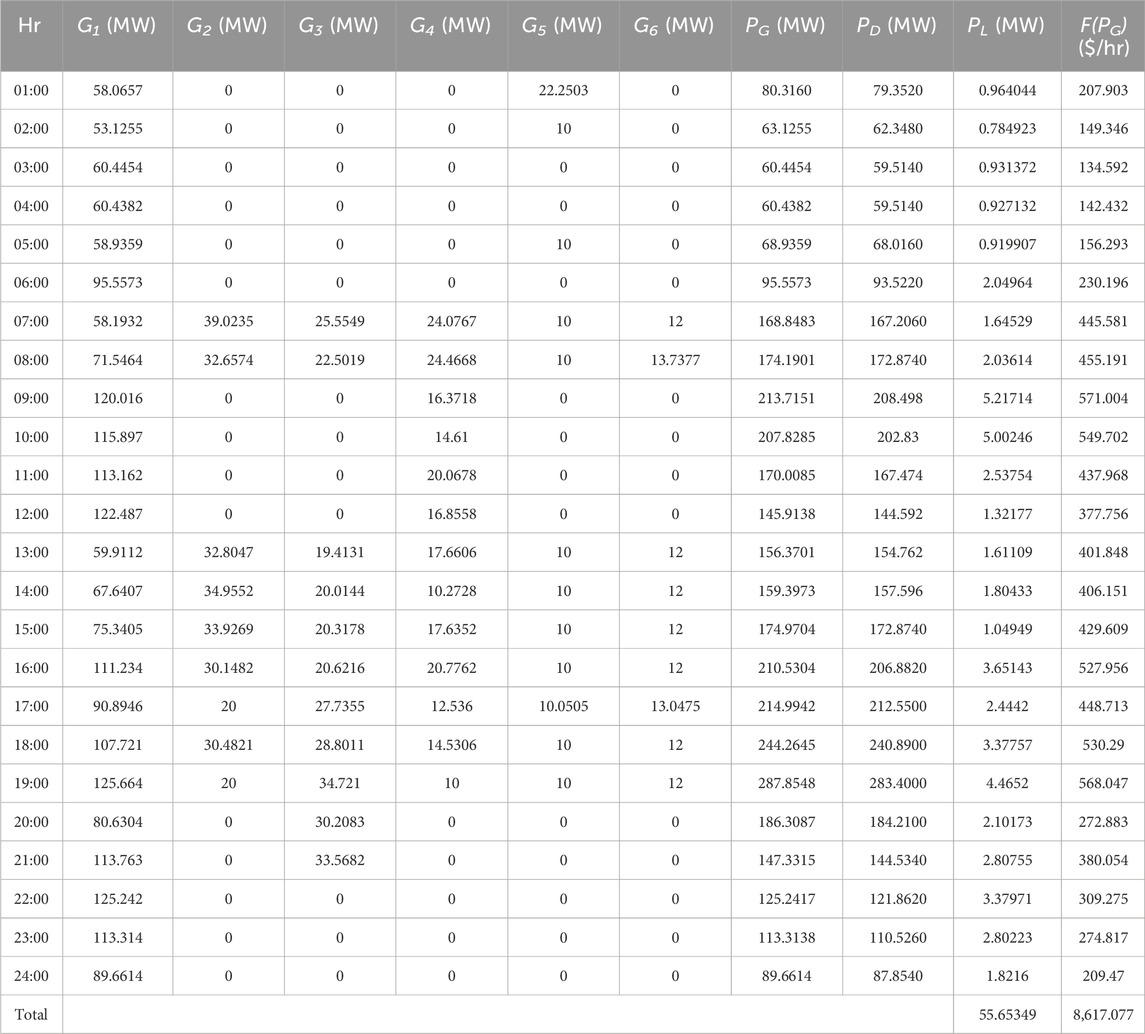
The power generation during the discharging condition with the MOGOA (15:00 to 20:00) is shown in Table 9, with power discharged shown for each hour. At 15:00, the power demand (PD) is 172.8740 MW, and in to order satisfy this load demand, the power generated (PG) is 169.2204 MW, which is aided by the discharged power (PV2G) of 5.75 MW, and thus, the generation cost is 429.609 $/hr.
As seen from Table 3, at 15:00, the power generation cost without EVs is 452.029 $/hr. When the EVs are set to discharging, the load demand (PD) will be satisfied by the power generated ((PG) by the conventional power plant as well as the discharged power (PV2G), so power generation cost is reduced to 429.609 $/hr. In addition, at 15:00, power loss without EVs is 2.07357 MW. When EVs are set to discharge, energy is also supplied by the EVs, so power loss is reduced to 1.04949 MW, as shown in Table 9. Thus, generation cost and power loss will be reduced due to EVs during this period.
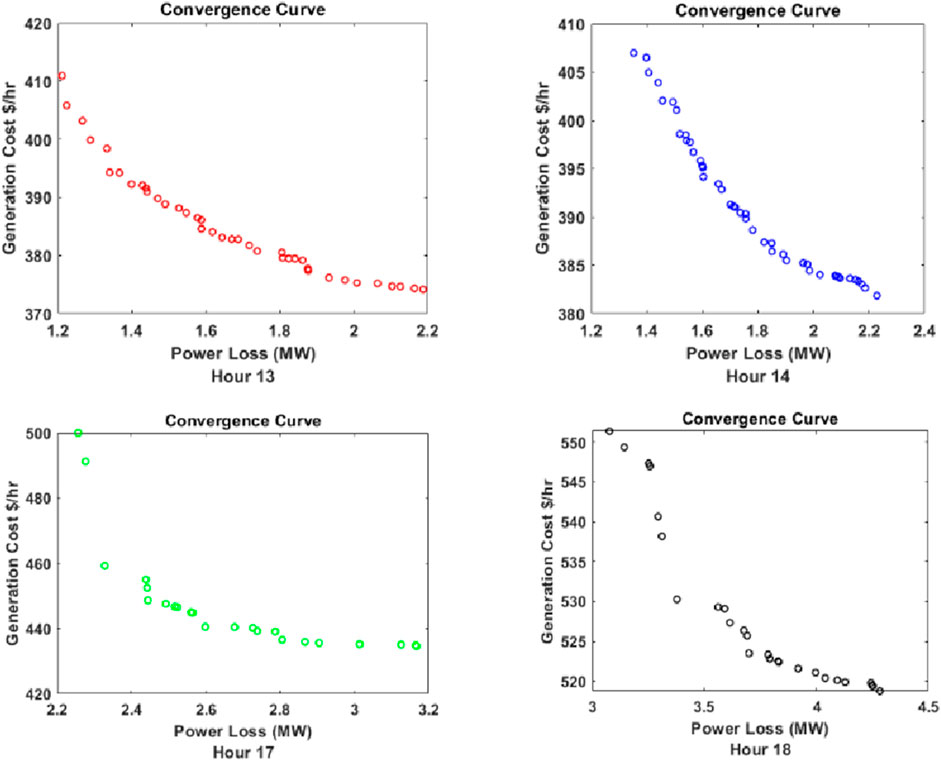
Figure 7 shows the comparison of generation cost and power loss for case I and case II for charging and discharging conditions (09:00 to 20:00) using the MOGOA. Figure 8 shows the convergence curve for four random hours between 09:00 to 20:00.
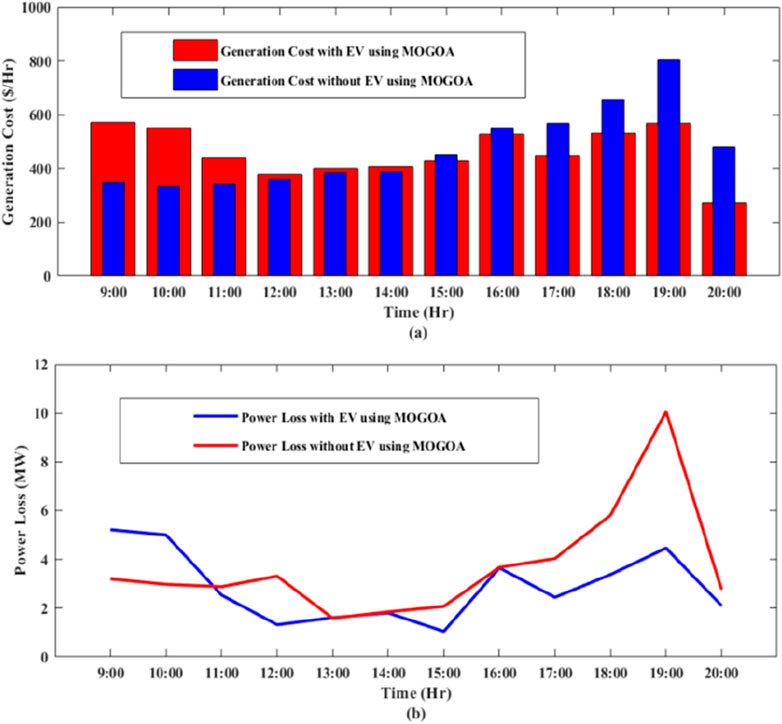
Figure 7. Graphical comparison using the MOGOA with EV and without EV between 09:00 and 20:00 for (A) generation cost and (B) power loss.
From Figure 7; Table 7; Table 9, it can be seen that the cost and loss are increased during the charging mode (i.e., 09:00–14:00), and during the discharging mode (i.e., 15:00–20:00), the cost and loss are reduced. Thus, peak shaving and valley filling can be observed in the presence of EVs. As shown in Table 10, the total generation cost for the MOGOA with EVs is 8,617.077 $/hr, and the total active power loss is 55.65349 MW.
Whereas in Table 3, the total generation cost for the MOGOA without EVs is 8,757.128 $/hr, and total active power loss of the system is 65.28509 MW. Thus, the difference is 140.051 $/hr for the power generation cost and 9.6316 MW for active power loss. Therefore, it can be concluded that the implementation of G2V and V2G in the system can help reduce the cost of the power generation and improves loss.
Now, MOALO is used to optimize the charging and discharging conditions and observe the variations in power generations as well as the objective functions during these hours.
4.6 For charging condition using MOALO
Table 11 shows the power generation cost for charging during 09:00 to 14:00. From Table 4, it can be seen that at 09:00, the generation cost without EVs is 346.063 $/hr. When EVs are set to charging, the generation cost at that particular hour increased to 611.003 $/hr, as seen from Table 11. The power loss increased from 1.75105 MW to 5.31164 MW, as observed on comparing Table 4 and Table 11. Thus, generation cost and power loss are high during this period with EVs.
4.7 For discharging condition using MOALO
During 15:00 to 20:00, all EVs are set to the discharging mode as it approaches the peak load hours. The final state of charge (SOCf) for all the vehicles at 15:00 is 90%. Micro cars are set to discharge 45%, economy cars are set to discharge 46%, mid-size cars are set to discharge 48%, and light truck/SUVs are set to discharge 50%. Then, the time required for V2G is calculated using Equation 17 and shown in Table 12.
Table 12 shows discharging of EVs during 15:00 to 20:00. As shown in Table 4, during 15:00, the cost of generation without EVs is 474.684 $/hr. When EVs are set to discharging, the cost of generation reduced to 453.118 $/hr, as observed in Table 12. Power loss without EVs at 15:00 is 1.66503 MW, and when EVs are discharged, power loss reduced to 1.61101 MW. Thus, generation cost and power loss are reduced in the presence of EVs.
MOALO is used with the same parameters as the MOGOA, with the same EV parameters as in Table 6 for charging condition and those in Table 8 for discharging condition. Table 11 shows the power generation for 09:00 to 14:00 with the EV load demand for each hour, and generation cost is high during these hours. Figure 9 shows the comparison of generation cost and power loss with and without EVs.
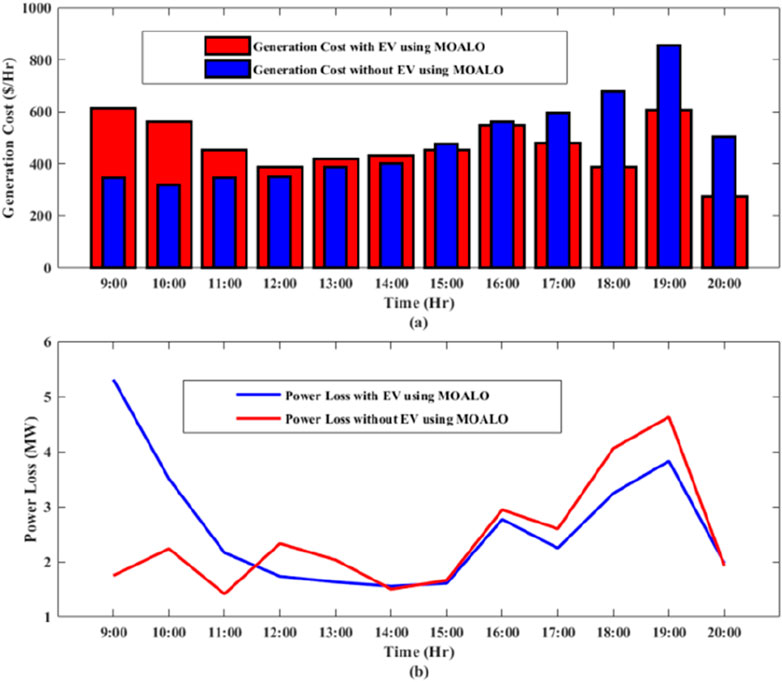
Figure 9. Graphical comparison with EVs and without EVs using MOALO between 09:00 and 20:00 for (A) generation cost and (B) power loss.
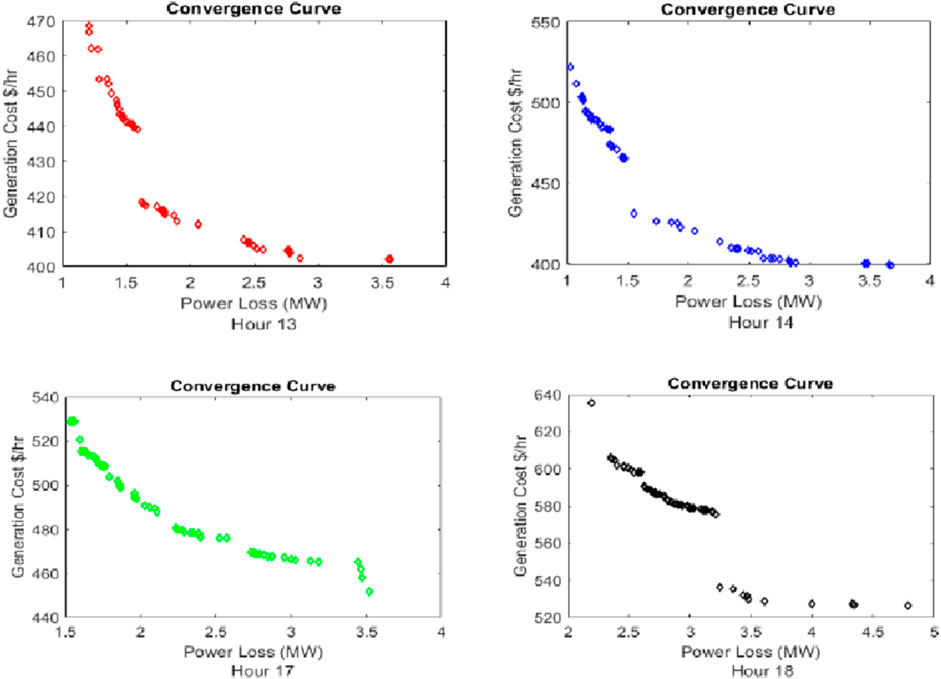
It can be seen that EVs can be used for peak shaving and valley filling while analyzing the effect on the objective functions with MOALO, while Figure 10 shows the convergence curve for MOALO with EVs for some selected hours due to limitations of space.
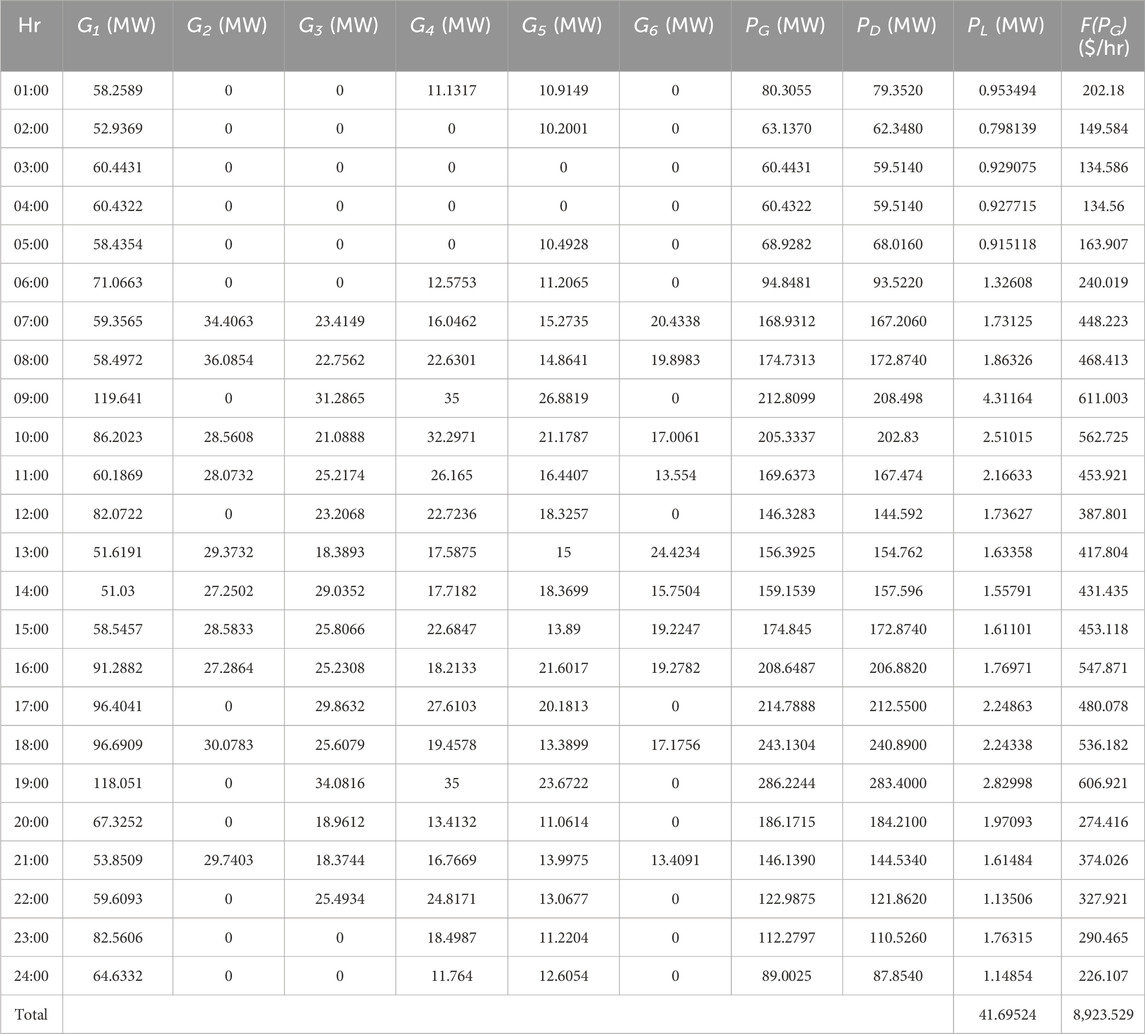
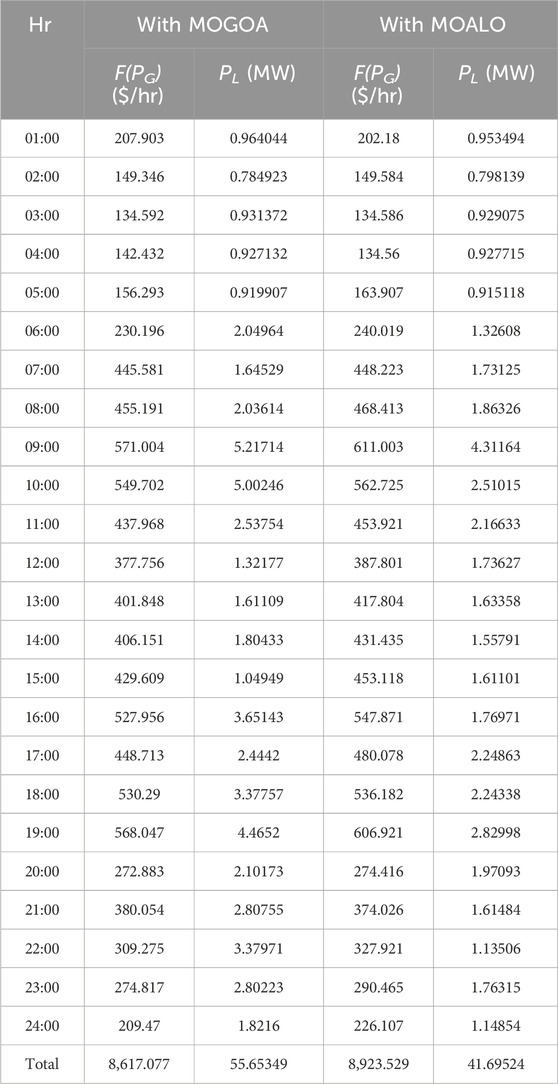
From Table 4, the total loss and cost for MOALO without EVs are 8,977.062 $/hr and 44.20877 MW, respectively. From Table 13, the total loss and cost for MOALO with EVs are 8,923.529 $/hr and 41.69524 MW, respectively. The difference for cost is 53.533 $/hr and for loss is 2.51353 MW. It is clear that the total loss and cost of the system decrease when EVs are implemented between 09:00 and 20:00, and thus, it validates the optimization results using the MOGOA.
Below are the comparisons for the MOGOA and MOALO with EVs for 24 h. The comparison of the cost and loss for the two optimizing techniques is given in Table 14 below.
From the table above, it is clear that for the two algorithms, the loss and cost of the system decrease after implementing G2V and V2G. However, the two algorithms outperform the other at minimizing the objective functions. The total generation cost for the MOGOA is 8,617.077 $/hr, whereas for MOALO, it is 8,923.529 $/hr. In addition, the total power loss for the MOGOA is 55.65349 MW, whereas for MOALO, it is only 41.69524 MW.
It is clear that the MOGOA minimizes the generation cost better, while MOALO minimizes the power loss of the system better. The graphical comparison for generation cost and power loss between the MOGOA and MOALO during charging and discharging hours can be observed below. As shown in Figure 11A, the generation cost is lower for the MOGOA almost at all the hours, but as shown in Figure 11B, the power loss is much lower for MOALO at almost all of the hours.
5 Conclusion and future scope
5.1 Conclusion
In this work, the IEEE 30-bus system is used to analyze the economic dispatch (ED) problems with and without EVs. Four types of EVs with different parameters are used, and the final state of charge of each vehicle is calculated, along with the energy required and time of charging. Then, MOALO is used to optimize the objective functions with both cases without EVs and with EVs. EVs are set to charging from 09:00 to 14:00 and are set to discharging from 15:00 to 20:00. After implementing EVs to the system, it can be observed that the total generation cost and power loss of the system decrease due to V2G power discharging. In addition, EVs provide an alternative method for dealing with peak load, while filling the off-peak hours effectively. If the number of EVs is large enough, the V2G system can replace other peak shaving and valley filling techniques completely. On comparing the MOGOA and MOALO algorithms, the MOGOA excels at minimizing the generation cost, while MOALO excels at minimizing the power loss of the system.
5.2 Future scope
The thorough analysis of EVs’ performance in the presence of renewable energy sources may further improve the power system’s operation. The studies of carbon emission reduction can also be performed in the future.
5.3 Real-time application
The proposed work can be applied in real-time where a huge number of EVs is ready to participate in the G2V/V2G coordinated approach. The utilization of power electronics-based converters is also essential in real-time application during EV integration in the system.
Data availability statement
The original contributions presented in the study are included in the article/Supplementary Material; further inquiries can be directed to the corresponding authors.
Author contributions
DH: writing–review and editing and writing–original draft. SDe: writing–review and editing and writing–original draft. SDa: writing–review and editing and writing–original draft. KS: writing–review and editing and writing–original draft. UC: writing–review and editing and writing–original draft. TU: writing–review and editing and writing–original draft.
Funding
The author(s) declare that no financial support was received for the research, authorship, and/or publication of this article.
Conflict of interest
The authors declare that the research was conducted in the absence of any commercial or financial relationships that could be construed as a potential conflict of interest.
Publisher’s note
All claims expressed in this article are solely those of the authors and do not necessarily represent those of their affiliated organizations, or those of the publisher, the editors, and the reviewers. Any product that may be evaluated in this article, or claim that may be made by its manufacturer, is not guaranteed or endorsed by the publisher.
References
Bahrani, L. T. A., and Patra, J. C. (2017). Orthogonal PSO algorithm for economic dispatch of thermal generating units under various power constraints in smart power grid. Appl. Soft Comput. 58, 401–426. doi:10.1016/j.asoc.2017.04.059
Bhoir, S., Caliandro, P., and Brivio, C. (2021). Impact of V2G service provision on battery life. J. Energy Storage 44, 103178. doi:10.1016/j.est.2021.103178
Chatuanramtharnghaka, B., Deb, S., and Datta, S. (2021). “Multi-objective based congestion management considering generation rescheduling and cost minimization using multi-verse optimizer,” in 2021 1st international conference on power electronics and energy (ICPEE), bhubaneswar, India, 1–6.
Chiang, C. L. (2005). Improved genetic algorithm for power economic dispatch of units with valve-point effects and multiple fuels. IEEE Trans. Power Syst. 20 (4), 1690–1699. doi:10.1109/tpwrs.2005.857924
Dey, P. P., Das, D. C., Latif, A., Hussain, S. M. S., and Ustun, T. S. (2020). Active power management of virtual power plant under penetration of central receiver solar thermal-wind using butterfly optimization technique. Sustainability 12, 6979. doi:10.3390/su12176979
Galus, M. D., and Andersson, G. (2008). “Demand management of grid connected plug-in hybrid electric vehicles (PHEV),” in Proc. IEEE energy 2030 conf, 1–8.
Guo, S., Qiu, Z., Xiao, C., Liao, H., Huang, Y., Lei, T., et al. (2021). Amulti-level vehicle-to-grid optimal scheduling approach with EV economic dispatching model. Energy Rep. 7, 22–37. doi:10.1016/j.egyr.2021.10.058
Hadi Amini, M., Parsa Moghaddam, M., and Karabasoglu, O. (2017). Simultaneous allocation of electric vehicles’ parking lots and distributed renewable resources in smart power distribution networks. Sustain. Cities Soc. 28, 332–342. doi:10.1016/j.scs.2016.10.006
Hajimiragha, A., Cañizares, C. A., Fowler, M. W., and Elkamel, A. (2010). Optimal transition to plug-in hybrid electric vehicles in Ontario, Canada, considering the electricity-grid limitations. IEEE Trans. Ind. Electron. 57 (2), 690–701. doi:10.1109/tie.2009.2025711
Han, S., Han, H., and Sezaki, K. (2010a). “Design of an optimal aggregator for vehicle-to-grid regulation service,” in Presented at the IEEE power energy soc. Conf. Innovative smart grid technol (Gaithersburg, MD).
Han, S., Han, H., and Sezaki, K. (2010b). Development of an optimal vehicle-to-grid aggregator for frequency regulation. IEEE Trans. Smart Grid 1 (1), 65–72. doi:10.1109/tsg.2010.2045163
Hoehne, C. G., and Chester, M. V. (2016). Optimizing plug-in electric vehicle and vehicle-to-grid charge scheduling to minimize carbon emissions. Energy 115, 646–657. doi:10.1016/j.energy.2016.09.057
Hussain, S. M. S., Aftab, M. A., Ali, I., and Ustun, T. S. (2020). IEC 61850 based energy management system using plug-in electric vehicles and distributed generators during emergencies. Int. J. Electr. Power and Energy Syst. 119, 105873. doi:10.1016/j.ijepes.2020.105873
Jayabarathi, T., Raghunathan, T., Adarsh, B., and Suganthan, P. N. (2016). Economic dispatch using hybrid grey wolf optimizer. Energy 111, 630–641. doi:10.1016/j.energy.2016.05.105
Kempton, W., and Letendre, S. E. (1997). Electric vehicles as a new power source for electric utilities. Res 2 (3), 157–175. doi:10.1016/s1361-9209(97)00001-1
Kempton, W., and Tomic, J. (2005). Vehicle-to-grid power fundamentals: calculating capacity and net revenue. J. Power Sources 144, 268–279. doi:10.1016/j.jpowsour.2004.12.025
Keshan, H., and Thornburg, J. (2016). “Comparison of lead-acid and lithium ion batteries for stationary storage in off-grid energy systems,” in 4th IET clean energy and technology conference (CEAT 2016). Malaysia: Kuala Lumpur, 1–7.
Lalhmachhuana, R., Deb, S., Datta, S., Singh, K. R., Cali, U., and Ustun, T. S. (2024). Multi-objective-based economic and emission dispatch with integration of wind energy sources using different optimization algorithms. Front. Energy Res. 12, 1421212. doi:10.3389/fenrg.2024.1421212
Latif, A., Hussain, S. M. S., Das, D. C., and Ustun, T. S. (2021). Double stage controller optimization for load frequency stabilization in hybrid wind-ocean wave energy based maritime microgrid system. Appl. Energy 282, 116171. doi:10.1016/j.apenergy.2020.116171
Latif, A., Paul, M., Das, D. C., Hussain, S. M. S., and Ustun, T. S. (2020). Price based demand response for optimal frequency stabilization in ORC solar thermal based isolated hybrid microgrid under salp swarm technique. Electronics 9 (12), 2209. doi:10.3390/electronics9122209
Ma, H. P., Yang, Z. L., You, P. C., and Fei, M. R. (2017). Multi-objective biogeography-based optimization for dynamic economic emission load dispatch considering plug-in electric vehicles charging. Energy 135, 101–111. doi:10.1016/j.energy.2017.06.102
Madawala, A. K., and Thrimawithana, D. J. (2011). A bidirectional inductive power interface for electric vehicles in V2G systems. IEEE Trans. Ind. Electron. 58 (10), 4789–4796. doi:10.1109/tie.2011.2114312
Nourianfar, H., and Abdi, H. (2023). Economic emission dispatch considering electric vehicles and wind power using enhanced multi-objective exchange market algorithm. J. Clean. Prod. 415 (2023), 137805, June. doi:10.1016/j.jclepro.2023.137805
Nsonga, P., Hussain, S. M. S., Garba, A., and Ali, I. (2017). “Performance evaluation of electric vehicle ad-hoc network technologies for charging management,” in 2017 IEEE PES asia-pacific power and energy engineering conference. Bangalore, India: APPEEC, 1–5.
Peng, M., Liu, L., and Jiang, C. (2012). A review on the economic dispatch and risk management of the large-scale plug-in electric vehicles (PHEVs)-penetrated power systems. Renew. Sustain. Energy Rev. 16 (3), 1508–1515. doi:10.1016/j.rser.2011.12.009
Ranjan, S., Jaiswal, S., Latif, A., Das, D. C., Sinha, N., Hussain, S. M. S., et al. (2021). Isolated and interconnected multi-area hybrid power systems: a review on control strategies. Energies 14, 8276. doi:10.3390/en14248276
Saber, A. Y., and Venayagamoorthy, G. K. (2011). Plug-in vehicles and renewable energy sources for cost and emission reductions. IEEE Trans. Ind. Electron. 58 (4), 1229–1238. doi:10.1109/tie.2010.2047828
Safiullah, S., Rahman, A., Lone, S. A., Hussain, S. S., and Ustun, T. S. (2022). Robust frequency–voltage stabilization scheme for multi-area power systems incorporated with EVs and renewable generations using AI based modified disturbance rejection controller. Energy Rep. 8, 12186–12202. doi:10.1016/j.egyr.2022.08.272
Sahoo, A., Hota, P. K., Sahu, P. R., Alsaif, F., Alsulamy, S., and Ustun, T. S. (2023). Optimal congestion management with FACTS devices for optimal power dispatch in the deregulated electricity market. Axioms 12, 614. doi:10.3390/axioms12070614
Sahoo, A., Sahu, P. R., Hota, P. K., Islam, M. M., and Ustun, T. S. (2024). Optimal dispatch of combined heat and power generating units with prohibited operating zones using improved heap-based optimizer. IET Gener. Transm. Distrib. 18, 79–96. doi:10.1049/gtd2.13070
Sen, T., and Mathur, H. D. (2016). A new approach to solve Economic Dispatch problem using a Hybrid ACO-ABC-HS optimization algorithm. Int. J. Elect. Power Energy Syst. 78, 735–744. doi:10.1016/j.ijepes.2015.11.121
Shargh, S., Khorshid ghazani, B., Mohammadi-ivatloo, B., Seyedi, H., and Abapour, M. (2016). Probabilistic multi-objective optimal power flow considering correlated wind power and load uncertainties. Renew. Energy 94, 10–21. doi:10.1016/j.renene.2016.02.064
Shazly, A. M., Anwer, N., and Metwally Mahmoud, M. (2023). Solving optimal power flow problem for IEEE-30 bus system using a developed particle swarm optimization method: towards fuel cost minimization. Int. J. Model. Simul., 1–14. doi:10.1080/02286203.2023.2201043
Singh, S. P., Tyagi, R., and Goel, A. (2014). Genetic algorithm for solving the economic load dispatch. Int. J. Electron. Electr. Eng. 7, 523–528.
Sioshansi, R., and Denholm, P. (2009). Emissions impacts and benefits of plug-in hybrid electric vehicles and vehicle-to-grid services. Environ. Sci. Technol. 43, 1199–1204. doi:10.1021/es802324j
Srivastava, A. K., Annabathina, B., and Kamalasadan, S. (2010). The challenges and policy options for integrating plug-in hybrid electric vehicle into the electric grid. Elect. J. 23, 83–91. doi:10.1016/j.tej.2010.03.004
Tappeta, V. S. R., Appasani, B., Patnaik, S., and Ustun, T. S. (2022). A review on emerging communication and computational technologies for increased use of plug-in electric vehicles. Energies 15 (18), 6580. doi:10.3390/en15186580
Tawfak Al-Bahrani, L., Ben, H., Mehdi, S., and Alex, S. (2020). Dynamic economic emission dispatch with load dema nd management for the load demand of electric vehicles during crest shaving and valley filling in smart cities environment. Energy 195, 116946. doi:10.1016/j.energy.2020.116946
Ustun, T. S., Hussain, M., Syed, M. H., and Dambrauskas, P. (2021). IEC-61850-Based communication for integrated EV management in power systems with renewable penetration. Energies 14, 2493. doi:10.3390/en14092493
Ustun, T. S., Zayegh, A., and Ozansoy, C. (2013). Electric vehicle potential in Australia: its impact on smartgrids. IEEE Ind. Electron. Mag. 7 (4), 15–25. doi:10.1109/mie.2013.2273947
Wei, Y., Yao, Y., Pang, K., Xu, C., Han, X., Lu, L., et al. (2022). A comprehensive study of degradation characteristics and mechanisms of commercial Li(NiMnCo)O2 EV batteries under vehicle-to-grid (V2G) services. J. Battery Energy Storage Adv. power Syst. 8 (10), 188. doi:10.3390/batteries8100188
Wood, A. J., Wollenberg, B. F., and Sheble, G. B. (2012). Power generation, operation, and control. 3rd edn. New York, NY, USA: Wiley.
Xie, T., Su, Y., Zhang, G., Zhang, K., Li, H., and Wang, R. (2024). Optimizing peak-shaving cooperation among electric vehicle charging stations: a two-tier optimal dispatch strategy considering load demand response potential. Electr. Power Energy Syst. 162 (2024), 110228. doi:10.1016/j.ijepes.2024.110228
Xing, H., Fu, M., Lin, Z., and Mou, Y. (2016). Decentralized optimal scheduling for charging and discharging of plug-in electric vehicles in smart grids. IEEE Trans. Power Syst. 31 (5), 4118–4127. doi:10.1109/tpwrs.2015.2507179
Yao, W., Zhao, J., Wen, F., Xue, Y., and Ledwich, G. (2013). A hierarchical decomposition approach for coordinated dispatch of plug-in electric vehicles. IEEE Trans. Power Syst. 28 (3), 2768–2778. doi:10.1109/tpwrs.2013.2256937
Zou, D., Li, S., Xuan, K., and Ouyang, H. (2022). A NSGA-II variant for the dynamic economic emission dispatch considering plug-in electric vehicles. Comput. and Industrial Eng. 173, 108717. doi:10.1016/j.cie.2022.108717
Glossary
ED Economic dispatch
PSO Particle swarm optimization
EVs Electric vehicles
PEVs Plug-in electric vehicles
PHEVs Plug-in hybrid electric vehicles
NiMH Nickel-metal hydride
Li-ion Lithium ion
Li(NiMnCo)O2 Lithium nickel manganese cobalt oxide
V2G Vehicle-to-grid
G2V Grid-to-vehicle
ALO Ant-lion optimization
|V|(initial) Initial voltage magnitude
δ(initial) Initial voltage angle
ΔP(initial) Change in real power
Xp pth grasshopper position
Sp pth grasshopper social interaction
Gp Gravitational force
Ap Wind advection
s Social force between the grasshopper
f’ Generation cost comparison during discharging using MOALO
y Distance between the grasshopper
kk Length of attraction
G Parameter of the GOA
N Number of thermal units
ai, bi, and ci Cost coefficients of the ith unit
Pi Active power output of the ith generator
Vi and θi Voltage magnitude and voltage angle at bus i
Gq(ij) Transfer conductance between bus i and bus j
NL Number of transmission lines
PV2G and PG2V Discharging power and charging load of EVs, respectively
PD and PL Power load demand and power loss of the system, respectively
Vy and Va Voltage magnitude at yth and ath bus, respectively
Gya and Bya Conductance and susceptance of yth and ath bus, respectively
VGp and PGp Voltage magnitude and real power generation, respectively
NG Number of generating units
VLr Voltage magnitude of load bus r
Sln Power at branch NBR
Nobj Number of objectives
N Number of non-dominated solutions
Md Daily driven miles of an EV
µm and σm Mean and standard variation of
Em and β Energy consumption and battery capacity of each EV
Mdmax Maximum achievable driven distance
Ed Expected energy demand of EV
tar, tdep, and td Arrival time, departure time, and expected duration of parking, respectively
N1 and N2 Normally distributed random variables
µar
σar and σdep Standard deviation of the arrival time and the departure time
SOCd Desired state of charge
Chr Charging rate
SOCini Initial state of charge
SOCf Final state of charge
Keywords: electric vehicles, vehicle-to-grid, multi-objective optimization, economic dispatch, loss reduction
Citation: Hmingthanmawia D, Deb S, Datta S, Singh KR, Cali U and Ustun TS (2024) Multi-objective-based economic dispatch and loss reduction in the presence of electric vehicles considering different optimization techniques. Front. Energy Res. 12:1389822. doi: 10.3389/fenrg.2024.1389822
Received: 22 February 2024; Accepted: 27 September 2024;
Published: 16 October 2024.
Edited by:
Michael Carbajales-Dale, Clemson University, United StatesReviewed by:
Thang Trung Nguyen, Ton Duc Thang University, VietnamSrikant Misra, Gandhi Institute of Engineering and Technology University, India
Copyright © 2024 Hmingthanmawia, Deb, Datta, Singh, Cali and Ustun. This is an open-access article distributed under the terms of the Creative Commons Attribution License (CC BY). The use, distribution or reproduction in other forums is permitted, provided the original author(s) and the copyright owner(s) are credited and that the original publication in this journal is cited, in accordance with accepted academic practice. No use, distribution or reproduction is permitted which does not comply with these terms.
*Correspondence: Umit Cali, dW1pdC5jYWxpQG50bnUubm8=; Taha Selim Ustun, c2VsaW0udXN0dW5AYWlzdC5nby5qcA==; Subhasish Deb, c3ViaGFzaXNoZGViMzBAeWFob28uY28uaW4=
 David Hmingthanmawia
 Subhasish Deb
 Subir Datta
 Ksh. Robert Singh
 Umit Cali
 Taha Selim Ustun
