- State Grid Anshan Electric Power Supply Company, Anshan, China
The increasing integration of renewable energy sources such as wind and solar into the distribution grid introduces new complexities and instabilities to traditional electrical grids. This study tackles these challenges by optimizing the configurations of Modular Mobile Battery Energy Storage (MMBES) in urban distribution grids, particularly focusing on capacity-limited areas. Our method investigates five core attributes of energy storage configurations and develops a model capable of adapting to the uncertainties presented by extreme scenarios. This approach not only enhances the adaptability of energy storage systems but also equips decision-makers with proactive and flexible tools for decision-making in complex environments. Empirical evidence from the study shows that modular mobile energy storage significantly improves distribution grid performance by effectively managing the challenges posed by renewable integration. Furthermore, the research confirms that optimizing decision-makers’ cognitive parameters to align with subjective preferences ensures economic viability and enhances grid resilience. This study offers a new perspective and methodology for configuring energy storage, contributing to more flexible and reliable grid operations amidst widespread renewable integration.
1 Introduction
As urbanization continues to progress, the disparity between peak and off-peak electricity demand in urban core areas has gradually increased. Moreover, electricity consumption in these areas is approaching saturation, and the availability of land for further infrastructure expansion is becoming increasingly limited. The power industry, being a major consumer of energy (Wang et al., 2022a), has drawn extensive attention to the need for energy conservation and loss reduction. In the five segments of the power system, namely, generation, transmission, transformation, distribution, and consumption, distribution networks account for over 60% of the total power losses in the entire grid (Ying et al., 2017). Therefore, achieving energy conservation and loss reduction at the distribution level has become even more critical (Chen et al., 2022).
1.1 Challenges in traditional technical measures
Traditional technical measures for loss reduction in distribution networks primarily involve the replacement of high-energy-consuming distribution transformers, shortening supply radii, balancing three-phase loads, and implementing reactive power compensation. However, these methods are often associated with high investments, construction challenges, and long implementation periods (Zang, 2020).
1.2 Potential of flexible regulation resources
With the widespread adoption of flexible regulation resources in distribution networks, including energy storage systems (Jiang, 2021), there is a growing emphasis on uncovering the loss reduction potential of existing flexible regulation resources. Modular Mobile Battery Energy Storage (MMBES), representing a novel energy storage technology, possesses the flexibility of both time and space. It can be rapidly deployed at specified locations in response to demand, providing services such as emergency response (Zhang et al., 2020), uninterrupted operations (Li et al., 2022a), and peak load management (Li et al., 2022b; Sun et al., 2023) to distribution networks.
1.3 Current energy storage deployment scenarios
Currently, energy storage deployment in the power system can be broadly categorized into three scenarios:
1) Energy storage deployment on the generation side: In this scenario, energy storage is integrated on the generation side. Literature (Ma et al., 2016) has established a comprehensive economic benefit model for Battery Energy Storage Systems (BESS) participating in wind power ancillary services. It assesses the profitability of the BESS by calculating investment return rates, payback periods, and other economic indicators. Literature (Lü et al., 2015) focuses on the relationship between photovoltaic system and energy storage costs, electricity price models, load characteristics, and the economic feasibility of energy storage systems, aiming to find the optimal economic solution.
2) Energy storage deployment on the user side: This scenario involves the installation of energy storage systems at the user’s premises. Literature (Nayak and Nayak, 2017) considers only the peak shaving benefits of users after installing energy storage, while literature (Narimani et al., 2017) concentrates on the economic viability of demand-side management. Neither of these studies simultaneously considers both aspects of energy storage benefits in their optimization research.
3) Energy storage deployment on the grid side: In this scenario, energy storage is deployed on the grid side. Literature (Chaspierre et al., 2022) and others have developed dynamic equivalent models that respond to reactive power as much as possible. These models are applied to Battery Energy Storage Systems (BESS) in the main substations of distribution networks. They compensate for the inevitable inaccuracies in fluctuating energy sources, ensuring higher precision operation. Literature (Alasali et al., 2022) and others have designed and developed optimal integration of photovoltaic and Energy Storage Systems (ESS) in Active Distribution Networks (ADN). They use optimization methods like the Golden Ratio Optimization Method (GROM) and Particle Swarm Optimization (PSO) algorithms to find the best configurations, achieving 100% photovoltaic energy consumption. Literature (Mokryani, 2022), in considering the planning, design, and operation of the best stations in the distribution network, highlights the contributions of BESS in providing flexibility, enhancing energy security, and supporting Variable Generation (VG) integration.
1.4 Limitations of fixed energy storage systems
In current energy storage systems, a conventional strategy involves deploying these systems at fixed locations, typically at strategically selected sites such as power generation stations, industrial facilities, or substations near residential areas. This deployment strategy is primarily designed based on the geographical location of facilities and the stability of grid demands, enabling efficient energy transmission from storage sites to demand locations. Fixed energy storage systems are advantageous in providing continuous and stable energy output, particularly suitable for grid environments with high predictability and relatively fixed demands.
However, this fixed deployment approach exhibits several significant limitations. First, the flexibility of fixed systems is limited; they cannot rapidly adjust to real-time changes in grid demands. In situations where there are sudden changes in load or emergencies (such as disruptions caused by natural disasters), fixed systems are unable to quickly reposition or adjust their locations to more effectively support specific areas of the grid. Additionally, the installation and maintenance costs of fixed energy storage systems are high, especially in geographically remote or inaccessible areas. This not only increases the economic burden of initial investments but also may affect the long-term sustainability and efficiency of the system. Lastly, fixed systems often require close integration with existing grid infrastructure, which limits their application potential in emerging or slowly upgrading grids where infrastructure may not support efficient energy distribution and management.
1.5 Advantages of mobile energy storage systems
To further enhance the flexibility of energy storage applications, both domestic and international research has initiated preliminary studies on mobile energy storage. Literature (Lei et al., 2016), for instance, introduced a two-stage scheduling framework for mobile energy storage based on pre-positioning and real-time allocation. This framework enhances resilience by improving the response to unexpected events. Literature (Lei et al., 2019) proposed a mixed-integer programming model to address challenges related to mobile energy storage scheduling and the disparate time scales of distribution system operation, as well as the coupling of road networks and power grids. By optimizing the dynamic scheduling of mobile power sources, this approach enhances the resilience of the distribution network. To encapsulate, the significance of portable energy storage systems stems from their capacity to manage unforeseen circumstances, including traffic congestion and catastrophic events, alongside securing diverse advantages via adaptable deployments. Hence, the unpredictability of such events and the inclination towards decision-making that accounts for multiple benefits are key elements that affect the setup of energy storage solutions.
1.6 The main breakthroughs of this research
This study introduces a refined approach for arranging Modular Mobile Battery Energy Storage (MMBES) within distribution networks, taking into account both overall utility and individual perception. The primary breakthroughs of this research encompass:
1) From the viewpoint of the electric utility company, the research suggests a method for the integrated use of modular energy storage across three situations: standard operation of the distribution network, addressing equipment malfunctions, and managing emergency conditions. In detail, MMBES is utilized for peak shaving in normal operations, providing energy to adaptable loads upon unexpected equipment failures, and allocating power to essential loads in crisis circumstances. This strategy not only improves the comprehensive utility of the energy storage system but also augments the adaptability of the distribution network.
2) To address the varied advantages derived from these three scenarios, alongside the unpredictability linked to extreme events and the individual biases of decision-makers towards these benefits, the paper incorporates prospect theory. This introduces an optimization framework for configuring MMBES, aimed at maximizing the expected value of the wide-ranging benefits (Meng, 2019; Mei et al., 2020).
3) The paper also presents calculation models and solution methods for assessing the prospect values related to reducing distribution losses, improving reliability, delaying upgrade and renovation, reducing outage losses in extreme scenarios, and configuring costs. Notably, the prospect of delaying grid upgrade and renovation is computed from a probabilistic perspective using credible capacity, providing a more accurate measure of the capacity substitution value of energy storage (Qi et al., 2023).
In summary, this research introduces an optimized configuration method for MMBES in distribution networks operated by electric utility companies. It considers comprehensive utility and subjective cognition, addressing various scenarios and benefits. Additionally, it incorporates prospect theory to account for decision-makers’ subjective preferences and handles the uncertainty associated with extreme events. Innovative calculation methods for prospect values related to network reliability and upgrade delay are also presented, enhancing our understanding of energy storage deployment in distribution systems.
2 Analysis of configuration strategies and issues for MMBES
The Growing Dependence on Electricity in Modern Society and the Escalating Frequency of Extreme Weather Events. In contemporary society, there is an ever-increasing reliance on electricity, coinciding with a yearly rise in the occurrence of extreme weather events. Presently, the electricity system relies on a combination of redundant network structures, user-owned backup power sources, and emergency repair measures to address extreme disasters. Despite the adaptability of the network and the dependability of user-managed backup energy sources, there is no assurance of a continuous power supply to essential users. Nevertheless, the adaptability of the network and the dependability of consumer-owned backup power solutions cannot ensure a constant power supply to essential users. While deploying a larger number of backup power sources can ensure reliability, it often comes at the expense of cost-effectiveness. To address the challenge of enhancing the resilience of distribution networks, recent scholars from both domestic and international contexts have proposed utilizing distributed resources for on-site dispatch during interruptions in power supply from the larger electrical grid to provide emergency power (Li et al., 2023; Liu et al., 2023). However, due to the scale and distribution characteristics of distributed resources, they are currently unable to serve as a significant resource for ensuring resilience.
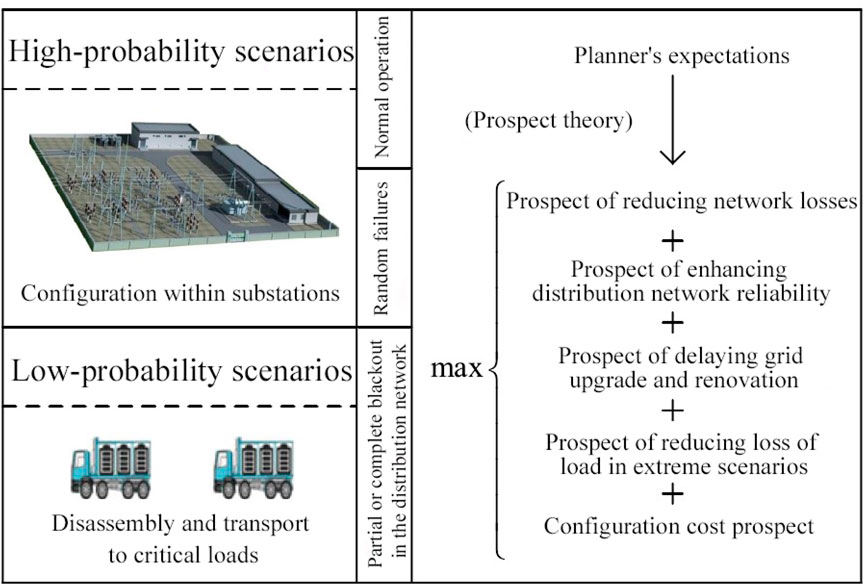
MMBES is composed of several independently powered energy storage modules, each consisting of battery units arranged in series and parallel and integrated into containers. These modules provide multiple electrical interfaces and possess the capability for seamless integration with the electrical grid. During normal system operation and in the event of random equipment failures, the energy storage modules are configured in parallel combinations at substations, yielding benefits such as reduced network losses, improved distribution network reliability, and delayed grid upgrade requirements. In scenarios where the power system faces localized disruptions caused by events like typhoons, earthquakes, or intentional sabotage, leading to extended periods of inactivity, MMBES units can be disassembled and relocated to offer temporary power assistance to key regions or users. This enhances distribution network resilience without the need for additional investments.
When configuring MMBES, investors typically exhibit subjective preferences in assessing its various benefits and configuration costs. These preferences include considerations such as the expectation of reducing network losses and generating profit under normal conditions
3 An MMBES optimization configuration model incorporating subjective cognition
To comprehensively evaluate the effectiveness of the Modular Mobile Battery Energy Storage (MMBES) configuration, the following evaluation parameters were utilized:
1. Network Loss Reduction
Definition: Represents the reduction in electrical energy losses within the distribution network achieved by configuring the MMBES. Calculation: The expected reduction in network losses is calculated based on the MMBES’s charging and discharging capacities and the state-of-charge (SOC) distribution (see Equations 10–12).
2. Reliability Improvement
Definition: Evaluates the improvement in system reliability before and after configuring the MMBES. Calculation: The initial reliability level is calculated, followed by the establishment of a reliability model after MMBES configuration and the calculation of the expected improvement in reliability (see Equations 16–21).
3. Deferral Value
Definition: Measures the time period that MMBES can delay upgrades and renovations of the distribution network. Calculation: Based on the reliability model, the dependable capacity of MMBES is calculated, which in turn is used to determine the value of deferring upgrades (see Equations 22–25).
Diverging from the classic anticipated utility model, the framework of prospect theory indicates that decision-makers do not exhibit total rational behavior. The assessment of gains and losses, together with the probabilities linked to the outcomes of decisions, is shaped by the benchmarks established by the decision-makers themselves. The prospect value,
In this context,
The electric utility company’s involvement in the electricity market through the deployment of energy storage on the grid side is considered in this study. Five attributes related to energy storage are identified: distribution and transmission losses, power supply reliability, grid expansion investments, blackout losses in extreme scenarios, and the cost of configuring MMBES. This document utilizes prospect theory to address planners’ personal inclinations and the unpredictability linked to critical situations. The objective is to maximize the integrated prospect value over the operating cycle of MMBES, as formulated in Equations 2–5 below. In these equations, the dimensional units of each attribute are converted to “currency” to eliminate the influence of different units on the integrated prospect value. The attributes are also discounted to a common present value based on the initial construction period, using the net present value method (Zhang et al., 2023).
Where:
In the constraint conditions, Equation 3 represents the system’s active power balance constraint:
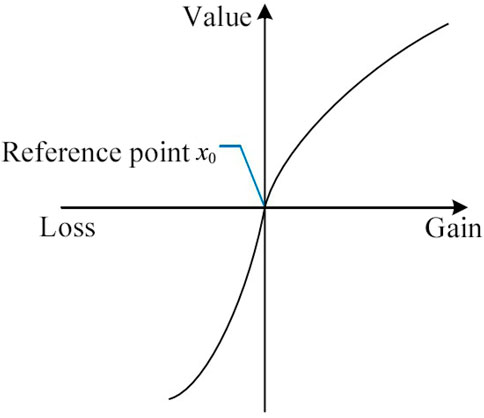
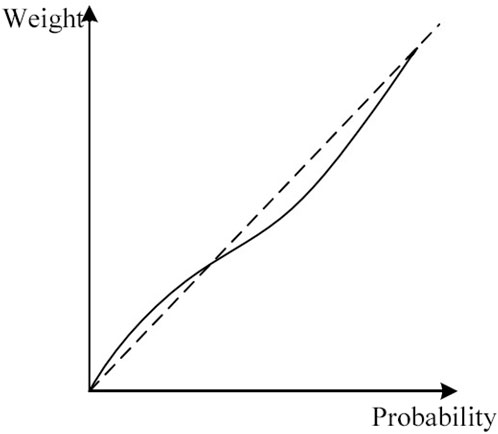
The subjective cognition of decision-makers follows certain patterns. When attributes are considered gains relative to the reference point, decision-makers exhibit risk aversion, and their value function is convex. Conversely, when attributes are perceived as losses relative to the reference point, decision-makers tend to be risk-seeking, and their value function is concave. Furthermore, equal magnitudes of losses and gains result in more significant distress than pleasure for decision-makers, as depicted in Figure 2. Decision weights represent the subjective weighting of uncertain event outcomes with probabilities denoted as “p.” For small probabilities, decision-makers often attribute weights that are higher than the actual probability, whereas for large probabilities, the tendency is to assign weights that are lower than the actual probability, as depicted in Figure 3.
1) The exact formulation for the evaluation curve is specified as follows:
① When the attribute indicates a “gain”
② When the attribute represents ‘loss’
In this context,
2) The comprehensive equation for the weighting function is detailed in the following manner:
① Whenever the characteristic represents a “gain”
② Whenever the characteristic indicates a “loss”
Here: Parameters
The uncertainty within the scenario presents itself through two distinct dimensions. Firstly, there is uncertainty in the development of distributed power sources and loads. Secondly, there is uncertainty in the occurrence probability of extreme scenarios and outage durations. This paper primarily focuses on the latter aspect. Apart from the losses stemming from outages in extreme scenarios, all other characteristics, when compared to a reference point, are depicted as probabilities of “gain” or “loss” being either 1 or 0. Consequently, the weighting function
The models for various prospective values are as follows.
3.1 Prospective model for distribution network loss reduction based on power difference control strategy
The presence of MMBES (Modified Multi-Bus Electrical System) within the substation affects the losses of the upstream power grid and the transformers within the substation. When the operating strategy is fixed and errors are not considered, the reduction in distribution network losses is uniquely correlated with the decision variables. Therefore, the value of distribution network loss reduction, denoted as
In the equation:
In the equation provided:
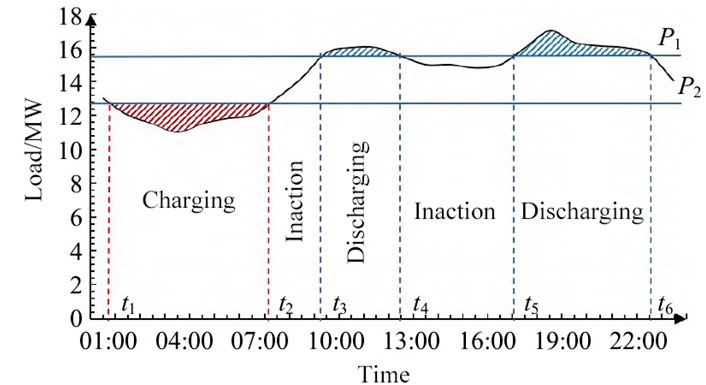
The effectiveness of distribution network loss reduction is closely related to the operational strategy of MMBES (Modified Multi-Bus Electrical System). Appropriate management of energy storage systems can equalize the flow of electricity in the primary distribution lines and substation transformers across peak and low-demand periods, thereby diminishing losses in the network. In this paper, a peak shaving and valley filling power difference control strategy is employed during normal grid operation, and its performance is illustrated in Figure 4. MMBES undergoes a complete charge-discharge cycle daily, while adhering to Equations 13–15 as the foundation. The start and stop times
MMBES Operation Satisfying Equations 13–15:
In the equation:
3.2 Prospective model for enhancing distribution network reliability in the presence of random equipment failures
In the event of a malfunction on the high-voltage side of the substation or within the substation transformer itself, MMBES can supply energy to the loads within the same island throughout the fault rectification period. This capability significantly boosts the dependability of the distribution system. The dependability traits of the distribution grid are constant, and the advantage of enhancing supply dependability, denoted by
In the equation:
This research utilizes the metric known as Expected Energy Not Supplied (EENS) to assess the dependability of the distribution grid.
In the equation:
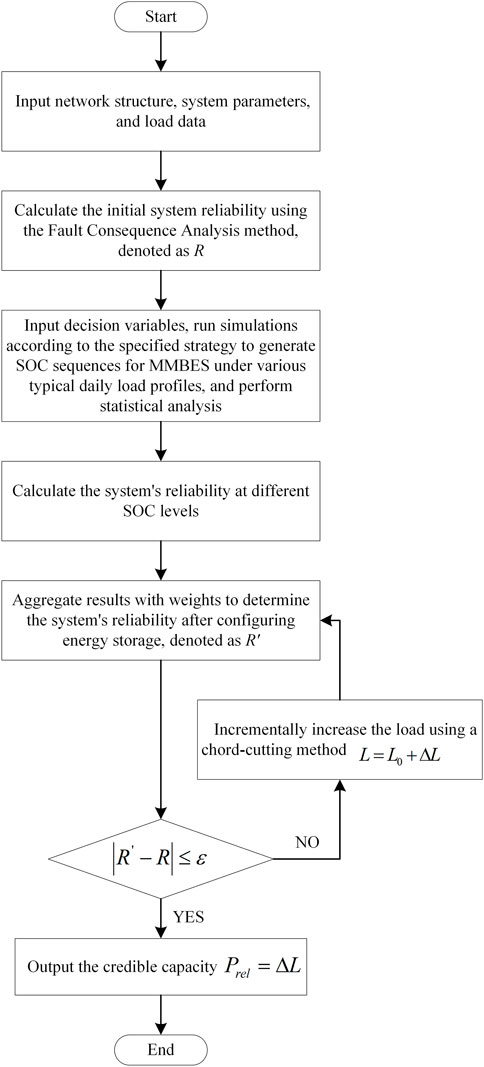
Reliability assessment methods can primarily be classified into two major categories: analytical methods and simulation methods. Battery energy storage exhibits temporal characteristics, but Monte Carlo sampling simulations are time-consuming for optimization problems. Therefore, in this paper, we employ the analytical approach known as Fault Consequence Analysis to perform the calculations. The residual energy capacity of MMBES is contingent upon real-world operating conditions and has a direct impact on the outcomes of system failures. Therefore, conducting a statistical analysis of the State of Charge (SOC) in line with the operational strategy is crucial. This analysis enables the determination of the probabilities linked to various SOC levels, which, in turn, facilitates the calculation of the distribution network’s reliability at each SOC level. The comprehensive reliability assessment is achieved by compiling these findings using suitable weighting methods.
The specific formula for calculating EENS is as follows:
In the equation,
3.3 Prospective model for delaying power grid upgrades based on credible capacity
The traditional assessment method for delaying power grid upgrades is based on measuring the number of years the expansion can be postponed by evaluating the maximum load reduction before and after energy storage configuration. Despite the potential benefits, the intrinsic likelihood of failures within energy storage systems means they cannot ensure uninterrupted adherence to the
In the equation:
In this research, following the concept of matching reliability, the credible capacity of MMBES is evaluated using the Effective Load Carrying Capability (ELCC) indicator. The exact correlation is outlined below:
Within the formula,
3.4 Prospective model for reducing power outage losses in extreme scenarios
In situations where the electrical power system encounters severe weather phenomena or widespread power interruptions due to military operations, the continuous provision of power to vital loads is essential. MMBES can be divided into various autonomous supply entities depending on the specific nature of the fault, with a focus on guaranteeing power delivery to essential loads should backup power sources fail. If there is surplus capacity, it can then be used to safeguard some of the secondary loads that lack backup support. The prioritization for protection ought to be thoroughly evaluated across three critical dimensions: the safety of human life, the security of the nation, and the potential for economic losses.
Diminishing losses from power outages in critical situations correlates with the likelihood and length of these scenario events. Since both of these factors are uncertain, this attribute follows a certain probability distribution rather than a deterministic value. Its value function should be improved based on Equations 6, 7, as shown specifically in Equation 26. In the weight functions, Equations 8, 9, the probability, denoted as
Within the formulas:
Integrating Equations 8, 9 together with Equations 26 through 28, the prospective model for reducing power outage losses in extreme scenarios, denoted as
In the equation:
In the equation:
3.5 Model for assessing entire lifecycle costs including recycling and treatment processes
The full lifecycle cost of configuring MMBES falls under expenditures. When the cost exceeds a reference value, decision-makers perceive it as a loss, and when it is less than the reference value, they perceive it as a gain. The specific expression for the prospective value
In the equation:
The full lifecycle cost consists of three parts: the initial investment and construction cost
The upfront investment and construction expenses encompass the energy costs for a specified battery capacity and the costs related to energy conversion, monitoring, and management.
In the equation:
Operational and maintenance costs include fixed charges based on rated power and variable costs related to energy losses, stemming from the energy storage system’s processes of charging and releasing energy.
In the equation:
The post-disposal recycling and treatment cost is the difference between the production cost for decomposing and handling the discarded batteries and the revenue obtained from recovering extracted metal materials.
In the equation:
4 Model solving
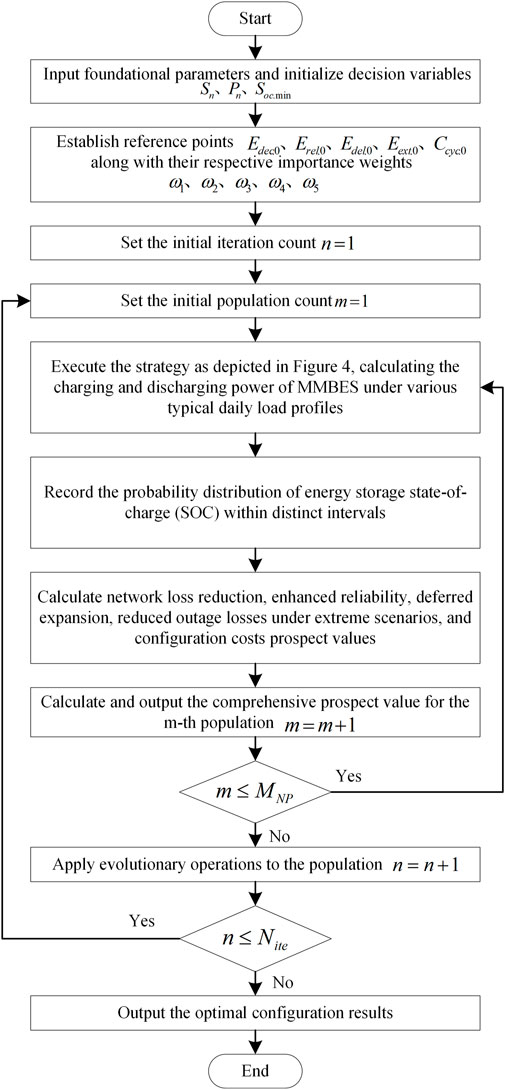
Due to the absence of uniform specifications for energy storage batteries, this study approaches decision variables as continuous entities. It utilizes a differential evolution algorithm to address the nonlinear optimization model presented. The methodology is depicted in Figure 6, with the detailed procedures outlined below:
1) Enter the fundamental parameters and initiate the decision variables
2) Establish reference points for each attribute:
3) Initialize the iteration counter,
4) Initialize the population count,
5) Execute the approach depicted in Figure 4 by determining the charging and discharging capacity of MMBES for different standard daily load patterns and constructing the likelihood distribution of the State-of-Charge (SOC) for the energy storage system over multiple periods.
6) Compute the prospective network loss reduction according to Equations 10–12.
7) Assess the system’s reliability before configuring MMBES using Equations 16–21, then establish a model for network reliability after MMBES configuration and calculate the prospective improvement in network reliability.
8) Based on the reliability model from step 7, calculate the dependable capacity of MMBES using Equation 25, and subsequently, compute the prospective value of deferring grid upgrade and retrofitting based on Equations 22–24.
9) Compute the anticipated residual energy of MMBES using the outcomes from step 5, and assess the prospective value of diminishing outage losses in severe conditions through Equations 29–31.
10) Compute the cost prospect value based on Equations 32–36.
11) Calculate and output the comprehensive prospect value based on Equations 2–5, considering the results obtained in steps 6, 7, 8, 9, and 10.
12) If
13) If
Here is the pseudocode for the algorithm: Optimize MMBES Configuration Using Differential Evolution.
Input: Fundamental parameters, population size
Initialize: Decision variables
Procedure: 1. While
End Procedure.
5 Scenario analysis
5.1 Scenario specifications
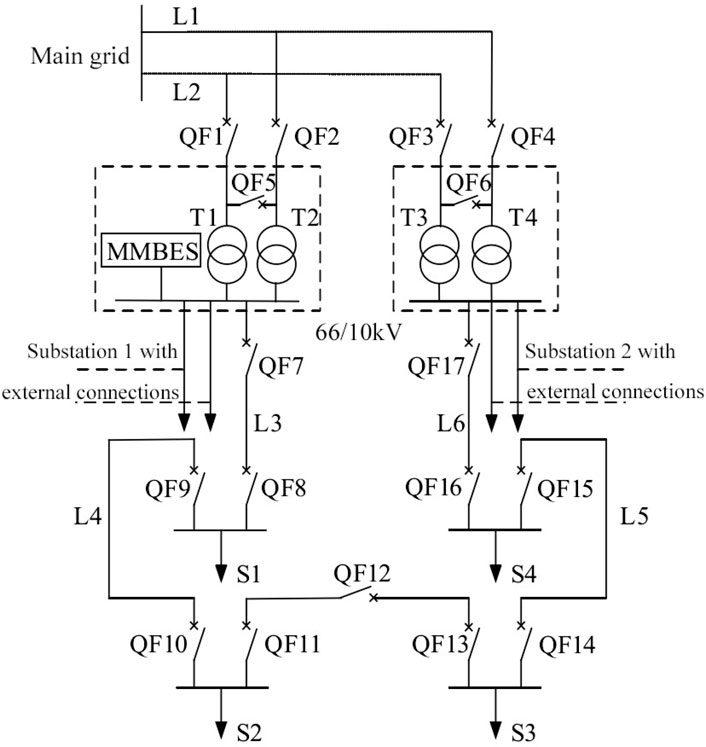
The paper examines a Class A distribution network in City A, which receives its power from a 220 kV substation connected in a T-shaped configuration to a 66 kV transformer station. The 10 kV output from the 66 kV transformer station is set up in a looped arrangement, as illustrated in Figure 7.
The distribution ratio between substations 1 and 2 stands at 0.55. The schematic displays three outgoing lines, with the main trunk lines designed similarly to the depicted structure. All circuit breakers, with the exceptions of QF5, QF6, and QF12, remain in a normally closed position. MMBES is deployed within substation 1, influencing the electricity flow in the 66 kV and higher voltage networks. Nevertheless, given the urban power grid’s complexity, this study limits its focus to the sectors most impacted, specifically, the alterations in losses for L1, L2, T1, and T2. In the event of a regional network failure, MMBES is activated to segment and reroute power, aiming to reestablish service to vital loads, with S1 and S3 identified as critical loads requiring protection.
1) Distribution system structure parameters: Line L1 and L2 have a length of 5 km, while L3, L4, L5, and L6 are each 3.5 km long. The unit length resistance and reactance are both 0.17
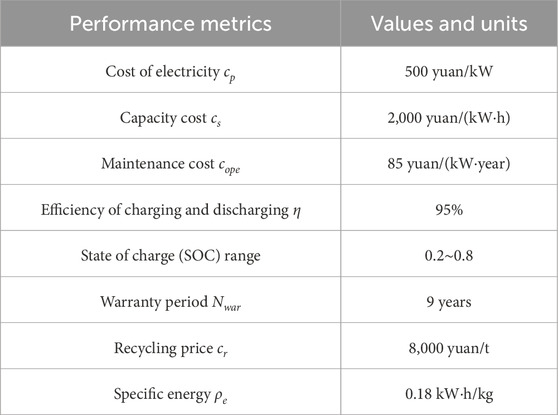
2) MMBES related parameters: MMBES, using lithium-ion batteries as an example, possesses advantages such as high energy density, low self-discharge rate, long cycle life, and fast charge-discharge capability. This battery type is among the most prevalent in energy storage applications. Key parameters are detailed in Table 1.
3) Load details: Figure 4 illustrates the typical daily load pattern for transformer station 1, including data for various load points as shown in Table 2. An annual load increase of 1.5% is assumed, and the power factor is kept constant at 0.9.
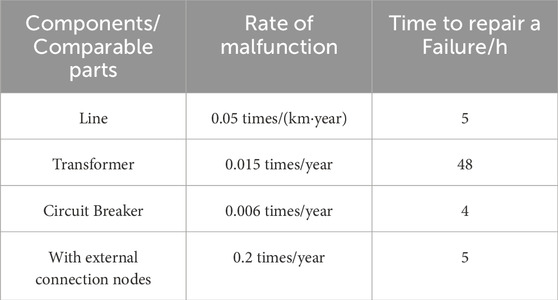
4) Reliability metrics for components: See Table 3.
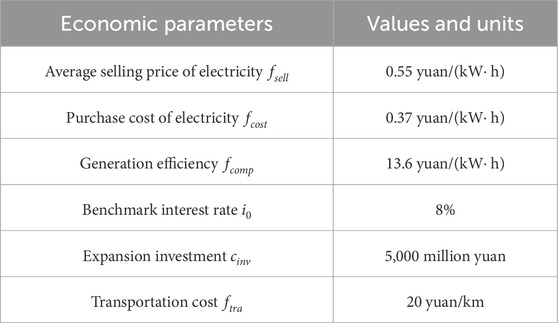
5) Financial parameters: Consult Table 4.
5.2 MMBES optimal configuration simulation analysis
The population size for the Differential Evolution Algorithm, MNP, is set to 100, and other parameters are referenced from (Liu et al., 2021). The parameters related to prospect theory in the model:
Given that all attributes are deemed equally significant, we set
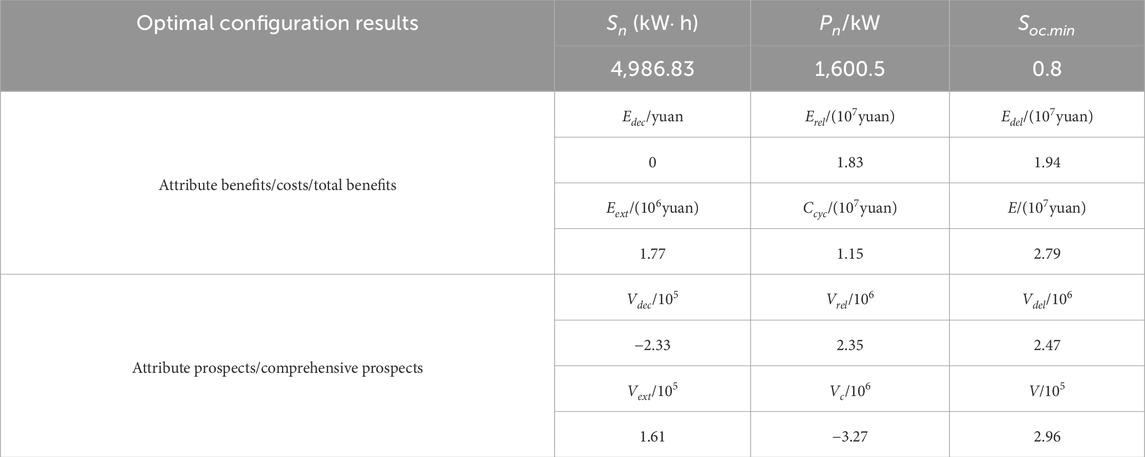
Based on the parameters mentioned above, conducting simulation calculations using the Differential Evolution Algorithm converges in 200 iterations, with a maximum iteration limit set at 300 iterations. The optimization configuration results for MMBES, along with the benefits/costs and prospects for each attribute, total benefits, and comprehensive prospects, can be found in Table 6.
The data extracted from the table suggests that the optimal configuration for MMBES features a storage capacity of 4986.83 kW-hours (kW
The potential benefits of postponing grid upgrades and renovations are the most significant, particularly when considering MMBES with a substantial capacity of 3,330 kW. In line with the current rate of load growth, this delay can extend the need for expansion by a remarkable 12 years, aligning with the original configuration intent. Following closely is the potential value associated with enhancing the reliability of the distribution network. By doing so, it is possible to reduce the annual electricity deficit by a substantial 2,162.29 kW
When optimizing with the objective of maximizing net profit, the MMBES configuration results are as follows:
5.3 The impact analysis of system adequacy on the optimization configuration results of energy storage
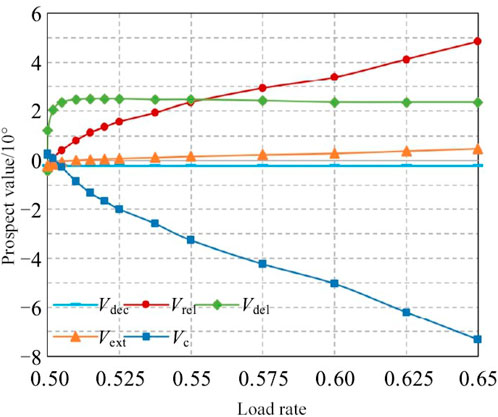
Exploring the substantial advantages of postponing grid upgrades while improving reliability, this research delves deeper into the consequences of system sufficiency on the outcomes of the configuration analysis. The substation load rate is increased from 0.50 in a geometric progression to 0.65, and the changes in the prospects of various attributes are shown in Figure 8.
As network adequacy decreases, the system’s demand for MMBES capacity
The prospect value
5.4 Analyzing the influence of attribute importance and cognitive parameters on the configuration outcomes
Recognizing the persistent high level of network loss rate at 6.28% within the distribution system, efforts to enhance this metric entail elevating the significance of the loss reduction attribute
If the emphasis is on enhancing the resilience of the distribution network and the importance of reducing losses in extreme scenarios
The decision-maker’s subjective expectations are not constant. When cognitive parameters change, to study their impact on the optimization results, the expected cost expenditure
We have conducted a comparative analysis between our proposed scheme for optimizing the configuration of Modular Mobile Battery Energy Storage (MMBES) and existing systems, focusing on several key factors. Our analysis evaluates the performance and effectiveness of our approach in the context of renewable energy integration and grid stability.
5.4.1 Economic benefits
Our proposed scheme significantly boosts the economic benefits of integrating MMBES into distribution grids. By fine-tuning the configuration of MMBES, we demonstrate a notable improvement in the net profit compared to existing systems. For instance, when aiming to maximize net profit, the configuration results for capacity and power are 9,043.75 kW
5.4.2 Reliability Improvement
The reliability prospect value for enhancing distribution network reliability increases monotonically as the adequacy of the system decreases. This indicates that our proposed scheme enhances the reliability of the distribution grid, especially in scenarios where the system adequacy is low.
5.4.3 Cost-effectiveness
We analyze the cost prospect value, which demonstrates a monotonic decrease as the adequacy of the system decreases. This suggests that our proposed scheme is more cost-effective compared to existing systems, especially when the system adequacy is lower.
5.4.4 System adequacy impact
As the substation load rate increases, the system’s demand for MMBES capacity and power also increases. The optimization configuration results for Sn and Pn increase monotonically from 0 to 11,019.44 kW
5.4.5 Extreme scenario consideration
Our scheme takes into account the reduction of outage losses in extreme scenarios, which is reflected in the increasing trend of the prospect value. This shows that our approach enhances the resilience of the distribution grid in the face of severe weather events or other extreme conditions.
5.4.6 Comprehensive prospect value
The comprehensive prospect value initially increases sharply and then gradually declines as the system adequacy decreases. This pattern indicates that our scheme optimally balances the trade-offs between cost, reliability, and system adequacy.
6 Conclusion
This phenomenon arises from the fact that when there is an increase in the psychological anticipation of investment, it can shift the prospect value of investment costs from negative to positive. Considering the decision-maker’s tendency to favor risk-averse strategies regarding losses rather than gains, decreasing costs, with the expectation of other attributes remaining unchanged, leads to enhanced capacity and power. The effectiveness of the model and methodology is confirmed via a case study focusing on a city’s distribution grid. The results of the case study indicate the following: 1) Considering the benefits of extreme scenarios, mobile energy storage can achieve additional benefits in terms of resilience without significantly increasing costs; 2) When greater emphasis is placed on a specific profit/cost attribute, increasing the
This study conducted a case study on a specific city’s distributed grid, validating the effectiveness of the model and methodology employed, and explored the potential of mobile energy storage in enhancing grid resilience and reducing network losses. Although our case study provided some positive insights, its limitations also indicate necessary directions for future research.
Firstly, our research was primarily based on a specific city’s grid, and its applicability may be affected by differences in grid scale or technical conditions. Additionally, the setting of key parameters such as
For future studies, we suggest expanding the geographical scope and network types of case studies to validate the model’s broad applicability. Further research should consider how to optimize the setting of key parameters to improve the model’s adaptability and flexibility across different grid environments. Additionally, we plan to introduce opportunity-constrained planning to address the uncertainties in grid demand and energy storage system performance in extreme scenarios. By optimizing the configuration of energy storage, we aim to further enhance the system’s resilience and reliability.
We will also consider user needs and comfort, incorporating user behavior and demand patterns into future research to adjust the scheduling strategy of energy storage equipment to meet users’ electricity demands and comfort requirements. Through in-depth analysis and simulation of different user groups’ electricity usage behaviors, we anticipate that technological innovations will achieve more refined energy management.
Through these improvements, we hope to further demonstrate the potential of mobile energy storage technology and its contributions to grid systems, while promoting further research and optimization in the field.
Data availability statement
The original contributions presented in the study are included in the article/supplementary material, further inquiries can be directed to the corresponding author.
Author contributions
DF: Writing–original draft, Software, Methodology, Conceptualization. BL: Writing–review and editing, Project administration, Formal Analysis, Conceptualization. LY: Writing–review and editing, Validation, Data curation. XS: Writing–review and editing, Validation, Formal Analysis. HC: Writing–review and editing, Formal Analysis.
Funding
The author(s) declare that financial support was received for the research, authorship, and/or publication of this article. This paper is supported by Science and technology project support of State Grid Liaoning Electric Power Co., Ltd., 2023YF-18 Research on Dynamic Reconstruction and Mobile Energy Storage Collaborative Optimization Methods for Distribution Networks in the Context of “Dual Carbon.”
Conflict of interest
Authors DF, BL, LY, XS, and HC were employed by State Grid Anshan Electric Power Supply Company.
The authors declare that this study received funding from State Grid Liaoning Electric Power Co., Ltd. The funder had the following involvement in the study: design, data collection and analysis.
Publisher’s note
All claims expressed in this article are solely those of the authors and do not necessarily represent those of their affiliated organizations, or those of the publisher, the editors and the reviewers. Any product that may be evaluated in this article, or claim that may be made by its manufacturer, is not guaranteed or endorsed by the publisher.
References
Alasali, F., Mohammad, S., Semrin, A., Khaled, N., Naser, E., William, H., et al. (2022). Optimal controllers and configurations of 100 systems for a microgrid: the case study of a small town in Jordan. Sustainability 14, 8124.
Chaspierre, G., Panciatici, P., and Cutsem, T. V. (2022). Control of a battery energy storage system to compensate for adn equivalents inaccuracies. Electr. Power Syst. Res. 213, 108455. doi:10.1016/j.epsr.2022.108455
Chen, J., Chen, Y., Jiao, H., Cheng, L., Tan, J., Ma, Z., et al. (2022). Research and application of time-segmented line loss diagnosis method in distribution network based on multi-source data fusion. Electr. Power Inf. Commun. Technol. 20, 50–57. doi:10.16543/j.2095-641x.electric.power.ict.2022.07.007
Jiang, J.-Q. (2021). Research on energy saving and loss reduction in distribution networks considering access of source, storage, and charging.
Lei, S., Chen, C., Hui, Z., and Hou, Y. (2019). Routing and scheduling of mobile power sources for distribution system resilience enhancement. IEEE Trans. Smart Grid 10, 5650–5662. doi:10.1109/tsg.2018.2889347
Lei, S., Wang, J., Chen, C., Yunhe, H., et al. (2016). Mobile emergency generator pre-positioning and real-time allocation for resilient response to natural disasters. IEEE Trans. Smart Grid 9, 2030–2041. doi:10.1109/TSG.2016.2605692
Li, J., Fang, Z., Li, Y., and Zeng, W. (2022a). A review of collaborative control of mobile energy storage system clusters for emergency applications. Electr. Power Constr. 43, 75–82.
Li, J., Wang, D., Fan, H., Yang, D., Fang, R., and Sang, Z. (2022b). Hierarchical optimization control method for active distribution networks with mobile energy storage. Automation Electr. Power Syst. 46, 189–198.
Li, M., Yang, Q., Li, G., Liu, D., Ji, C., Bie, Z., et al. (2023). Two-stage power restoration strategy for resilient distribution networks based on multiple distributed resources coordination under typhoon scenarios. High. Volt. Eng., 1–16. Online published on 2023-12-28. doi:10.13336/j.1003-6520.hve.20231091
Liu, F., Zhang, H., Yang, X., Cui, Y., and Xu, Y. (2023). Multi-timescale rolling optimization strategy for rapid emergency recovery of distribution networks supported by large-scale heterogeneous distributed resources. Power Syst. Technol. 47, 3311–3326. doi:10.13335/j.1000-3673.pst.2022.1054
Liu, W., Yang, M., Wang, J., and Teng, Y. (2021). Optimized configuration of energy storage in incremental distribution systems based on intelligent generation of operational strategies. Proc. CSEE Chin. Soc. Electr. Eng. 41, 3317–3329. doi:10.13334/j.0258-8013.pcsee.200655
Lü, S.-H., Cai, S.-X., and Wang, S.-X. (2015). Economic assessment and development suggestions for distributed photovoltaic-energy storage systems. Electr. Power 48, 139–144.
Ma, M., Yuan, T., Chen, G., Pan, G., Peng, S., Zhang, Z., et al. (2016). Comprehensive economic benefit analysis of energy storage participating in wind power auxiliary services. Power Syst. Technol. 40, 3362–3367.
Mei, W., Li, M., Zhang, Y., and Yang, Y. (2020). Multi-energy microgrid benefit evaluation based on prospect theory and vikor method. Power Syst. Technol. 37, 71–77. doi:10.19421/j.cnki.1006-6357.2020.03.012
Meng, J. (2019). Multi-objective optimal configuration of distributed power sources in distribution networks.
Mokryani, G. (2022). Energy storage systems in future distribution networks: operation, and control Available online.
Narimani, M. R., Asghari, B., and Sharma, R. (2017). Energy storage control methods for demand charge reduction and pv utilization improvement.
National Energy Administration (2018). Electric power industry emergency capacity building action plan (2018-2020). Henan Sci. Technol. 6.
Nayak, C. K., and Nayak, M. R. (2017). Optimal design of battery energy storage system for peak load shaving and time of use pricing.
Qi, N., Cheng, L., and Liu, F. (2023). Generalized energy storage credible capacity assessment considering decision dependency uncertainty. Power Syst. Technol. 47, 4916–4930. doi:10.13335/j.1000-3673.pst.2023.1328
Sha, Y.-H. (2023). Evaluation of power grid project management value based on interval preference and prospect theory. Electr. Power Inf. Commun. Technol. 21, 67–73. doi:10.16543/j.2095-641x.electric.power.ict.2023.03.10
Sun, G., Guo, F., Yu, H., He, S., Ke, H., Lin, H., et al. (2023). Mobile energy storage scheduling based on firefly and particle swarm hybrid optimization algorithm. Smart Power 51, 8–15.
Wang, L., Zhang, J., Wang, X., Chen, X., Song, X., Zhou, L., et al. (2022a). Research on the peak path of co2 emissions in China’s power industry. Environ. Sci. Res. 35, 329–338. doi:10.13198/j.issn.1001-6929.2021.11.24
Wang, Y., Ye, J., Xue, H., and Mi, Y. (2022b). Optimized control of cascaded utilization battery energy storage systems based on improved rainflow counting method. Automation Electr. Power Syst. 46, 39–49. doi:10.13198/j.issn.1001-6929.2021.11.24
Ying, L., Min, L., Deng, L., and Sun, LJ. (2017). A review on loss reduction in distribution networks. Power Syst. Prot. Control 45, 162–169.
Zang, H.-Y. (2020). Research on loss reduction measures optimization in distribution networks with distributed power sources based on load forecasting and Monte Carlo simulation.
Zhang, L., Huang, R., Wang, Z., Tang, W., and Chen, Y. (2020). Optimization strategy for mobile energy storage allocation in distribution networks considering balance between resilience and economy. Automation Electr. Power Syst. 44, 23–31.
Zhang, Y., He, H., Huang, J., and Li, H. (2023). Economic benefit analysis of rail transit photovoltaic power generation and energy storage integration projects based on levelized cost of electricity net present value model. Urban Rail Transit Res. 26, 103–108+115. doi:10.16037/j.1007-869x.2023.10.018
Keywords: mobile energy storage, distribution grid, prospect model, scenario uncertainty, adaptive decision-making, grid resilience
Citation: Fu D, Li B, Yin L, Sun X and Cui H (2024) Research on optimal configuration of mobile energy storage in distribution networks considering various energy utilization efficiencies. Front. Energy Res. 12:1388681. doi: 10.3389/fenrg.2024.1388681
Received: 20 February 2024; Accepted: 27 September 2024;
Published: 16 October 2024.
Edited by:
Fernando Moreira, Portucalense University, PortugalReviewed by:
Umar Islam, Iqra National University, PakistanZening Li, Taiyuan University of Technology, China
Copyright © 2024 Fu, Li, Yin, Sun and Cui. This is an open-access article distributed under the terms of the Creative Commons Attribution License (CC BY). The use, distribution or reproduction in other forums is permitted, provided the original author(s) and the copyright owner(s) are credited and that the original publication in this journal is cited, in accordance with accepted academic practice. No use, distribution or reproduction is permitted which does not comply with these terms.
*Correspondence: Bin Li, bGliaW5fMjAyMzExMUAxNjMuY29t
 Dong Fu
 Bin Li