 Long Zhang1
 Wen Xiao
- 1Heyuan Power Supply Bureau of Guangdong Electric Power Grid Co., Ltd., Heyuan, Guangdong Province, China
- 2Electric Power Research Institute of Guangdong Power Grid Co., Ltd., Heyuan, Guangdong Province, China
- 3College of Electrical Engineering, Sichuan University, Chengdu, Sichuan Province, China
Shunt capacitor banks are essential for reactive power compensation, ensuring voltage stability, and reducing system losses. These banks consist of multiple units with components in series and parallel. A few component failures do not immediately affect the safe operation of the capacitor bank, but component breakdown can lead to voltage redistribution. Under combined factors such as system overvoltage and equipment aging, and others can trigger an avalanche effect causing capacitor breakdown, resulting in significant safety accident risks. Practical operation experience shows that partial component breakdown generates many transient disturbance signals. Quantitative analysis of these signals can detect capacitor bank anomalies early. This paper proposes the quantitative extraction of transient disturbance characteristics using the Prony algorithm and estimates the phase and number of capacitors that break down to judge capacitor anomalies. The simulation part verifies the theoretical analysis and detection algorithm’s correctness through numerical simulations and PSCAD (Power Systems Computer Aided Design) electromagnetic transient simulations. The numerical simulations consider different signal lengths, noise levels, attenuation coefficients, and oscillation frequencies. In the PSCAD simulation environment, verification models are built under varying sampling frequencies, numbers of breakdown components, signal lengths, and signal-to-noise ratios. These simulation results verify the accuracy of the detection algorithm under different conditions.
1 Introduction
Capacitor banks are an important means of reactive power compensation to ensure the safety and operational efficiency of power grid operations. Capacitor banks have a variety of long-term adverse factors, such as frequent casting and cutting operations, overvoltage, harmonics, and manufacturing process defects. Shunt capacitor bank insulation faults are frequent, with component breakdown being the most common internal fault (Santoso, 2007). In recent years, several capacitor bank explosions have been induced by internal insulation failure, seriously affecting the stability of the power grid and personnel and equipment safety.
Capacitors are usually equipped with internal component protection and external unbalance protection to ensure the safe operations of shunt capacitor banks (Institute of Electrical and Electronics Engineers. Std 1036-2010, 2010). Most capacitor units are equipped with internal fuse protections to isolate faulty components. Thus, when a few components within the capacitor break down, the remaining normal components can continue to operate (Beere, 1987). The capacitor fault characteristics will not reach the unbalance protection action conditions and will not cause the protection to trip. The overvoltage increases the fault section of the intact components, making breakdown failure more probable. Therein, most shunt capacitor banks easily develop into significant faults from internal weak faults (Xiaoyu et al., 2015). Bringing security risks to shunt capacitor bank operations. When the overvoltage develops to a certain degree, internal faults expand in the capacitor and protection action, ultimately causing the shunt capacitor bank to fail and shut down. If the protection fails to act in time, several component breakdowns will cause the capacitor to exhibit short-circuit faults, leading to capacitor explosions and other accidents. Therefore, timely and sensitive monitoring and localization of capacitor bank component breakdown is vital for ensuring the safety of capacitor banks.
For capacitors equipped with online monitoring devices, traditional state characteristic parameters such as capacitance and dielectric loss factor can be measured directly or indirectly calculated to achieve early detection and diagnosis of component breakdown faults in capacitors (Li and Li, 2017). Capacitance is the primary and most intuitive state characteristic parameter of capacitors, as component breakdown faults cause capacitance changes. Dielectric loss is the energy lost under the action of electric fields, and the dielectric loss factor reflects the overall insulation status of capacitor equipment. Monitoring and analyzing these two state parameters can detect component breakdown faults in capacitors and assess their severity. Moghaddam (Moghaddam, 2017) designed an insulation online monitoring and fault diagnosis system based on virtual instrument technology and LabVIEW software. This system used the capacitance change rate and dielectric loss as feature inputs to establish a fuzzy fault diagnosis model. However, the accuracy of the model membership functions should be improved. Directly measuring these state parameters requires specific monitoring equipment (such as a dielectric loss measurement device), has very high precision requirements, and is usually only applicable to single capacitors, indicating its economic inefficiency.
With the widespread application of power quality analyzers, fault recorders, and other waveform monitoring devices, important data foundations have been provided to diagnose and analyze capacitor group breakdown faults based on power disturbances (Silverstein and Follum, 2020). Previous studies have mainly explored online monitoring and fault analyses for parallel capacitor groups based on voltage/current monitoring data. However, these have primarily utilized steady-state quantities to define new characteristics for analyses and calculations, thus obtaining information on component breakdown faults in parallel capacitor groups.
For instance, Jie et al. (2022) evaluated and calculated steady-phase and amplitude changes in the unbalanced currents of capacitor groups before and after faults. This method can quickly determine the branches of faulty capacitor units and calculate the number of faulty capacitor units. Additionally, Shilong et al. (2020) proposed a scheme based on an unbalanced neutral current to enhance the online monitoring capability of internal faults in parallel capacitor groups. Jouybari-Moghaddam et al. (2017) used the compensation current of the neutral point to define differences in the steady-state phase quantities of unbalanced neutral point currents before and after faults to determine the faulty phase. They applied the positive or negative coefficients of the compensation current to judge the faulty arm. Pavan and Das (2020) defined the negative sequence compensation current for locating the faulty phase and faulty arm, allowing for isolating the occurrence of breakdown faults in both arms with the same or different faulty phases. Goodarzi and Allahbakhshi (2022) utilized discrete Fourier transforms to extract the neutral point voltage and current steady-state phasors. They located the faulted phase by detecting the unbalanced neutral point current changes before and after the fault.
Actual analyses revealed that although the breakdown of capacitor units changes the steady-state voltage and current, these changes are relatively small and easily affected by factors such as system voltage fluctuations. This poses significant limitations for precise diagnosis. In contrast, the transient components of breakdown fault disturbances offer salient features, easy disturbance separation, and rich information content. As a result, exploring parallel capacitor group fault diagnosis methods based on the transient feature analysis of breakdown fault disturbances has vital engineering significance (Wischkaemper et al., 2016).
This paper analyzes the physical process of component breakdown and fault transient characteristics of shunt capacitor banks in detail. We analyze the waveform characteristics of fault transient processes on the key monitoring points of shunt capacitor banks, derive and analyze the quantitative relationship between the key parameters of the transient signals on the R-C circuit, and introduce the transient power perturbation feature extraction-based shunt capacitor bank anomaly estimation method based on the signal characteristic parameter extraction algorithm (e.g., Prony’s algorithm). Finally, numerical analyses and electromagnetic transient simulations verify the proposed method to estimate capacitance. The capacitor state detection based on analyzing the capacitance change is of important theoretical value and engineering significance for improving capacitor state perceptions.
2 Transient characterization of capacitor bank structures and component breakdown
2.1 Shunt capacitor bank structure and operational characteristics
In Figure 1, the existing capacitor bank for reactive power compensation and filtering is connected directly in parallel to the 10 kV bus. Each phase of the capacitor bank consists of several capacitor units in series and parallel. The number of series and parallel units is determined primarily by the capacity of a single capacitor unit to withstand the voltage level decisions. The capacitor unit structure is shown in Figure 1, where each capacitor unit consists of several elements in series and parallel. Each capacitor element is series-connected to the internal fuse. When a single capacitor element breakdown occurs, the internal fuse quickly isolates the fault, and the capacitor unit returns to normal operations. When many components break down, the capacitor withstand voltage is no longer uniformly distributed, making it easy to induce avalanche with capacitor breakdown, resulting in a significant safety accident.
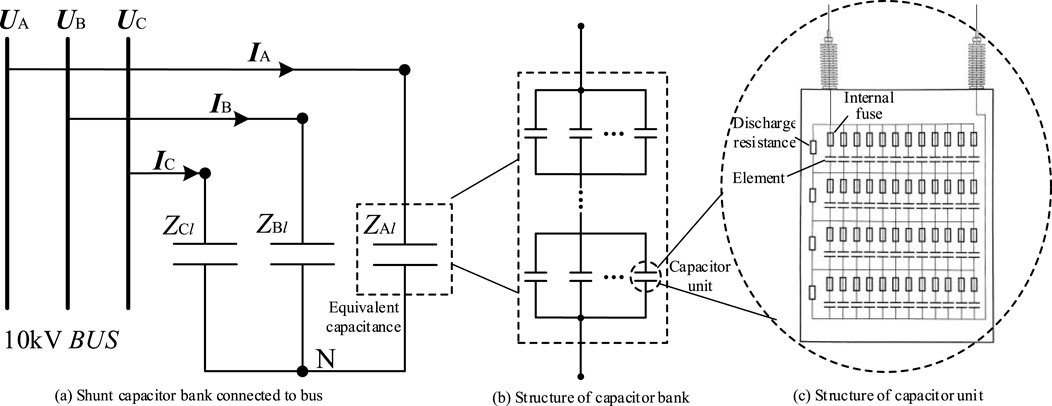
Figure 1. Diagram showing the shunt capacitor bank element structure.
2.2 Transient characterization of a capacitive element in breakdown
The capacitive element adopts an internal fuse structure, and its fault process includes two stages: capacitive element breakdown and fuse melting. The energy in the system is redistributed when in a breakdown state, equivalent to the fault capacitive element in series being directly shorted, resulting in a transient signal. When the capacitive element allows more current to flow, the fuse rapidly melts (about 1 ms) (Xu et al., 2022), and the faulty element is isolated. The same series section of the capacitor progresses in the charging state. Analyzing the component breakdown fault process shows the internal fuse impedance and capacitor unit lead impedance are much smaller than the system impedance. Thus, the calculation is ignored.
The current production technology of capacitors and components is generally used to highlight the folded edge of aluminum foil structures to achieve the series-parallel connection. Therefore, the components of the lead pieces for the resistance and inductance can be disregarded. Figure 2 shows the simplified circuit for the decoupling equivalent three-phase shunt capacitor bank component breakdown fault. The
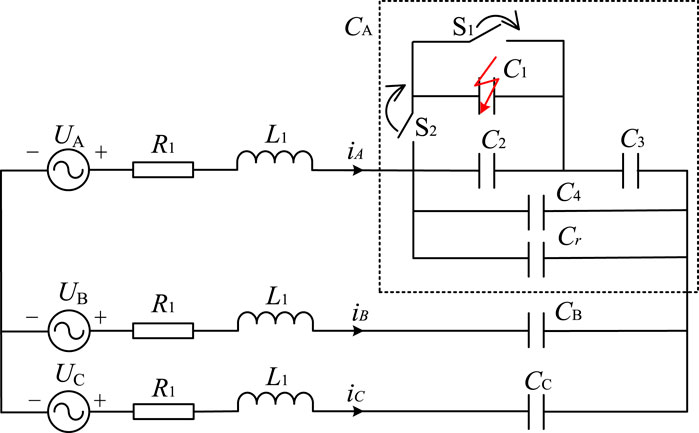
Figure 2. Simplified circuit of three-phase capacitor bank element breakdown fault after decoupling.
Three assumptions are made to simplify the analysis. 1) The system is in a steady state when a component fails. 2) The number of series segments in the double-star capacitor bank is 1. 3) The internal fuse can effectively fuse and isolate the faulty component, preventing the occurrence of arcing. It is assumed that a capacitor unit in the left arm of phase A of the double-star capacitor bank experiences component breakdown at time
Assuming the port voltage for the A-phase shunt capacitor bank is
The above analysis derives the internal discharge current circuit diagram for the component breakdown moment of the fault phase shunt capacitor bank, as shown in Figure 3. The breakdown occurs in the positive half of the voltage. The discharge current is reversed if the breakdown occurs in the voltage’s negative half. The breakdown component in the branch circuit discharge current is used to blow the fuse current. The component is usually near the peak voltage breakdown when the frequency current is just over zero. Further, the actual capacitor unit of the external circuit in the presence of inductance delays the frequency current injection into the fault branch circuit (Yan et al., 2016). Moreover, the interval between the component breakdown
where
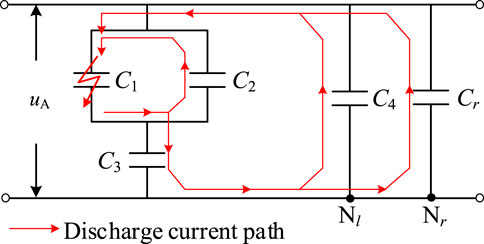
Figure 3. Discharge current circuit inside the capacitor bank in case of component breakdown.
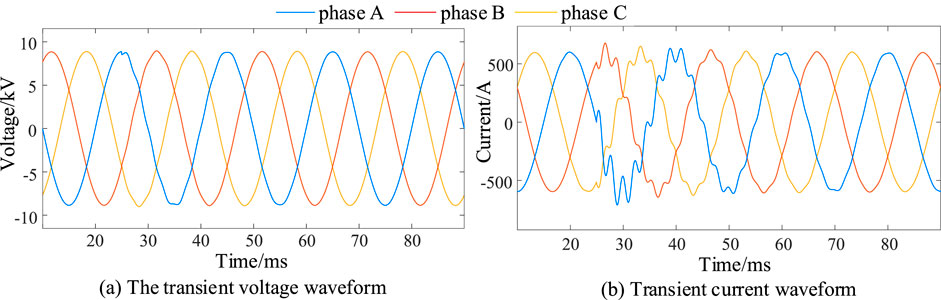
Figure 4. The voltage and current transient disturbance waveforms caused by capacitor element breakdown.
3 Capacitance estimation algorithm based on attenuated transient signal calculations
3.1 Calculation of capacitance parameters based on attenuated oscillatory transient signals
The transient characterization of double-star shunt capacitor bank component breakdown faults in Section 2 suggests that the transient voltage and current components at the port of the shunt capacitor bank caused by component breakdown faults are high-frequency attenuation signals. Neglecting the resistance and inductance inside the shunt capacitor bank simplifies the R-C circuit model. The resistance value
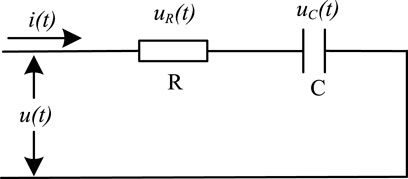
Figure 5. Simplified R-C circuit of the shunt capacitor bank.
Assuming
in the Equation 2,
According to the voltage and current differential equations
The combined simplification is shown in Equations 4, 5.
Therefore, further derivations of the circuit parameters
Both the
3.2 Algorithm for quantitative transient signal extraction
The transient signal characteristics generated manifest primarily as attenuation and high-frequency attenuation signals when the capacitive element breaks down. The industrial frequency steady-state and noise signals are shown in Equation 7 (Bollen et al., 2005). The
Existing common methods for power signal feature extraction include the fast Fourier transform (FFT), wavelet analysis, singular value decomposition (SVD), TLS-ESPRIT algorithm,and Prony algorithm. The FFT is a frequency-domain analysis of the signal that calculates the amplitude and phase of the signal components at different frequencies. However, it cannot estimate the attenuation coefficient of the signal. The results of the wavelet analysis are easily affected by matches between the basis function and the analyzed signal. The SVD reconstructs the characteristic signal and noise separation. However, the separate SVD calculations cannot provide the specific value of the signal characteristic quantity. The TLS-ESPRIT algorithm is applied primarily to frequency estimation. The Prony algorithm can effectively estimate the frequency, decay coefficients, and phase information of signals, demonstrating strong adaptability in analyzing signals containing multiple frequency components and decay. In scenarios with significant noise interference, the Prony algorithm performs well in signal reconstruction and noise suppression, effectively extracting signal characteristics. Relative to some other complex signal processing algorithms, the Prony algorithm holds an advantage in computational efficiency, swiftly and accurately obtaining the signal’s characteristic parameters.
Taking all the above factors into consideration, utilizing the Prony algorithm for calculating transient signal characteristic parameters is reasonable, as it can accurately extract signal frequency, decay coefficients, and other parameters, while possessing high computational efficiency and applicability (Hauer et al., 1990). The principle of this method is briefly described below.
Prony’s algorithm uses a combination of
The original signal of Equation 7 is sampled at equal intervals. The Prony mathematical model is described as:
where
The fitted values
The key to computing the signal parameters for the Prony model is to find the chi-solution of the linear constant coefficient difference equation corresponding to Equation 8 when
The recursive difference equation of Equation 8 can be constructed as:
The equation for
The minimum value of
where
The model order
4 Simulation verification
4.1 Numerical simulation verification
The attenuated oscillating signal flowing under the R-C circuit is generated by direct simulations based on MATLAB to verify the correctness of the algorithm. The circuit parameters are
where
According to experience, the current parameter is set as:
The corresponding voltage and current waveforms are deduced based on the differential equation of the R-C circuit, as shown in Figure 6.
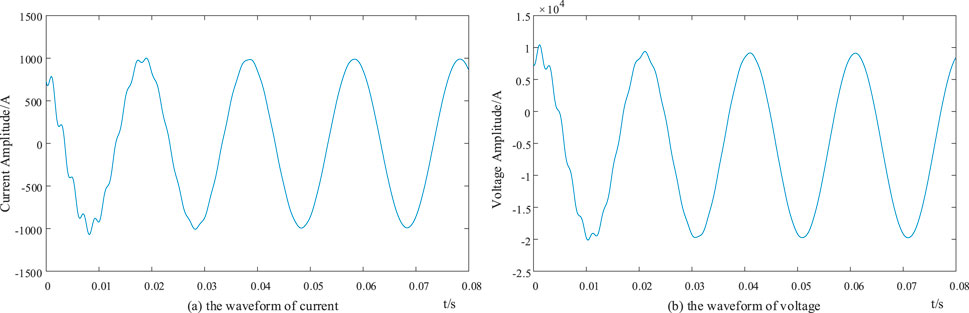
Figure 6. Current (A) and voltage (B) waveforms of the R-C circuit based on numerical simulations.
The capacitance and resistance parameters are calculated using the traditional FFT and based on the proposed electric power perturbation feature. The electric power perturbation feature approach utilizes the Prony algorithm to extract characteristic parameters from the attenuated oscillating signal. Some values of the parameters in Equation 17 are modified appropriately, and the effects of the signal length, noise signal, signal attenuation coefficient, and signal oscillation frequency on the two calculation methods are considered. The error is calculated as:
4.1.1 Impact of signal length on circuit parameter calculations
The circuit parameters are calculated using the attenuated oscillating signal
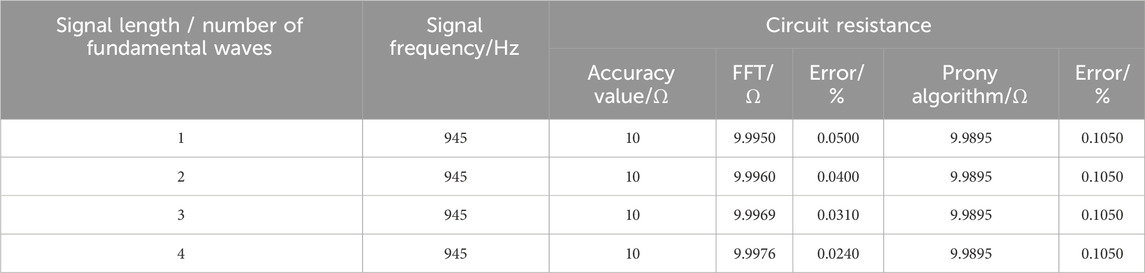
Table 1. Effect of signal length on the resistance calculations.
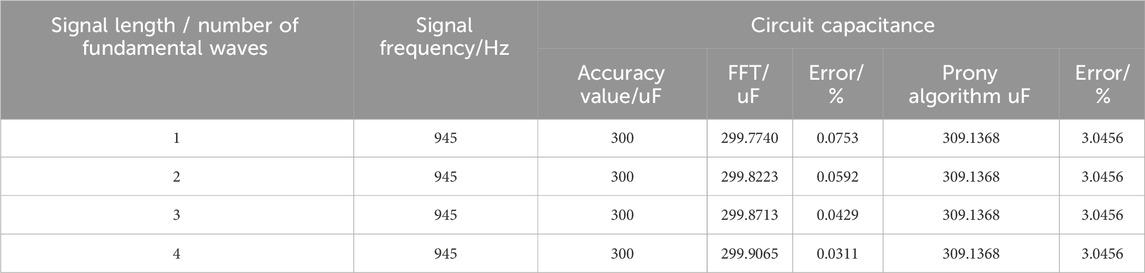
Table 2. Effect of signal length on capacitance calculations.
4.1.2 Effect of noise on the circuit parameter calculations
The same attenuation oscillatory signal

Table 3. Effect of noise on the resistance calculations.
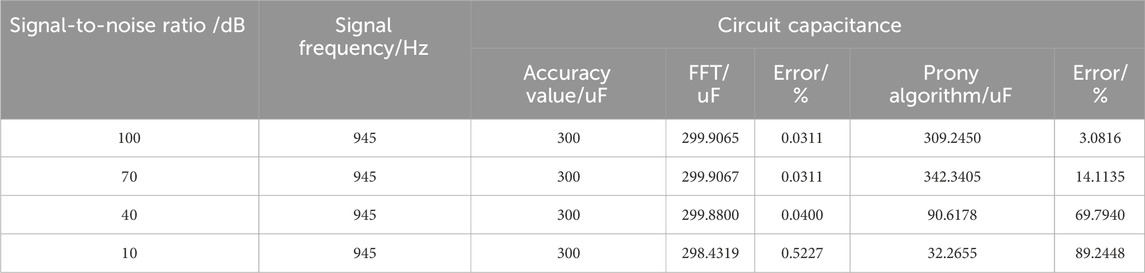
Table 4. Effect of noise on the capacitance calculations.
4.1.3 Signal attenuation coefficient effect on parameter calculations
The impacts of the attenuation coefficient on the circuit parameter calculations are shown in Tables 5, 6. The attenuation coefficient of the FFT-based resistance and capacitance calculations has a small impact. A smaller attenuation coefficient gives less computational error. When the signal attenuation coefficient is small, the signal tends to be a steady-state sinusoid; therefore, the FFT-based calculations are more accurate. The Prony algorithm is affected by the attenuation coefficient because large attenuations shorten the available signal duration and increase the errors.

Table 5. Effect of attenuation coefficient on the resistance calculations.
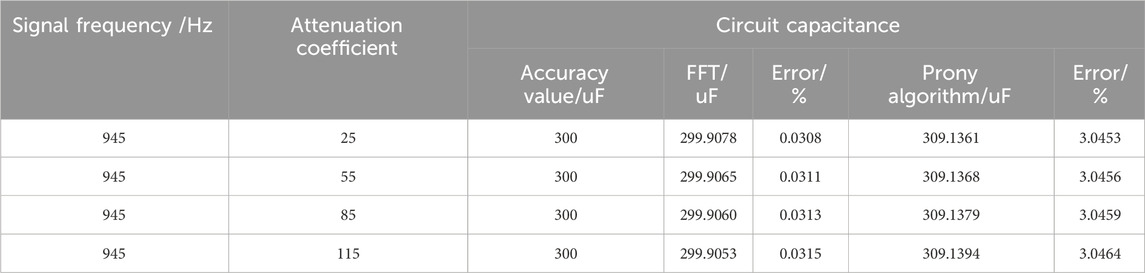
Table 6. Effect of attenuation coefficient on the capacitance calculations.
4.1.4 Effect of signal oscillation frequency on the parameter calculations
The impacts of the oscillation frequency on the circuit parameter calculations are shown in Tables 7, 8. The signal oscillation frequency does not significantly affect the FFT-based capacitance calculation but impacts the Prony algorithm-based capacitance calculations. This is because in the FFT algorithm, frequency components are averaged onto different frequency points, while the Prony algorithm can more accurately determine the frequency components of the signal. Therefore, in the case of complex or difficult-to-distinguish signal frequencies, the capacitance calculation using the Prony algorithm will be more significantly affected.
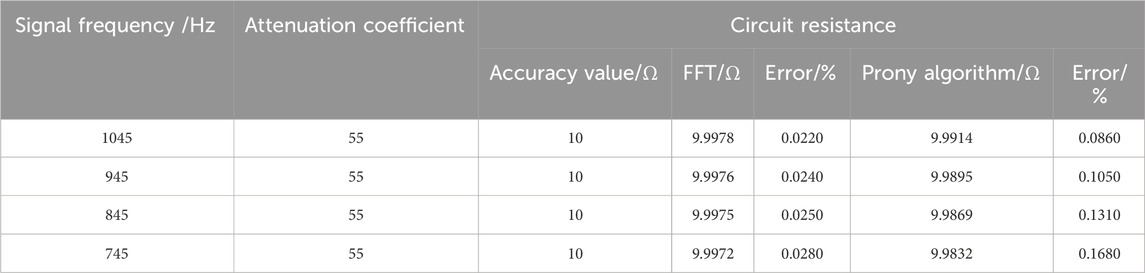
Table 7. Effect of oscillation frequency on the resistance calculations.
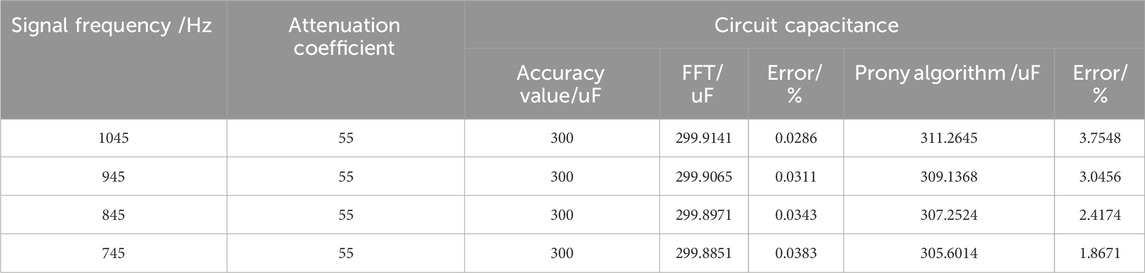
Table 8. Effect of oscillation frequency on the capacitance calculations.
A comprehensive analysis of the impact of the signal length, signal-to-noise ratio, attenuation coefficient, and oscillation frequency on the two calculation methods found the following. 1) The FFT-based loop resistance and capacitance calculations are affected by the signal length as longer signals gradually tend to be steady-state sinusoids. The noise greatly impacted the calculations, but the attenuation coefficient and oscillation frequency had no significant impact. 2) The Prony algorithm is significantly affected by noise, mainly in the parameter extraction algorithm. The impact of the attenuation coefficient and oscillation frequency are smaller, and the signal length has no impact.
4.2 PSCAD/EMTDC simulation verification
4.2.1 Introduction to the simulation and analysis model and parameters
A PSCAD was built based on the actual 10 kV capacitor bank as a simulation analysis model to verify the correctness of the quantitative extraction based on transient signals, as shown in Figure 7. The total simulation time was 5 s, the capacitor element breakdown time was 3.93 s, and the fuse time was 3.931 s (because it is shorter, so the component breakdown of the short-circuit state is negligible). The arc-canceling coil grounds the center point of the system. The capacitor bank is a single-star connection with an internal fuse structure and neutral point ungrounded operational mode.
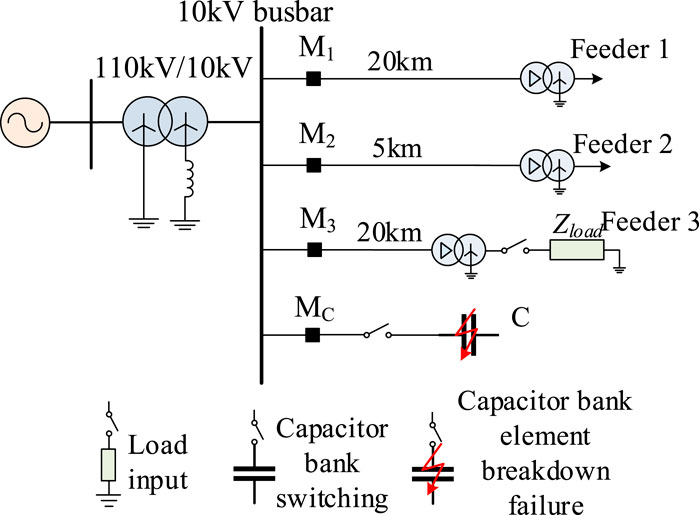
Figure 7. Simulation model for the 10 kV capacitor breakdown.
The capacitor bank parameters are set as shown in Table 9. The
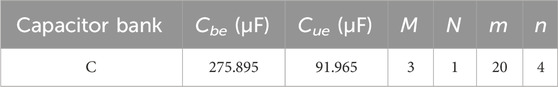
Table 9. Simulation parameters for the single star shunt capacitor bank.
4.2.2 Impact of the four influencing factors on the two calculation methods
The capacitance parameters are calculated using the traditional FFT and the proposed electric power perturbation feature method. The proposed method utilizes the Prony algorithm to extract the characteristic parameters of the attenuated oscillating signal. Some of the parameter values from Figure 5 are modified appropriately, and the effects of the sampling frequency, number of breakdown elements, signal length, and signal-to-noise ratio on the two calculation methods are considered. The error calculations are shown in Equation 18.
The following conclusions are made from Table 10. 1) The sampling frequency and signal length significantly affect the FFT-based capacitance calculations. As the sampling frequency decreases or the signal length increases, the signal gradually tends toward a steady-state sinusoid. The noise has a noticeable impact on the calculation results. 2) The Prony algorithm is also significantly affected by the sampling frequency and signal length, but the results are opposite to the traditional FFT. As the sampling frequency increases or the signal length decreases, the power disturbance characteristics are more obvious, and the noise has greater effects on the signal feature parameter extraction.
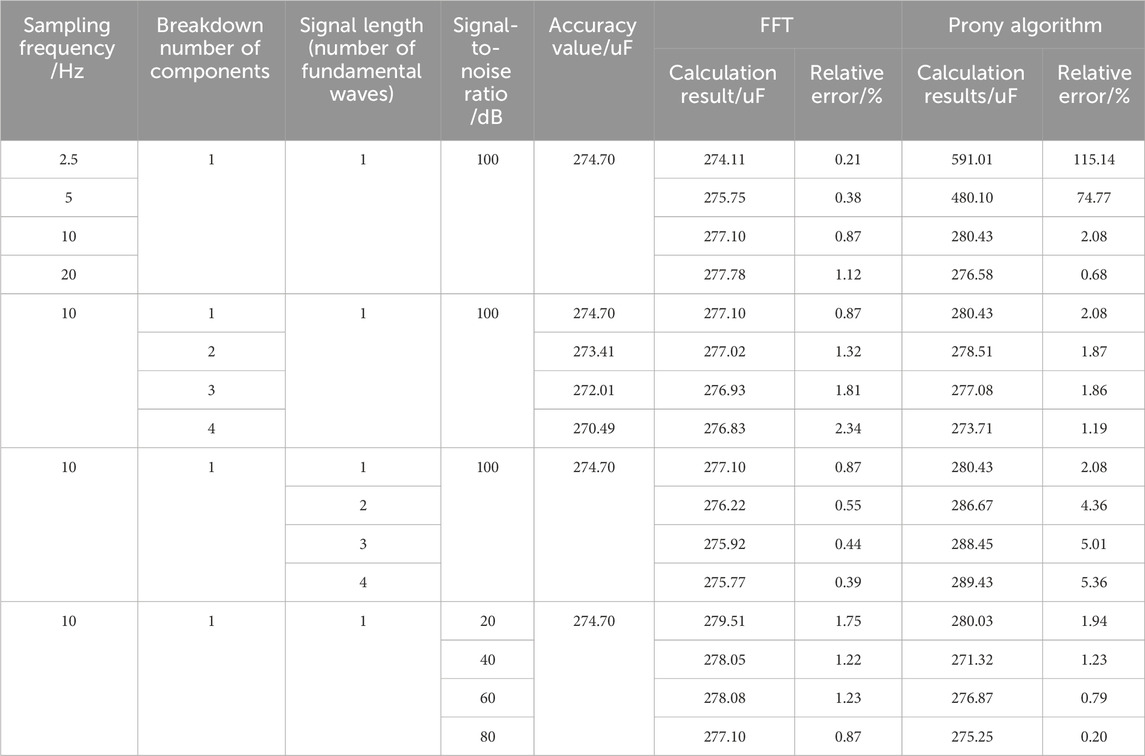
Table 10. Comparison of the two signal analysis methods under various fault situations.
In addition, with an increased number of component breakdowns, the results of both algorithms change, which can be quantitatively analyzed to determine the specific number of component breakdowns.
5 Conclusion
This study focuses on the diagnosis of faults in parallel capacitor banks, using the Prony algorithm for quantitative feature extraction of transient disturbance signals, and based on the quantitative relationship between transient signals and capacitance to achieve the judgment of capacitor abnormalities. Experimental results show that high-frequency transient disturbance signals generated during capacitor switching or breakdown contain critical information about the capacitor’s condition, manifested as decay oscillations ranging from hundreds of Hz to kHz. Through multiple sets of numerical simulations and validation using PSCAD electromagnetic transient simulations, the accuracy and effectiveness of the method have been proven, providing new analytical tools and theoretical basis for the condition monitoring and health management of parallel capacitor banks.
Data availability statement
The original contributions presented in the study are included in the article/supplementary material, further inquiries can be directed to the corresponding author.
Author contributions
LZ: Conceptualization, Formal Analysis, Funding acquisition, Investigation, Methodology, Project administration, Resources, Supervision, Validation, Visualization, Writing–original draft, Writing–review and editing. MM: Conceptualization, Formal Analysis, Validation, Visualization, Writing–original draft, Writing–review and editing. WX: Conceptualization, Data curation, Formal Analysis, Investigation, Methodology, Resources, Software, Validation, Writing–original draft, Writing–review and editing. YZ: Formal Analysis, Visualization, Writing–original draft, Writing–review and editing. BH: Investigation, Writing–original draft, Writing–review and editing. WwZ: Data curation, Investigation, Writing–original draft, Writing–review and editing. WhZ: Data curation, Investigation, Resources, Software, Writing–original draft, Writing–review and editing.
Funding
The author(s) declare that financial support was received for the research, authorship, and/or publication of this article.
Acknowledgments
We thank the College of Electrical Engineering, Sichuan University for providing access and support to the computer resources required to carry on this work. We thank the Guilin Power Capacitor Co., Ltd. for providing us with the testing platform.
Conflict of interest
Authors LZ, YZ, BH, and WZ were employed by Heyuan Power Supply Bureau of Guangdong Electric Power Grid Co., Ltd.
Author MM was employed by Electric Power Research Institute of Guangdong Power Grid Co., Ltd.
The remaining authors declare that the research was conducted in the absence of any commercial or financial relationships that could be construed as a potential conflict of interest.
This research was supported by China Southern Power Grid Company Technology Project Limited (Project Number: 031600KK52220003). The funder was involved in the following aspects of the study: study design, data collection, and provision of technical resources.
Publisher’s note
All claims expressed in this article are solely those of the authors and do not necessarily represent those of their affiliated organizations, or those of the publisher, the editors and the reviewers. Any product that may be evaluated in this article, or claim that may be made by its manufacturer, is not guaranteed or endorsed by the publisher.
References
Beere, P. (1987). Internal fuses – a superior method for protecting high-voltage power capacitors. Vector Electr Eng. 6, 8–9.
Bollen, M. H. J., Styvaktakis, E., and Gu, I. Y. H. (2005). Categorization and analysis of power system transients. IEEE Trans. Power Deliv. 20, 2298–2306. doi:10.1109/TPWRD.2004.843386
Goodarzi, A., and Allahbakhshi, M. (2022). Online condition monitoring algorithm for element failure detection and fault location in double wye shunt capacitor banks. Int. J. Electr. Power Energy Syst. 137, 107864. doi:10.1016/j.ijepes.2021.107864
Hauer, J. F., Demeure, C. J., and Scharf, L. L. (1990). Initial results in Prony analysis of power system response signals. IEEE Trans. Power Syst. 5, 80–89. doi:10.1109/59.49090
Institute of Electrical and Electronics Engineers. Std 1036-2010 (2010). IEEE guide for the application of shunt power capacitors. IEEE Publications.
Jiabi, L. (2021). Research on technologies of shunt capacitor operation condition monitoring based on disturbance data analysis. Shandong: Shandong University. [dissertation/master’s thesis].
Jie, W., Zhengwei, C., Rongsen, L., and Shilong, L. (2022). “Fault detection approach for shunt capacitor banks based on unbalanced current,” in 6th IEEE conference on energy internet and energy system integration, EI2. doi:10.1109/EI256261.2022.10116168
Jouybari-Moghaddam, H., Sidhu, T. S., Dadash Zadeh, M. R. D., and Parikh, P. P. (2017). Enhanced fault-location scheme for double wye shunt capacitor banks. IEEE Trans. Power Deliv. 32, 1872–1880. doi:10.1109/TPWRD.2016.2583381
Li, S., and Li, J. (2017). Condition monitoring and diagnosis of power equipment: review and prospective. High. Volt. 2, 82–91. doi:10.1049/hve.2017.0026
Moghaddam, H. J. (2017) Fault location in high voltage shunt capacitor banks, E82. Canada: University of Western Ontario.
Pavan, P. S., and Das, S. (2020). Novel method for location of internal faults in ungrounded double wye shunt capacitor banks. IEEE Trans. Power Deliv. 36, 899–908. doi:10.1109/TPWRD.2020.2996268
Santoso, S. (2007). On determining the relative location of switched capacitor banks. IEEE Trans. Power Deliv. 22, 1108–1116. doi:10.1109/TPWRD.2007.893195
Shilong, L., Yufei, T., Mingzhong, L., Jie, W., and Xiangxi, D. (2020). A novel online monitoring method for double-y type shunt capacitor bank. New York: Institute of Electrical and Electronics Engineers Inc., 296–300. doi:10.1109/AEEES48850.2020.9121385
Silverstein, A., and Follum, J. (2020). High-resolution, time-synchronized grid monitoring devices. PNNL-29770. North American: synchrophasor initiative technical report.
Technical committee for standardization of power capacitors in the power industry parallel capacitor device technology and application (2011). Beijing: China Electric Power Press.
Wen-hai, Z., Xian-Yong, X., Jing-Gang, Y., Yong, L., Ming-You, Y., and Qian, X. (2014). Circuit parameter calculation based on characteristic parameters and pseudo-impedance of damped oscillation signal. Acta Phys. Sin., 63. doi:10.7498/aps.63.098403
Wischkaemper, J. A., Benner, C. L., Russell, B. D., and Manivannan, K. (2016). Application of waveform analytics for improved situational awareness of electric distribution feeders. IEEE Trans. Smart Grid 6 (6), 2041–2049. doi:10.1109/TSG.2015.2406757
Xiaoyu, C., Jianyong, Z., and Jun, M. E. I. (2015). Power capacitor banks failure warning method based online intelligence LC oscillation frequency variation and its implementation. Power Syst. Prot. Control. 1674-3415(2015)05-0144-06.
Xu, W., Huang, Z., Xie, X., and Li, C. (2022). Synchronized waveforms – a frontier of data-based power system and apparatus monitoring, protection, and control. IEEE Trans. Power Deliv. 37, 3–17. doi:10.1109/TPWRD.2021.3072889
Keywords: shunt capacitor bank, state estimation, component breakdown, Prony algorithm, transient signal transient characteristics
Citation: Zhang L, Ma M, Xiao W, Zhong Y, Hu B, Zhou W and Zhang W (2024) Estimation of abnormal states in shunt capacitor banks using transient disturbance feature extraction. Front. Energy Res. 12:1382684. doi: 10.3389/fenrg.2024.1382684
Received: 06 February 2024; Accepted: 05 September 2024;
Published: 24 September 2024.
Edited by:
Subramanian Srikrishna, Annamalai University, IndiaReviewed by:
Ganesan Sivarajan, Government College of Engineering, IndiaKenneth E. Okedu, Melbourne Institute of Technology, Australia
Copyright © 2024 Zhang, Ma, Xiao, Zhong, Hu, Zhou and Zhang. This is an open-access article distributed under the terms of the Creative Commons Attribution License (CC BY). The use, distribution or reproduction in other forums is permitted, provided the original author(s) and the copyright owner(s) are credited and that the original publication in this journal is cited, in accordance with accepted academic practice. No use, distribution or reproduction is permitted which does not comply with these terms.
*Correspondence: Wen Xiao, MTk4NDQ4MjUyNUBxcS5jb20=