 Yuting Liu
94% of researchers rate our articles as excellent or good
Learn more about the work of our research integrity team to safeguard the quality of each article we publish.
Find out more
ORIGINAL RESEARCH article
Front. Energy Res. , 25 March 2024
Sec. Process and Energy Systems Engineering
Volume 12 - 2024 | https://doi.org/10.3389/fenrg.2024.1380729
This article is part of the Research Topic Low-Carbon Oriented Market Mechanism and Reliability Improvement of Multi-energy Systems View all 28 articles
The lean resource management and reliable interaction of massive data are important components of a low-carbon-oriented new grid. However, with a high proportion of distributed low-carbon resources connected to a new grid, issues such as data anomalies, data redundancy, and missing data lead to inefficient resource management and unreliable interaction, affecting the accuracy of power grid decision-making, as well as the effectiveness of emission reduction and carbon reduction. Therefore, this paper proposes a lean resource management and reliable interaction framework of a middle platform based on distributed data governance. On this basis, a distributed data governance approach for the lean resource management method of the middle platform in the low-carbon new grid is proposed, which realizes anomalous data cleaning and missing data filling. Then, a data storage and traceability method for reliable interaction is proposed, which prevents important data from being illegally tampered with in the interaction process. The simulation results demonstrate that the proposed algorithm significantly enhances efficiency, reliability, and accuracy in anomalous data cleaning and filling, as well as data traceability.
With the increasing demand of a low-carbon-oriented new grid for strengthening the management and control of massive data, lean resource management and reliable interaction with functions such as data cleaning and governance play an important role in the low-carbon-oriented new grid (Li et al., 2021; Shahbazi and Byun, 2022; Liao et al., 2023a). However, due to the complex operating environment and the diversity of data sources, lean resource management poses high requirements on the data quality and reliability (Bo et al., 2023). Issues such as data anomalies, data redundancy, and missing data have a significant impact on the accuracy and stability of the system operation and may also increase the risk of low-carbon-oriented new grid decisions and even pose a threat to the security and stability of the entire grid financial operation (Zhou et al., 2018; Tariq et al., 2021; Li et al., 2022). The emergence of a data middle platform provides a solution for the lean management and unified integration of financial data, realizing the fine configuration of resources and improving the overall economic efficiency through integrating financial data middle platform and service middle platform (Tariq and Poor, 2018; Ashtiani and Raahemi, 2022; Fei et al., 2022).
However, data governance under the traditional middle platform architecture often adopts a centralized management model, with issues such as data silos, poor data quality, high data security risk, low data governance efficiency, and poor scalability. Therefore, research on data cleaning governance for lean resource management and reliable interaction of financial financing in the low-carbon-oriented new grid is required (Li et al., 2023).
The main contribution of this research lies in proposing a lean resource management and reliable interaction framework for the middle platform based on distributed data governance in the context of the lean financing management environment for power grid companies. The paper addresses the pressing need for enhanced data management and control in the grid, particularly focusing on functions such as data cleaning and governance.
First, the existing research algorithms for anomalous data detection have encountered some limitations, such as a manual anomaly threshold setting and untimely threshold updating. In this regard, an anomalous data cleaning method is proposed, based on the dynamic adjustment of local outlier factor (LOF) anomaly thresholds, to achieve the optimal selection of the anomaly threshold for eliminating anomalous data and ensuring high standards of data quality and reliability in lean resource management.
Second, there are some shortcomings in various methods to complete missing data, such as the incomplete utilization of context information and data correlation. In this regard, a missing data-filling method based on an adaptive update domain genetic algorithm is proposed to ensure reliable data support for decision-making processes in the low-carbon-oriented new grid.
Finally, a data storage and traceability method was proposed, integrating blockchain with the InterPlanetary File System (IPFS) to ensure the authenticity and reliability of financial data during the interaction process, thereby enhancing the efficiency and efficacy of lean resource management and reliable interaction in the context of the new energy grid.
The remainder of the paper is structured as follows: Section 2 outlines the related work; Section 3 introduces the lean resource management and reliable interaction framework of the middle platform based on distributed data governance; Section 4 presents a distributed data governance approach for lean resource management of the middle platform in the low-carbon-oriented new grid; Section 5 introduces a data storage and traceability method for reliable interaction; Section 6 presents the simulation results; Section 7 presents the discussion and limitations; and Section 8 presents the conclusion.
At present, a number of studies focus on the data cleaning governance of the grid financial financing lean resource management and reliable interaction, and the main methods include data anomaly identification algorithms and missing data filling algorithms (Kalid et al., 2020; de Prieëlle et al., 2022). The LOF algorithm is a typical algorithm in data anomaly identification. Several studies have introduced methods for evaluating the extent of outliers within data segments through the utilization of the LOF calculated with respect to principal components (Wang et al., 2021). Some other methods include the LOF based on the sample density (SD-LOF) data cleaning algorithm (Xu et al., 2018). However, the above methods still have some issues. The identification of anomalous data usually requires manual setting of the anomalous determination threshold, which is inefficient and inaccurate. For missing data filling, the current main methods include vector-based and matrix-based missing data filling methods. In addition, there are tensor-based missing data filling methods, which can be regarded as matrix-based extensions and are suitable for multi-dimensional data filling (Deng et al., 2019; Jiang et al., 2021). In this regard, there is research on missing data interpolation methods based on tensor completion (Dai et al., 2017; Liao et al., 2021), and some scholars have put forward a missing data-reconstruction method based on matrix completion (Li Q. et al., 2020). However, the missing filling method often fails to make full use of the contextual information of the data and the correlation between the data, which leads to inaccurate or incomplete filling results. In the realm of reliable interaction among cooperating systems through the interoperability platform, several studies have sought to enhance the trustworthiness of digital governance interoperability and data exchange using blockchain and deep learning-based frameworks while also integrating a lightweight Feistel structure with optimal operations to enhance privacy preservation (Malik et al., 2023). However, there is a lack of consideration for data cleaning and filling, leading to compromised data quality and low contextual relevance in business flows. Additionally, studies have proposed the integrated service architectural view and two methods of modeling messaging flows at the service and business levels, defining a business flow context using the integrated process view, thereby improving communication efficiency in complex systems (Górski, 2023). Nevertheless, this modeling approach overlooks the essentiality of reliable data storage and traceability, resulting in the inefficient generation of executable integrated flows for large-scale composite systems such as grid companies. In addressing the abovementioned issues, this paper presents significant innovations in service and business flow data processing. It introduces a dynamic data cleaning algorithm with adaptive data-filling methods that consider contextual information. Furthermore, it proposes a data trust storage method based on a blockchain and IPFS, along with data traceability through Merkle trees. This series of data processing methods is closely interconnected, enhancing the effectiveness of lean resource management and the performance and trustworthiness of digital governance interoperability and data exchange within the reliable interaction framework.
With the continuous development of the financing scale of low-carbon-oriented new grid financial systems and the gradual expansion of interest-bearing liabilities of electric power companies, lean resource management and reliable interaction of financial financing are urgently needed. Therefore, this paper constructs a lean resource management and reliable interaction framework of a financial middle platform based on distributed data governance, as shown in Figure 1. The proposed framework mainly includes the data awareness layer, distributed data governance layer, management and interaction layer, middle platform layer, and overall decision-making layer. The following paragraphs describe how to realize the fine allocation of financial data resources and improve the overall economic benefits of electric power companies.

Figure 1. Lean resource management and reliable interaction framework of the middle platform based on distributed data governance.
The data awareness layer is the foundation of the lean resource management framework, which covers the core capital flow data of the low-carbon-oriented new grid financial system (Li Z. et al., 2020). The core capital flow data include the cash inflow and outflow data of the whole chain of cost and expense inputs and benefit outputs, such as assets, equipment, projects, costs, capital, loads, reliability, electricity sales, and tariffs. Data awareness encompasses the acquisition, organization, analysis, and visualization of data, serving to enhance individuals’ comprehension of the concealed trends and value inherent within the data. Through efficient data collection and integration, it ensures the accuracy and completeness of the basic data of the financing lean management framework and provides reliable data support for the subsequent financing lean management of electric power companies.
The distributed data governance layer is mainly responsible for the management of distributed financial data standardization, data quality, master data, metadata, data security, data sharing, data value, and life cycle of the low-carbon-oriented new grid, aiming to improve the security and controllability of data in the system and achieve the purpose of lean resource management and reliable interaction. By adopting advanced data governance technologies, such as data anomaly identification cleaning and missing data filling (Ali et al., 2021; Hou et al., 2023), the usability and integrity of financial data are guaranteed, and a credible database is provided to meet the data requirements of financing lean management, thus enhancing the protection of financial data and providing reliable support for financial decision-making in the low-carbon-oriented new grid. Furthermore, through distributed data governance, the consistency and accuracy of data across disparate systems and departments can be ensured, thereby mitigating data redundancy and errors. It can establish a robust data security and compliance storage mechanism, hence enhancing the lean level of resource management. Distributed data governance, by safeguarding data consistency, security, quality, and traceability, enhances the reliability of data resource interactions to ensure the dependable exchange and sharing of data across various systems and departments.
The management and interaction layer is responsible for analyzing the financial data from the distributed data governance layer and formulating the financing strategy of electric power companies, including the modules of financing scale measurement, financing structure measurement, financial cost upper- and lower-limit measurement, and electricity tariff sensitivity analysis. Among them, the goal of financing scale measurement is to scientifically determine the capital demand. Financing structure measurement aims to optimize the allocation of capital. Financial cost upper- and lower-limit measurement ensures that the financial cost is controlled within a reasonable range. Electricity tariff sensitivity analysis is used to assess the financial performance of the enterprise in different market situations. In addition, this layer is also responsible for providing reliable financing data interaction. The blockchain and IPFS are located in this layer, which realizes the functions of trusted storage and accurate traceability of distributed financial data (Tant and Stratoudaki, 2019). The IPFS is a peer-to-peer distributed file system that uses content addressing for data storage and retrieval. Trusted storage leverages this technology to ensure the integrity, confidentiality, and reliability of data, guarding against tampering, loss, or leakage, which further ensures the reliability of the financing strategy and improves the reliable interaction capability of the distribution grid.
The financial middle platform layer includes the financial service middle platform and the financial data middle platform. First, the financial service middle platform integrates common and universal core financial accounting capabilities such as fund accounting, tax management, expense reimbursement, management reports for material procurement, power purchase fee payment, and power sales revenue, achieving the reuse and sharing of financial service capabilities of different service units of the enterprise. The financial data middle platform realizes the integration and unification of multi-level and multi-professional data such as distribution network projects, assets, equipment, costs, funds, power, and users. The financial middle platform integrates the data and functions of each layer of the lean resource management and reliable interaction framework, provides unified interfaces and service, improves the quality of business and financial data, and forms various types of data products, which can be used to serve in the front-end business and support the lean resource management and reliable interaction for the low-carbon-oriented new grid.
The overall decision-making layer mainly includes carbon trading management, enterprise budget management, personnel performance management, and investment decision-making modules (Tariq et al., 2020; Liao et al., 2023b). Through the implementation of financing strategies as well as the analysis and feedback of the results, it formulates to ensure the controllable scale of interest-bearing liabilities and optimize financing costs.
In the process of data acquisition, execution, control, and feedback, data anomalies and missing data easily occur due to factors such as short-term failure of sensors, manual errors, and redundancy of information, which reduce the available information of original data and affect data accuracy and continuity. In this paper, we propose a distributed data governance method for the lean resource management of the middle platform in the low-carbon-oriented new grid. The specific process is shown in Figure 2, which can significantly improve the quality of basic data and improve the available information through the identification and cleaning of data anomaly and the automatic filling of missing data. Data governance technology supports the lean resource management in the low-carbon-oriented new grid and the efficient and reliable operation of the power system.
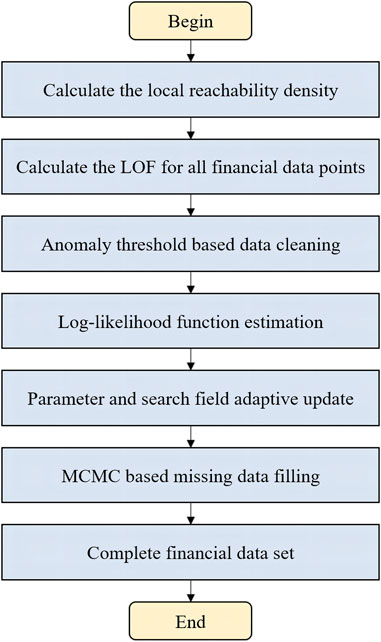
Figure 2. Flowchart of the distributed data governance method for the lean resource management of the middle platform.
The LOF algorithm is a classic unsupervised anomaly identification algorithm, mainly utilizing the density of the data to determine the data anomaly. However, the traditional LOF algorithm requires the LOF threshold to be set manually in advance, which is not applicable to massive financial data cleaning (Zheng et al., 2015; Salehi et al., 2016). This paper proposes a data anomaly cleaning method based on the dynamic adjustment of LOF anomaly thresholds, which adjusts and updates the anomaly threshold according to the number of samples of the LOF value. The proposed method realizes the optimal selection of anomaly thresholds, which is described as follows.
The kth reachable distance is calculated. The kth distance between the point farthest from di and di in all financial data points is defined; the distance Sk(di) is the kth distance of di, and Sk(di, dj) denotes the distance between point di and point dj. Thus, the kth reachable distance from point di to point di is denoted as
The local reachable density for each financial data point is calculated. The kth distance domain of point di is denoted by Vk(di), that is, all points within the kth distance of point di. The local reachability density ρk(di) of point di is the inverse of the average reachability distance from all points within Vk(di) to point di, reflecting the density between point di and points in the surrounding domain, which is given by the following expression:
The LOF is calculated for all financial data points in the sample. The local anomaly factor ξLOF(di) for point di is given by the following equation:
Here, ξLOF(di) denotes the average value of the ratio of the local reachability density of points within the kth distance domain Vk(di) of point di to the local reachability density of point di. The larger ξLOF (di) is, the more likely that point di is an anomalous data point.
The LOF anomaly threshold is determined. After obtaining all LOF values, the anomaly threshold can be continuously adjusted based on the number of statistics of LOF values to realize the accurate identification of anomaly financial data, and the LOF anomaly threshold is defined as
Here,
Since β is an important parameter affecting the LOF anomaly threshold, a too-large value of β will lead to a large anomaly identification error, while a too-small value of β will lead to slow identification efficiency. Therefore, the optimal β needs to be selected. This paper further adapts the parameter of β, which is given as follows:
where ai ∈ [0, 1] is an indicator variable for the mean value of the financial data. When ai = 0, it indicates that
The above steps are repeated until all anomalous financial data points are identified, and the anomalous financial data are cleaned to obtain a new financial dataset
As the cleaning of anomalous financial data will result in missing financial data points, it is necessary to fill in the missing data to protect the integrity of financial data to support the lean resource management of financial financing. We assume that
where
In this paper, Φ(μ, Ω) is used as the fitness function to calculate the fitness of each parameter individual in the population. The larger the Φ(μ, Ω) value is, the closer and more accurate the parameter. The following constraints must be met.
where μm, min and μm, max denote the minimum and maximum values of the mth anomalous financial data point, respectively, whose values are determined by Eobs.
In order to improve the speed of selecting the optimal parameters, the parameters determined by Φ(μ, Ω) are further crossed and mutated to realize the selection of the optimal parameters. Assuming that pc is the crossover probability and there are t parameter individuals in the parameter population, tpc parameter individuals are selected for crossover operation. Assuming that
where e is the crossover random number and its value is within [0,1].
Assuming that px is the variation probability and there are t parameter individuals in the parameter population, tpx parameter individuals are selected from the parameter population for crossover operation. Oh is denoted as an individual in the parameter population.
where random () is a random function that produces a uniform distribution. If a random number is greater than 0, the mean value after mutation will increase, that is, random(⋅) > 0; if a random number is less than 0, the mean value after mutation will decrease, that is, random(⋅) < 0; and if a random number is 0, the mean value after mutation will remain unchanged, that is, random(⋅) = 0. G is the maximum number of generations of variants, g is the current number of generations of variants, β is a parameter that determines the degree of non-consistency, and η is a random number in [0,1].
Considering that the genetic algorithm easily falls into the local optimum and has many iterations, this paper makes the algorithm jump out of the local optimum by the chaotic disturbance of excellent parameters to reduce the number of iterations. Let the fitness function of the current optimal parameter μ* be Φ* and the mean vector of the excellent parameter
Here, μ* is the value after chaotic perturbation in the traversal interval of the smaller feasible domain.
In order to further improve the optimization accuracy of the genetic algorithm, this paper introduces the search domain adaptive update mechanism. The update domain includes a total of two phases. Φo and Φo−1 are defined as the optimal adaptation values of the oth and o − 1th generations, respectively. α is a threshold, which takes the value of (0,1). If the difference between Φo and Φo−1 is less than a threshold α, the search domain update is in the first stage; otherwise, it is in the second stage. The stage discrimination formula of the search domain update is shown as follows:
When the search domain update is in the first stage, the lower bound of the search domain is increased, and the upper bound of the search domain is decreased, thus reducing the overall search domain. The upper and lower bounds of the search domain for the oth generation are calculated as follows:
where
When the difference between Φo and Φo−1 is larger than a threshold α, the replicated optimal individual enters the second stage, and then, the search domain is updated as follows:
where
In order to reduce the error of the estimated value of missing data, it is necessary to further estimate the missing anomalous financial data. Therefore, this paper uses the Markov chain Monte Carlo (MCMC) method to fill the missing data. This method iteratively estimates the missing data on the condition of incomplete datasets and parameters of incomplete data, and the filling process is as follows.
1) Each of the missing-type anomalous financial data are estimated according to the optimal parameters μ, Ω, and Eobs, and the value of
2) The posterior mean vector and covariance matrix of the simulated data, that is, Oy+1, are obtained in
3) Filling the missing-type financial data by iterating (1) and (2) over each other produces a Markov chain
After the anomaly financial data cleaning and missing data filling, measures are implemented to further guarantee the reliable interaction between different departments in the financial financing of electric power companies. This paper proposes a data storage and traceability method for the reliable interaction of the financial system, which prevents the financial data from being illegally tampered with in the interaction process. It ensures the authenticity and reliability of power grid data and further supports the calculation and interaction of the internal financing revenues and costs in electric power companies and the cost units.
After data governance, the dataset
Considering that the IPFS uses the hash value of data as the storage address, this feature is naturally consistent with the tamper-proof feature of blockchain storing data hash values. Therefore, this paper proposes a data storage scheme combining the IPFS and blockchain, which combines the IPFS to store data and blockchain to store data hash so as to realize distributed data storage and ensure data safety reliability, and traceability. When uploading data larger than 256 KB to the IPFS, the system automatically divides the data into 256 KB chunks and stores these chunks on different nodes in the network. Blockchain nodes store hash values of data elements, while nodes except leaf nodes store hash values of child nodes. Therefore, the hash value in the node is calculated as follows:
where Ai,j denotes the hash value of the jth target node in the ith level.
To represent the hash of the data, the IPFS uses a multi-hash format and Base58 encoding. The storage address Ad is represented as follows:
where ACode denotes the hash algorithm encoding; ALengh denotes the length of the hash value; and AHash denotes the hash value.
For each fragment, a unique hash value is generated. Subsequently, the IPFS concatenates the hash values of all fragments and computes the resulting hash value for the data, which is
In order to ensure the authenticity and traceability of financial data flow records (DFRs) of electric power companies, this paper proposes a data traceability method based on Merkle mountain proof, supporting the safety and reliability of financial data in the interaction process. Specifically, a new Merkle mountain block structure is introduced to construct a data storage structure, which includes two parts: block header and block body. Between them, the block header contains the data version number, time stamp, degree of confidentiality, business category, hash value of the previous block, Merkle tree root (MTR), and Merkle mountain range root (MMRR). The block body consists of the Merkle tree and Merkle mountain. As a special Merkle tree, the Merkle mountain has the advantage of dynamic data addition, and it is not necessary to rebuild the data structure. The data traceability method based on Merkle mountain proof includes two parts, Merkle mountain proof and data traceability of Merkle mountain proof based on data private blockchain (DPBC), which are introduced as follows.
Algorithm 1.The proposed Merkle mountain proof-based data traceability method.
1: Input: h, MTR
2: Output:MTR', MMRRh
3: Phase 1: Downloading
4: Initialize Θi(t) = ∅ and yi,j = 0.
5: A target node in the financial middle platform synchronizes information about a block of height h from the local ledger of the entire node in the DPBC network of the company.
6: Obtain the MTR' of the Merkle tree in block h.
7: Phase 2: Merkle mountain proof
8:Calculate the MTR' of a node by Merkle mountain proof.
9: if MTR′ = MTR then
10: Synchronize the block information of the latest height H from the local account book of all nodes in the DPBC network, and obtain MMRR from the H block.
11: Calculate the MMRRh of the target node by Merkle mountain proof.
12: ifMMRRh = MMRRH then
13: DFR care authentic and traceability is completed.
14: else
15: Error in DFR.
16: end if
17: else
18: Error in DFR.
19: end if
The process of data traceability requires the initial generation of Merkle mountain proof, which involves verifying the data stored in the leaf nodes of the Merkle mountain to ensure their integrity and authenticity, thereby safeguarding against tampering and ensuring trustworthiness. The Merkle mountain proof process is as follows:
Step 1: The process starts with the target node to be verified, looks up to the upper parent node, and ends with the MTR of the Merkle tree where the target node is located. The set of nodes passed through in the search process is called Merkle mountain range path.
Step 2: The MTR is retrieved for all subtrees within the Merkle mountain range.
Step 3: The Merkle mountain range proof set is assembled by combining the nodes from the Merkle mountain range path in step 1 and the MTRs from step 2.
Step 4: A hash operation is performed on the Merkle mountain range proof set, which is compared with the field in the block header to complete the Merkle mountain proof.
Then, the set of Merkle mountain proof can be expressed as follows:
where
Therefore, the MMRRh of the target node can be obtained through hash operation, that is,
where MMRRh denotes the MMRR of the block with height h.
The traceability process is shown in Algorithm 1, where H represents the latest block height in the current network and h represents the height of the block to be verified. When it is necessary to trace the DFR in the block with height h, the node only needs to synchronize the block with height h and the block header with the latest height H from the network to complete the verification.
This paper uses a sample set consisting of 103–104 distribution grid financial system data points collected for the purpose of identifying and cleaning anomalous financial data. The financial data points used are sourced from the transaction data and financial books of five departments in the distribution network financial system of a certain power supply company of the State Grid Corporation of China from January to March 2017 (Shouyu et al., 2019). To further validate the efficiency of the proposed algorithm in this paper, a comparative analysis is conducted with two existing algorithms for identifying and cleaning anomalous data: the quartile algorithm and the traditional LOF algorithm. The quartile algorithm demonstrates high cleaning efficiency but is prone to excessive removal, leading to identifying and cleaning some data points within the normal fluctuation range, resulting in a serrated pattern in the clustered regions of the data. The traditional LOF algorithm requires a manually preset threshold, heavily relying on expert experience. When applied to the cleaning of massive financial data characterized by high uncertainty, its efficiency and accuracy are notably compromised.
Figure 3 shows the anomalous data identifying and cleaning results under different numbers of data points. The proposed algorithm exhibits higher accuracy in identifying and cleaning anomalous data than the two comparing algorithms. Specifically, when the number of data points is set at 104, the performance of the proposed algorithm improves by 76.4% compared to the quartile algorithm and 106.5% compared to the traditional LOF algorithm. This improvement stems from the adaptive adjustment of the anomaly threshold based on the sample size of LOF values in the proposed algorithm, enabling a dynamic optimal selection of the anomaly threshold and consequently enhancing the accuracy of anomalous data identifying and cleaning in massive financial datasets. The weaker ability of the quartile algorithm to identify biases in the data leads to the excessive removal of normal data, resulting in a decrease in accuracy in the identification and cleaning of anomalous data. The traditional LOF algorithm, when confronted with large datasets, has a fixed threshold, which limits its ability to identify and eliminate a significant portion of extreme anomalies, particularly in the context of multivariate high-dimensional data, thereby diminishing its accuracy in anomaly identification.
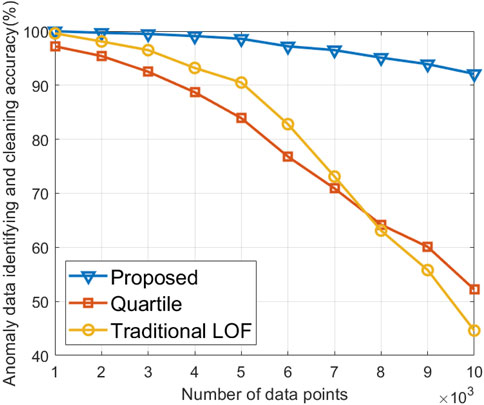
Figure 3. Anomalous data identifying and cleaning results versus different numbers of data points.
Figure 4 shows the number of false positives for anomalous data under different numbers of data points. The proposed algorithm exhibits a significantly lower count of misjudged anomalous data than the two comparison algorithms. Specifically, when the number of data points is set at 104, the number of false positives for anomalous data in the proposed algorithm is 790, representing reductions of 83.5% and 85.7% compared to the quartile algorithm and traditional LOF algorithm, respectively. This noteworthy improvement stems from the real-time dynamic adjustment of the LOF threshold by the proposed algorithm, leading to a substantial decrease in the misjudgment count, particularly in the context of handling vast datasets. In contrast, the two comparison algorithms lack the capability to adapt to dynamic changes in financial data, resulting in an increase in the misjudgment count as data rapidly expand.
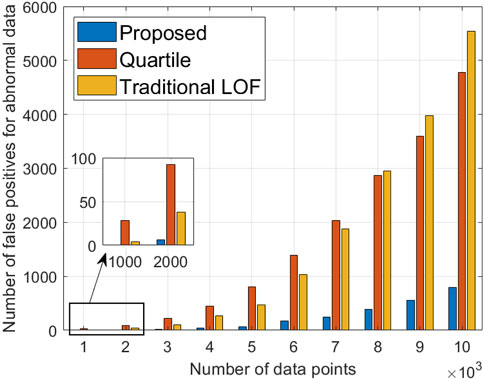
Figure 4. Number of false positives for anomalous data versus different numbers of data points.
The performance of the algorithm is validated through simulation using a foundational financial dataset from the power grid financial system, aiming to demonstrate its data imputation capabilities in a multivariate dataset. The validation indicator is the data-filling accuracy, which refers to the similarity between the filled data and the original data. The specific attributes of the selected dataset are detailed in Table 1 (Wu et al., 2012).
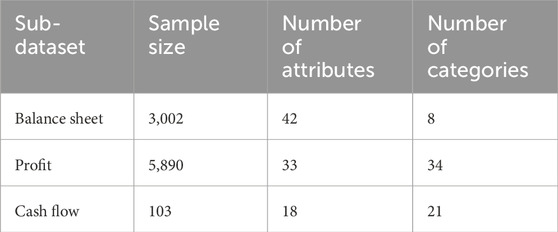
Table 1. Simulation parameters.
To validate the performance of the proposed algorithm, the expectation maximization algorithm (EMA) and genetic algorithm (GA) are selected as comparison algorithms. The EMA assumes a distribution for a financial dataset with partially missing data and makes inferences based on the likelihood under this distribution, replacing missing data with expected values. The GA, on the other hand, derives the optimal combination of attribute weights, or the best chromosome, through selection, crossover, and mutation operations. Consequently, it estimates missing values in the dataset based on this optimal chromosome.
Figure 5 shows the variation in data-filling accuracy with the number of algorithm iterations. The proposed algorithm demonstrates superior data-filling accuracy and faster convergence than the two comparison algorithms. At the 120th iteration, the data-filling accuracy of the proposed algorithm surpasses those of the EMA and GA by 41.1% and 8.2%, respectively. This improvement is attributed to the adaptive updating mechanism of the search space introduced by the proposed algorithm, which dynamically identifies whether the improvement rate of the optimal individual meets the requirements, leading to adjustments in the updating space. Consequently, it conducts global optimization for the attributes of each sub-dataset. Although the EMA exhibits faster convergence than the proposed algorithm, its failure to consider the entire parameter space may result in estimating optimal parameters that are specific to local optima in individual sub-datasets, leading to a decrease in the overall data imputation accuracy. The GA lacks the ability to promptly use feedback information from the network, exhibiting a slower search speed, requiring more training epochs to achieve more accurate solutions.
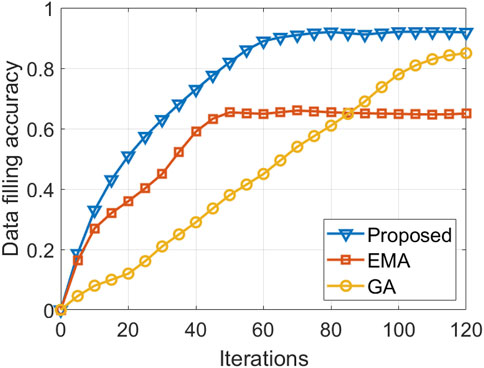
Figure 5. Accuracy of data filling versus the number of iterations.
To validate the performance of the proposed data traceability algorithm in this paper, simulation experiments are conducted, with the evaluation metrics being the amount of data downloaded and data traceability verification time. The amount of data downloaded refers to the size of data that nodes need to store locally when performing data traceability verification. The data traceability verification time is the time required to verify a specific transaction, encompassing the duration from submitting the proof of inclusion of a transaction to locating its corresponding hash value. The comparison algorithm chosen for this analysis is the simplified payment verification (SPV) algorithm. The impact of block height at various magnitudes on simulations is discussed, with the experimental setup including block heights of 0.01 × 10⁵, 0.02 × 10⁵, 0.02 × 10⁵, 0.1 × 10⁵, 0.2 × 10⁵, 0.3 × 10⁵, 0.6 × 10⁵, 1 × 10⁵, 1.5 × 10⁵, and 2 × 10⁵.
Figure 6 shows the amount of data downloaded at different blockchain heights. As the blockchain height increases, both the proposed algorithm and SPV algorithm experience an increase in the required data volume. However, at the same block height, the proposed algorithm necessitates a smaller data download than the comparison Algorithm. At a blockchain height of 2 × 10⁵, the amount of data downloaded for the proposed algorithm is 45.4 MB, representing a 16% reduction compared to the SPV algorithm. This discrepancy arises from the fact that during data verification, the SPV algorithm needs to download the block header information for the entire chain, whereas the proposed algorithm only requires the download of the latest block in the longest valid chain, thereby reducing the storage resource consumption for nodes.
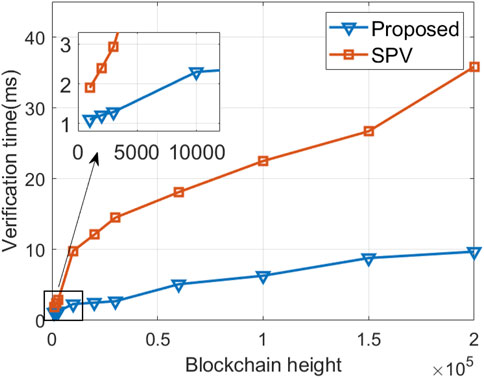
Figure 6. Amount of data downloaded versus different blockchain heights.
Figure 7 shows the results of data traceability verification time at different blockchain heights. As the number of blocks in the blockchain network increases, the verification time for both the proposed algorithm and SPV algorithm gradually escalates. The proposed algorithm exhibits a shorter verification time than the SPV algorithm. This is attributed to the fact that the proposed algorithm only requires obtaining the Merkle mountain range, calculating the verification path to derive the MMRR and comparing it with the hash value in the latest block header at the current height. In contrast, the SPV verification process is more complex as it involves traversing downward from the latest block to trace back to the target block. At a blockchain height of 2 × 10⁵, SPV incurs a maximum time cost of approximately 36 ms, while the maximum time cost of the proposed algorithm is approximately 10 ms. Consequently, the proposed algorithm achieves a reduction of approximately 72% in verification time compared to the SPV algorithm, thereby enhancing the efficiency of the verification process in data traceability.
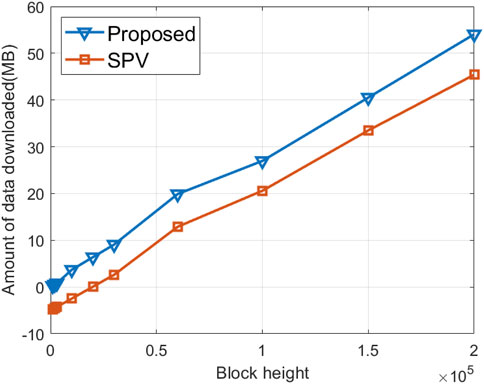
Figure 7. Data traceability verification time versus different blockchain heights.
Our proposed approach and framework offer several advantages that make them promising candidates for integration into enterprise architecture management (EAM) practices. One key strength is that the proposed framework adopts a distributed data governance method, which has high scalability and flexibility. At the same time, the proposed framework adopts advanced abnormal data cleaning and missing data-filling technology to ensure the availability and integrity of financial data. In the context of enterprise architecture management, our approach opens up opportunities for the introduction of a novel integration pattern. By leveraging the decision-making layer, organizations can establish a more seamless and responsive integration mechanism that aligns with the dynamic nature of contemporary enterprises. However, the proposed framework still has some limitations. Introducing a new approach may require significant changes to existing enterprise architecture management processes, potentially posing integration challenges. In addition, the compatibility of our approach with legacy systems may be a concern.
In this paper, we proposed a lean resource management and reliable interaction framework of the middle platform based on distributed data governance. First, the distribution grid anomaly data are cleaned by the dynamic adjustment of LOF anomaly thresholds, and then, the missing data are filled based on the adaptive update domain genetic algorithm, which enables lean resource management in the low-carbon-oriented new grid. Second, the data storage method based on the IPFS is proposed, and the distribution grid data can be traced back by Merkle mountain proof based on DPBC, which enables reliable interaction in the low-carbon-oriented new grid. Finally, the simulation results show that compared with the quartile algorithm and traditional LOF algorithm, the proposed algorithm improves the accuracy of identifying and cleaning anomalous data by 76.4% and 106.5%, respectively. Compared with the EMA and GA, the accuracy of the proposed data-filling algorithm is improved by 41.1% and 8.2%, respectively. Compared with SPV, the proposed data traceability method reduces the verification time by approximately 72%. In the future, we will study how to integrate the financing income evaluation of electric power companies into the proposed framework.
The original contributions presented in the study are included in the article/Supplementary Material; further inquiries can be directed to the corresponding author.
YL: conceptualization, formal analysis, funding acquisition, investigation, methodology, software, validation, writing–original draft, and writing–review and editing.
The author(s) declare that financial support was received for the research, authorship, and/or publication of this article. This research was supported by the Science and Technology Project of State Grid Jibei Electric Power Company (grant number: 71010521N004).
Author YL was employed by State Grid Jibei Electric Power Company Limited.
The authors declare that this study received funding from State Grid Jibei Electric Power Company. The funder had the following involvement in the study: collection, analysis, interpretation of data, the writing of this article, and the decision to submit it for publication.
All claims expressed in this article are solely those of the authors and do not necessarily represent those of their affiliated organizations, or those of the publisher, the editors, and the reviewers. Any product that may be evaluated in this article, or claim that may be made by its manufacturer, is not guaranteed or endorsed by the publisher.
Ali, M., Adnan, M., Tariq, M., and Poor, H. V. (2021). Load forecasting through estimated parametrized based fuzzy inference system in smart grids. IEEE Trans. Fuzzy Syst. 29, 156–165. doi:10.1109/tfuzz.2020.2986982
Ashtiani, M. N., and Raahemi, B. (2022). Intelligent fraud detection in financial statements using machine learning and data mining: a systematic literature review. IEEE Access 10, 72504–72525. doi:10.1109/access.2021.3096799
Bo, Y., Bao, M., Ding, Y., and Hu, Y. (2023). A DNN-based reliability evaluation method for multi-state series-parallel systems considering semi-Markov process. Reliab. Eng. Syst. Saf. 242, 109604. doi:10.1016/j.ress.2023.109604
Dai, J., Song, H., Sheng, G., and Jiang, X. (2017). Cleaning method for status monitoring data of power equipment based on stacked denoising autoencoders. IEEE Access 5, 22863–22870. doi:10.1109/access.2017.2740968
Deng, W., Guo, Y., Liu, J., Li, Y., Liu, D., and Zhu, L. (2019). A missing power data filling method based on improved random forest algorithm. Chin. J. Electr. Eng. 5, 33–39. doi:10.23919/cjee.2019.000025
de Prieëlle, F., de Reuver, M., and Rezaei, J. (2022). The role of ecosystem data governance in adoption of data platforms by internet-of-things data providers: case of Dutch horticulture industry. IEEE Trans. Eng. Manag. 69, 940–950. doi:10.1109/tem.2020.2966024
Fei, L., Xiang, Z., Liu, M., and Chai, X. (2022). “Exploration of paperless intelligent accounting management based on financial middle platform,” in 2022 IEEE 2nd International Conference on Data Science and Computer Application (ICDSCA), Dalian, China, 28-30 October 2022 (IEEE), 826–829.
Górski, T. (2023). Integration flows modeling in the context of architectural views. IEEE Access 11, 35220–35231. doi:10.1109/access.2023.3265210
Hou, Y., Bao, M., Sang, M., and Ding, Y. (2023). A market framework to exploit the multi-energy operating reserve of smart energy hubs in the integrated electricity-gas systems. Appl. Energy 357, 122279. doi:10.1016/j.apenergy.2023.122279
Jiang, S., Su, X., and Zhou, Y. (2021). “Data privacy protection for maritime mobile terminals,” in 2021 13th International Conference on Wireless Communications and Signal Processing (WCSP), Changsha, China, 20-22 October 2021 (Piscataway, NJ: IEEE), 1–5.
Kalid, S. N., Ng, K. H., Tong, G. K., and Khor, K. C. (2020). A multiple classifiers system for anomaly detection in credit card data with unbalanced and overlapped classes. IEEE Access 8, 28210–28221. doi:10.1109/access.2020.2972009
Li, Q., Tan, H., Wu, Y., Ye, L., and Ding, F. (2020a). Traffic flow prediction with missing data imputed by tensor completion methods. IEEE Access 8, 63188–63201. doi:10.1109/access.2020.2984588
Li, T., Kou, G., Peng, Y., and Yu, P. S. (2022). An integrated cluster detection, optimization, and interpretation approach for financial data. IEEE Trans. Cybern. 52, 13848–13861. doi:10.1109/tcyb.2021.3109066
Li, Z., Wu, L., and Xu, Y. (2021). Risk-averse coordinated operation of a multi-energy microgrid considering voltage/var control and thermal flow: an adaptive stochastic approach. IEEE Trans. Smart Grid 12, 3914–3927. doi:10.1109/tsg.2021.3080312
Li, Z., Xu, Y., Fang, S., Zheng, X., and Feng, X. (2020b). Robust coordination of a hybrid AC/DC multi-energy ship microgrid with flexible voyage and thermal loads. IEEE Trans. Smart Grid 11, 2782–2793. doi:10.1109/tsg.2020.2964831
Li, Z., Xu, Y., Wang, P., and Xiao, G. (2023). Restoration of multi energy distribution systems with joint district network recon figuration by a distributed stochastic programming approach. IEEE Trans. Smart Grid 2023, 1. doi:10.1109/tsg.2023.3317780
Liao, H., Mu, Y., Zhou, Z., Sun, M., Wang, Z., and Pan, C. (2021). Blockchain and learning-based secure and intelligent task offloading for vehicular fog computing. IEEE Trans. Intelligent Transp. Syst. 22, 4051–4063. doi:10.1109/tits.2020.3007770
Liao, H., Zhou, Z., Jia, Z., Shu, Y., Tariq, M., Rodriguez, J., et al. (2023a). Ultra-low AoI digital twin-assisted resource allocation for multi-mode power iot in distribution grid energy management. IEEE J. Sel. Areas Commun. 41, 3122–3132. doi:10.1109/jsac.2023.3310101
Liao, H., Zhou, Z., Liu, N., Zhang, Y., Xu, G., Wang, Z., et al. (2023b). Cloud-edge-device collaborative reliable and communication-efficient digital twin for low-carbon electrical equipment management. IEEE Trans. Industrial Inf. 19, 1715–1724. doi:10.1109/tii.2022.3194840
Malik, V., Mittal, R., Mavaluru, D., Narapureddy, B. R., Goyal, S. B., Martin, R. J., et al. (2023). Building a secure platform for digital governance interoperability and data exchange using blockchain and deep learning-based frameworks. IEEE Access 11, 70110–70131. doi:10.1109/access.2023.3293529
Salehi, M., Leckie, C., Bezdek, J. C., Vaithianathan, T., and Zhang, X. (2016). Fast memory efficient local outlier detection in data streams. IEEE Trans. Knowl. Data Eng. 28, 3246–3260. doi:10.1109/tkde.2016.2597833
Shahbazi, Z., and Byun, Y. C. (2022). Machine learning-based analysis of cryptocurrency market financial risk management. IEEE Access 10, 37848–37856. doi:10.1109/access.2022.3162858
Shouyu, L., Wenchong, F., Jin, W., Chaolin, H., Lei, Z., and Ji, Z. (2019). Refinement and anomaly detection for power consumption data based on recovery of graph regularized low-rank matrix. Automation Electr. Power Syst. 43, 221–228. doi:10.7500/AEPS20181122008
Tant, K., and Stratoudaki, T. (2019). “Reconstruction of missing ultrasonic phased array data using matrix completion,” in 2019 IEEE International Ultrasonics Symposium (IUS), Glasgow, UK, 06-09 October 2019 (IEEE), 627–630.
Tariq, M., Adnan, M., Srivastava, G., and Poor, H. V. (2020). Instability detection and prevention in smart grids under asymmetric faults. IEEE Trans. Industry Appl. 56, 1–4520. doi:10.1109/tia.2020.2964594
Tariq, M., Ali, M., Naeem, F., and Poor, H. V. (2021). Vulnerability assessment of 6G-enabled smart grid cyber–physical systems. IEEE Internet Things J. 8, 5468–5475. doi:10.1109/jiot.2020.3042090
Tariq, M., and Poor, H. V. (2018). Electricity theft detection and localization in grid-tied microgrids. IEEE Trans. Smart Grid 9, 1–1929. doi:10.1109/tsg.2016.2602660
Wang, J. L., Huang, T. Z., Zhao, X. L., Jiang, T. X., and Ng, M. K. (2021). Multi-dimensional visual data completion via low-rank tensor representation under coupled transform. IEEE Trans. Image Process. 30, 3581–3596. doi:10.1109/tip.2021.3062995
Wu, S., Feng, X., and Shan, Z. G. (2012). Missing data imputation approach based on incomplete data clustering. Chin. J. Comput. 35, 1726. doi:10.3724/sp.j.1016.2012.01726
Xu, X., Lei, Y., and Zhou, X. (2018). “A LOF-based method for abnormal segment detection in machinery condition monitoring,” in 2018 Prognostics and System Health Management Conference (PHM-Chongqing), Chongqing, China, 26-28 October 2018 (IEEE), 125–128.
Zheng, L., Hu, W., and Min, Y. (2015). Raw wind data preprocessing: a data-mining approach. IEEE Trans. Sustain. Energy 6, 11–19. doi:10.1109/tste.2014.2355837
Keywords: lean resource management, anomalous data cleaning, missing data filling, reliable interaction, low-carbon-oriented new grid
Citation: Liu Y (2024) Lean resource management and reliable interaction for a low-carbon-oriented new grid. Front. Energy Res. 12:1380729. doi: 10.3389/fenrg.2024.1380729
Received: 02 February 2024; Accepted: 05 March 2024;
Published: 25 March 2024.
Edited by:
Minglei Bao, Zhejiang University, ChinaReviewed by:
Tomasz Górski, University of Gdansk, PolandCopyright © 2024 Liu. This is an open-access article distributed under the terms of the Creative Commons Attribution License (CC BY). The use, distribution or reproduction in other forums is permitted, provided the original author(s) and the copyright owner(s) are credited and that the original publication in this journal is cited, in accordance with accepted academic practice. No use, distribution or reproduction is permitted which does not comply with these terms.
*Correspondence: Yuting Liu, bGl1eXV0aW5nQGppYmVpLnNnY2MuY29tLmNu
Disclaimer: All claims expressed in this article are solely those of the authors and do not necessarily represent those of their affiliated organizations, or those of the publisher, the editors and the reviewers. Any product that may be evaluated in this article or claim that may be made by its manufacturer is not guaranteed or endorsed by the publisher.
Research integrity at Frontiers
Learn more about the work of our research integrity team to safeguard the quality of each article we publish.