 Xian Yang
 Xiafei Tang1*
- 1School of Electrical and Information Engineering, Changsha University of Science and Technology, Changsha, China
- 2Hunan Key Laboratory of Energy Perception and Edge Computing, Hunan City University, Yiyang, China
- 3State Grid Hunan Electric Power Company Limited Economic, Technical Research Institute, Changsha, Hunan, China
With the rapid construction of charging stations (CSs), charging station operators need to enhance their core competitiveness by precisely planning their service areas and formulating reasonable and effective pricing strategies. However, the regional competition among multiple charging station operators is generally ignored. In the traditional model, the service scope of CSs appears as regular circles, which is inconsistent with the market distribution law. In response to the irregular relationship between the dynamic service scope of CSs and the real-time charging price, a charging station service scope (CSSS) model is proposed by introducing the variable service field strength (SFS). First, the competitiveness of CSs is evaluated quantitatively, and the SFS of CSs is defined to describe the service scope of CSs by the strongest occupation method. Second, the impact of the charging price on the charging demand is analyzed based on the CSSS division model. In addition, the revenue of charging station operators and the stability of the power grid are considered to establish a real-time pricing optimization model. Finally, the numerical simulation is operated in Furong District of Changsha. It is shown that the proposed method effectively achieves more profits for charging stations and decreases the average power deviation of the whole region.
1 Introduction
The electric vehicle (EV) market has experienced rapid growth since the latter half of 2020. The global sales of EVs exceeded 10 million units in 2022, and it is expected to exceed 70 million units by 2030. EVs have a penetration rate of up to 79.3% in Norway, ranking first in the world. Sweden ranks second globally, with EVs accounting for 32.1%. In addition, China ranks third in the world, with EVs accounting for 19.9% (ITF, 2022; Liu, 2022). As the public infrastructure of power supply, charging facilities play a critical role in the promotion of EVs. The China Electric Vehicle Charging Infrastructure Promotion Alliance (EVCIPA) released that the charging infrastructure increased up to 2.593 million units in 2022, increasing by 225.5% year-on-year (China News Network, 2023), which reflects the fierce competition in the charging station (CS) industry. In addition, the service scope could be expanded by various parameters, such as advanced charging piles, large contracts, and low-cost charging prices (CPs) (Liu et al., 2019; Yang et al., 2022; Zhou et al., 2023a). Thus, it is necessary to propose the precise division of service scope and reasonable pricing strategies to enhance the core competence among charging station operators.
The service scope of CSs reflects the market competitiveness of CSs directly, which is important for its operators to analyze the market situation (Chen et al., 2019a; Wang et al., 2019). However, recent works seldom discuss the service scope of CSs. Their service scope research is mainly in target with airports (Anna et al., 2019), logistics parks (Wu et al., 2016), and urban economic zones (Dai, 2018). Notably, an inevitable market competition exists among multiple CSs in the region (Li et al., 2023a), and this competition also leads to an uneven market distribution. At present, most present facility planning methods are based on the Wilson model or breaking point theory by the regularized circle or the weighted Voronoi diagram (Chen et al., 2017; Li et al., 2023b), which can only divide the market area within a fixed range. Unfortunately, the symmetrically distributed shape cannot precisely describe the service scope of CSs in terms of practical reality (Zhou et al., 2023b). Thus, a reasonable service scope of the charging station is inevitably irregular and varies with the relevant parameters. Furthermore, the Isard method, i.e., the strongest occupation method (Wilson, 1972), is used to quantify the attraction strength of CSs and further recognize the service scope in this paper.
The real-time charging price has a great influence on the charging habits of EV users (Chen et al., 2019b; Gong et al., 2020), which further affects the service scope of CSs. An effective charging pricing strategy should aim to achieve four objectives, namely, guiding EV users to charge in an orderly manner, increasing the profits of operators, improving the utilization rate of charging piles, and reducing the load peak–valley difference (Yang et al., 2021; Zhou et al., 2022). Considering the willingness of the users (CA et al., 2022; Khan et al., 2022), the demand-side response (Shinde and Shanti, 2018; Lai et al., 2023), and the complex time-varying relationship between the charging price and charging demand (Wang et al., 2021; Yang et al., 2023), various models have been proposed to formulate a real-time pricing strategy. However, the existing literature often neglects the impact of a dynamic charging price on the market division, resulting in no changes in service scope.
On the basis of the abovementioned work, this paper studies the service scope division and real-time pricing strategy of CSs based on the Isard method. First, an evaluation index system is established to quantitatively evaluate the comprehensive strength of CSs. Then, the charging station service scope (CSSS) model with the service field strength of CSs is built based on the Isard method. Second, the impact of the charging price on the charging demand is analyzed based on the initial CSSS division. Third, a dynamic charging price strategy is proposed considering the profit of the CSs and the auxiliary service of the power grid. Finally, the relationship between the charging price and the service scope is analyzed in a real-world scenario to provide reasonable pricing suggestions for CS operators. It is significant for enhancing the operational efficiency of CSs and promoting the healthy development of charging infrastructure. The contributions of this paper are as follows.
1) The CSSS division model is built to describe the dynamic service scope of CSs.
2) The impact of the charging price on the charging demand is analyzed based on the charging station service scope.
3) The real-time charging price is formulated via multi-objective optimization with the goals of increasing operator revenue and decreasing power deviation to modify the charging station service scope.
The rest of this paper is organized as follows: Section 2 defines the service field strength (SFS) and builds the CSSS division model based on the Isard method; Section 3 shows the impact of the charging price on the charging demand; Section 4 establishes a real-time pricing optimization model with multi-objectives including the power deviation rate and the operator profitability; the case study and conclusion are presented in Section 5 and 6, respectively.
2 SFS and CSSS division model based on the strongest occupation method
2.1 Comprehensive strength of CSs
The CSSS is closely related to its comprehensive strength. The evaluation index system for the comprehensive strength of CSs is shown in Figure 1, mainly including the contract capacity of CSs, the number of fast/slow charging piles, service fees, and charging prices.
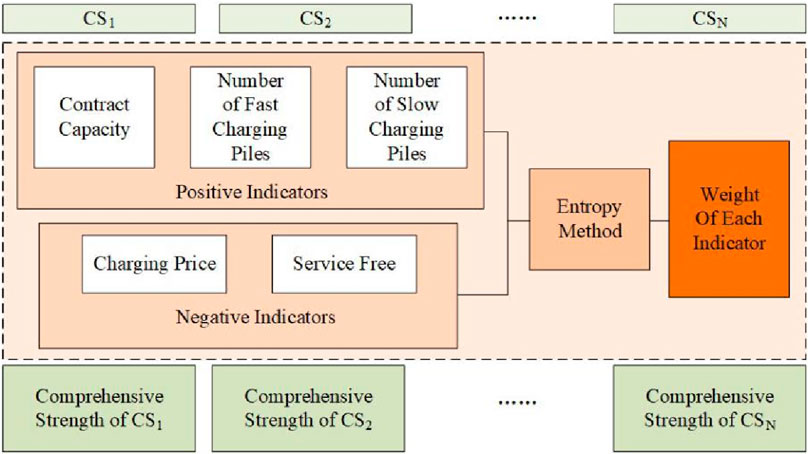
Figure 1. Charging station evaluation index system.
In Figure 1, the contract capacity and the number of fast/slow charging piles are positive factors. The higher the value of these factors, the stronger the comprehensive strength Cn of CSs. It also indicates a stronger attraction to the surrounding demand area, where more users are willing to go to CSn for charging, resulting in a larger service scope Sn. Conversely, the charging price and service fees are negative factors. The higher the value, the smaller the CSSS.
The evaluation indicators are standardized by the extreme value method as follows. The positive and negative indicators are standardized, as shown in Eqs 1, 2, respectively:
where Tn.i is the original value of index i of CSn and Tmax.i and Tmin.i represent the maximum and minimum values of index i, respectively.
The contribution of CSn is calculated with index i, as shown in Eq. 3:
where pn.i is the contribution of CSn with index i and N is the number of CSs.
The entropy of index i is calculated as shown in Eq. 4:
The evaluation index weight of CSs could be obtained as shown in Eq. 5:
where γi is the weight of index i and gi and ei are the coefficients of difference and entropy, respectively.
Then, the comprehensive strength of CSn could be quantified as shown in Eq. 7:
where Cn represents the comprehensive strength of CSn and ci indicates the correlation coefficient. ci = 1 when γi is positive, and ci = −1 if γi is negative.
2.2 Definition of SFS
The formula of the point charge field strength is obtained by Eq. 8:
where Ee represents the point charging field strength, ke is the electrostatic force constant with the unit N·m2/C2, qe is the charge electric quantity, and re indicates the distance between the center and charge.
Analogous to the electrostatic field generated by a point charge, the attraction of CSs to the surrounding area will not change abruptly, in accordance with the characteristics of the typical non-rotating scattered field. According to the Helmholtz theorem, the function of the non-rotating scattered field is always inversely proportional to the distance vector R2. Therefore, the SFS of the CSSS, akin to the electric field strength of a point charge, is defined to quantify the attraction strength of CSs to the surrounding charging demand areas (CDAs).
It is assumed that a certain area is divided into K small grid areas with a certain precision, which is defined as CDAs. Taking CSn as the center, SFS En.k of CSn for CDAk is defined considerating the average distance and the comprehensive strength, which is obtained by Eq. 9:
where kc is the service constant and rn.k represents the distance between CSn and CADk, which can be calculated by the longitude and latitude.
The Wilson model is appropriate for studying spatial interactions (Zhang et al., 2010). Thus, the charging service capacity ratio of CSn to CDAk can be described as shown in Eq. 10:
where K represents the normalization factor, describing the regional difference of the CSs and the demand area. K = 1 when the regional difference is ignored. Dk indicates the total charging demand in CDAk. β is the attenuation factor, determining the speed of service attenuation.
Combined with the electrostatic force constant ke, and assuming each CS has the same service constant, kc is derived as follows:
where Cave is the average comprehensive strength of all CSs, Dave represents the average demand of all demand areas, and rave is the average distance between the CSs and demand areas. Calculated using Statistical Product and Service Solutions (SPSS) software, tmax represents the number of CSs with a comprehensive score greater than 0. Save_n represents the average area of each CS served.
2.3 CSSS division model
In the two-dimensional space, a facility or an enterprise is attractive to the users within a certain range of its surroundings, catering to their needs and preferences. Similarly, as the charging service provider, the CSs act as the central hub, offering charging service to electric vehicle users in their vicinity. Then, CSSS, defined as the geographical spatial distribution range of electric vehicle users who receive charging services from that CS, is usually of an irregular shape, as shown in Figure 2. Notably, the dotted line represents the SFS emitted by CSs, and the CSs are attractive to EVs at the same time.
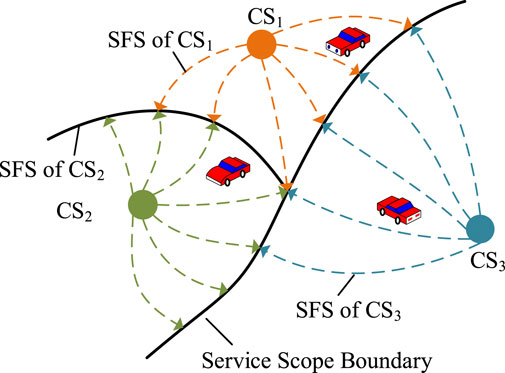
Figure 2. Charging station service scope diagram.
Any CSn will attract the CDAs, resulting in a CSSS that is constrained by the parameters of the surrounding CS and itself. According to the strongest occupation method proposed by Isard, if SFS En.k of CSn to the demand area k is larger than SFS Em.k of other CSm, the demand area k is identified as the CSSS of CSn, as shown in Eq. 13:
where Sn represents the CSSS of CSn and the demand area k is defined as the market demand area. Eq. 13 indicates that among all CSs, CSn has the greatest attraction to the demand area k, and the demand area k belongs to the CSSS of CSn.
3 CSSS-based charging demand
The initial CSSS
The charging demand of CSn is jointly affected by its own charging price and the price of other CSs, as shown in Eq. 15. The charging demand is a negative correlation function of its own price. As the charging price increases, the charging demand for CSn decreases and shifts to other CSs in the area, which results in the CSSS reduction in CSn and the CSSS increase in other CSs.
where
The income of CSs in a day is shown in Eq. 16.
where En is the income of CSn in a day.
The proof of the existence and uniqueness of the Nash equilibrium of the proposed model is given in Appendix A.
4 CSSS-based real-time pricing optimization model
4.1 Pricing optimization model
In a scenario of a perfectly competitive market, it is assumed there are N CSs with different sizes, which belong to H different operators, H ≤ N. All charging loads are evenly distributed throughout the area; users will only choose one of the N CSs to charge when needed.
A multi-objective real-time pricing model is established considering the profit rate and power deviation rate. The objective is optimized by maximizing the total profit rate of all CSs and minimizing the power deviation rate, as shown in Eq. 17.
where Ep_lr and Ep_pc represent the profit rates of the CS and the reduced power deviation rate, respectively. ωn and ωab represent the weights of the above two, respectively. Pe and Pn.w are the electricity purchasing cost and the operation and maintenance cost of the CS, respectively. ΔPt is the power deviation between the real-time output of renewable energy and the day-ahead forecast. PW.t and Pw.t are the real-time and day-ahead wind power output, respectively. PL.t and Pl.t are the real-time and day-ahead photovoltaic outputs, respectively. If ΔPt >0, indicating that the real-time output of wind power and photovoltaic at time t is greater than the predicted output, it is necessary to guide users to charge and increase the charging load to absorb the excess wind and photovoltaic power. Otherwise, if ΔPt <0, indicating that the real-time output of wind and photovoltaic power at time t is less than the day-ahead predicted output, users need to be encouraged to reduce the charging load.
The constraints of optimization model are as follows:
Market demand constraint
Eq. 21 implies that the charging demand of the CS does not exceed the predicted charging load.
Charging load constraint
where ξl and ξh represent the lower and upper limit coefficients, respectively, which means that the sum of the charging demand should not exceed a certain range of the day-ahead charging load.
Charging price constraint
where φl and φh represent lower and upper limits of the charging price, respectively.
4.2 Relationship between CSSS and real-time pricing
The basic idea of a real-time pricing optimization model based on CSSS is shown in Figure 3. First, the initial CSSS was obtained by the strongest occupation method. Then, based on the pricing optimization model, the charging station operator obtains the real-time charging price of charging stations, which affects the initial CSSS, and further develops into the real-time CSSS.
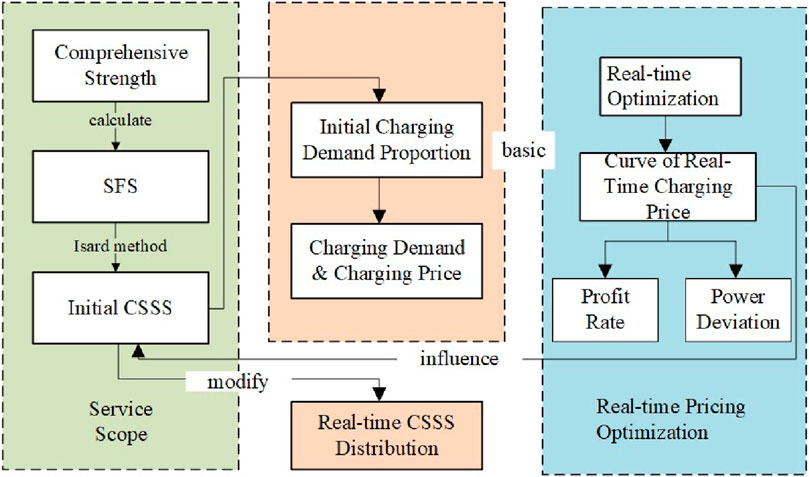
Figure 3. Real-time pricing optimization model based on charging station service scope (CSSS) and solution flowchart.
The detailed steps of real-time pricing optimization based on CSSS are designed as follows:
Step 1: The CSSS is calculated
1) Based on the basic data on CSs and the day-ahead wind power and photovoltaic predicted data, the weight of each index was calculated according to the entropy method, and the real-time output data of wind power and photovoltaic were obtained by adding the power deviation.
2) The comprehensive strength of CSs was quantitatively evaluated according to Eq. 7, and then SFS En.k of each CS was calculated according to Eq. 9.
3) According to Eq. 13, the initial CSSS S*n based on the strongest occupation method proposed by Isard was obtained.
4) The initial charging demand proportion λ was calculated, as shown in Eq. 14.
5) The relationship between the charging price and charging demand was established, and the CS income model was built, as shown in Eqs 15, 16.
Step 2: The real-time price is optimized
1) The multi-objective real-time pricing model with the profit rate and power deviation was built.
2) A day was divided into 96 time points at a resolution of 15 min, taking 1 h as the operation cycle and optimizing the pricing model using CPLEX. Then, the dynamic charging price of CSs at 96 time points, as well as the optimized profit rate and power deviation rate of each CS, was obtained.
3) With the real-time change in the dynamic charging price, the comprehensive strength and the SFS of the CS will also change. Finally, the real-time dynamic CSSS at each time was simulated and obtained
5 Case study
5.1 Basic data
Furong District in Changsha is taken as an example for simulation, and the data on CSs are all obtained from Hunan Economic and Technological Research Institute of the State Grid. Notably, the output data of wind power and photovoltaic are for the total province. First, the map of Furong District is divided into 16,288 market areas with latitude and longitude accuracy of 0.0005 using ArcGIS drawing software. Then, the first three representative CSs are selected from Furong District for calculation as examples. The basic data of these three CSs are shown in Table 1. Based on the evaluation index system, the weight of each index of the CS is obtained by the entropy method. The weight of the contract capacity, the number of fast/slow-charging piles, the service fee, and the charging price are 0.221, 0.486, 0.201, 0.051, and 0.041 yuan/kWh, respectively. Afterward, SPSS is employed for the factor analysis. A total of 143 CSs have a comprehensive score greater than 0.
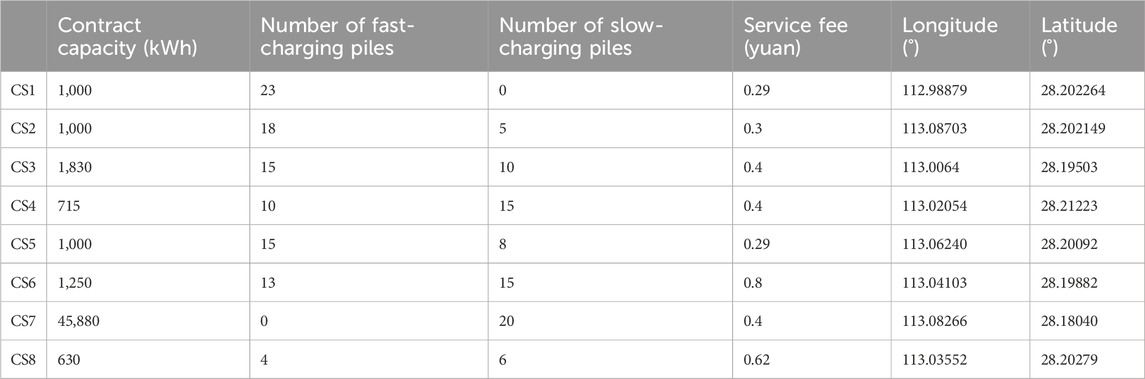
Table 1. Basic data on charging stations (CSs).
For the load of the three charging stations q1,t, q2,t, and q3,t, its boundary is given by setting ξl = 0.8 and ξh = 1.2 in Eq. 19a and φl = φh = 0.1 in Eq. 20a. In addition, according to the related policy issued by the Comprehensive Department of the National Energy Administration, the electricity purchasing price in Hunan Province is 0.46244 yuan/kWh. The daily maintenance cost of each CS is P1.w = 600 yuan, P2.w = 550 yuan, and P3.w = 500 yuan. Based on the project data, the day-ahead wind power and photovoltaic output data of a typical day are shown in Supplementary Figure AB1. It is assumed that the wind power and photovoltaic prediction error is 10%, and the real-time output meets the normal distribution.
5.2 Analysis of the charging price
Without considering the interaction of the charging price, the initial CSSS and occupancy of each CS are calculated based on the strongest occupation method, as shown in Figure 4.
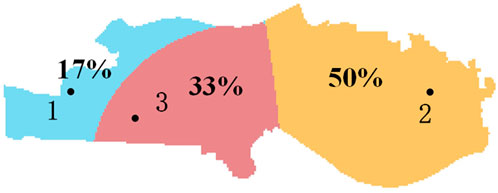
Figure 4. Initial service scope of three charging stations.
As shown in Figure 4, the CSSS of CS2 is the largest without considering the influence of the charging price. It is noted that CS2 has the largest number of fast charging piles, and also, no other competing CS is present in the surrounding area. Thus, its CSSS occupies half of Furong District. As shown in Table 2, the comprehensive strength of CS1 is the strongest. However, due to the remote location and the competition from CS3, the CSSS of CS1 only occupied 17% of the market share and is smallest among the three CSs. In addition, from the shape of the CSSS of CS1 and CS3, the boundary presents an inward curved arc, which indicates that the further away from the two CSs, the more area belongs to CS1. That is, compared to CS3, the distance from one point to CS1 is larger, but it is still attracted by CS1. Therefore, it can be concluded that the SFS of CS1 is greater than that of CS3. The average peak–valley–flat charging price of CSs is then calculated by the real-time pricing optimization model mentioned in Section 4, as shown in Table 2.
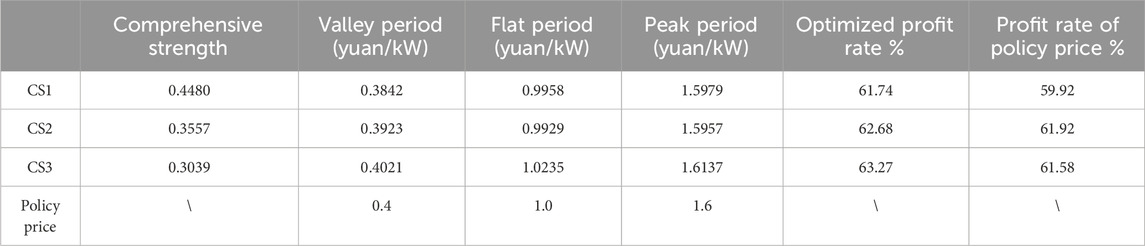
Table 2. Comprehensive strength and average charging price of three charging stations (CSs).
Table 2 shows that the charging prices of CS1 and CS2 are lower than the policy price, while the charging price of CS3 is higher than the policy price. Due to the higher comprehensive strength of CS1 and CS2, the electric vehicle users will pay more attention and be more sensitive to price changes. Accordingly, the influence parameter of the policy price difference kp.n in Eq. 16 is also larger, indicating that charging prices can increase the charging demand and profit if they are lower than the policy price. In comparison, the comprehensive strength of CS3 is the smallest, and users pay the least attention to its price change. Thus, CS3 will maintain its income by setting a higher price than the policy price, increasing by 0.0137 yuan/kWh during the peak period and 0.0235 yuan/kWh during the flat period.
Then, the change in CDAs is analyzed for the peak, valley, and flat periods, and three time points of 6:00, 10:00, and 18:00 are selected. The number of CDAs occupied by each CS at these time points is shown in Supplementary Figure AB2. It is observed that there is no significant change in the CSSS of CS2 due to the small competitive pressure. On the contrary, the CSSS changed with the charging price mainly for CS1 and CS3. Therefore, the CSSS changes for CS1 and CS3 are discussed as primary. The number of CDAs occupied by CS1 and CS3 and their CP changes are shown in Figure 5.
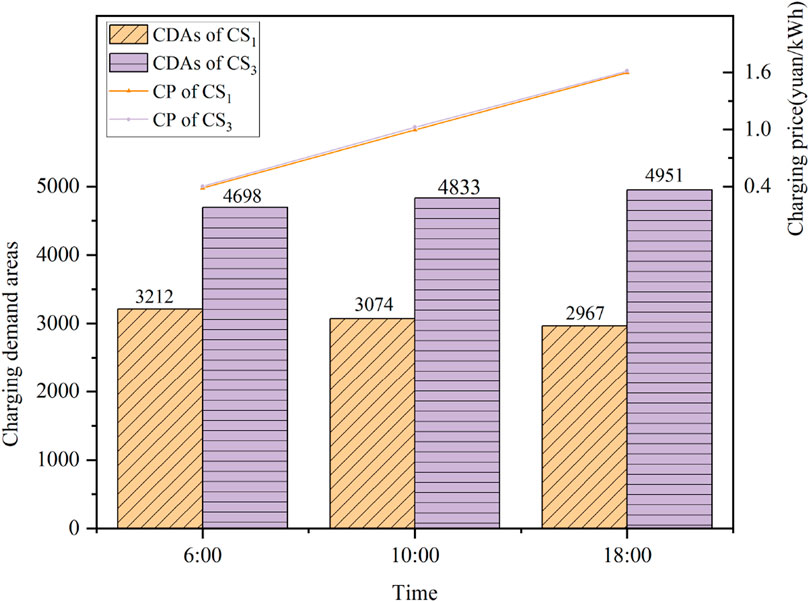
Figure 5. Number of charging demand areas and charging price of three charging stations.
Afterward, the real-time charging price is taken into consideration. Since charge station 1 has a higher comprehensive strength and a small charging price difference of 0.02 yuan, the market share increases from 17% in Figure 4 to 20% (the number of CDAs is 3,212 at 6:00). Correspondingly, CS3, which is closer to CS1, lost part of its CSSS due to its smaller comprehensive strength, and its market share decreased from 33% to 29%.
With the increase in the charging price, the number of CDAs occupied by CS1 decreased by 245 from 6:00 to 18:00. At the same time, the number of CDAs occupied by CS3 increased by 253. This can be attributed to the fact that CS1 has stronger comprehensive strength, and users are more responsive to its charging price changes. Thus, as the charging price of charge station 1 increases, the number of users of CS1 decreases faster than those of CS3, resulting in a more significant change in the CSSS of CS1.
It can be seen that the charging price and CSSS are affected by many factors, such as comprehensive strength, geographical location, and number of competitors around.
5.3 Analysis of the number of charging stations
The impacts of the number of CSs on the CSSS, power deviation rate, and profit margin are analyzed to verify the relevant conclusions given in Section 5.2. Taking five CSs and eight CSs as examples, the data of CSs are shown in Table 1.
5.3.1 Analysis of five CSs
Without considering the interaction of the real-time charging price, the initial CSSS and the market share of five CSs are shown in Figure 6. It was notes that the density of CSs in the western region is relatively high. CS1, CS3, and CS4, due to their close distribution and fierce market competition, have a limited CSSS, and their market share is 13.8%, 14.4%, and 14%, respectively. However, only CS2 and CS5 exist in the eastern region, and they are located far from the CSs in the west, resulting in less competition. Therefore, the CSSS of CS2 and CS5 is relatively large, and their market share is 22.2% and 35.6%, respectively.

Figure 6. Initial service scope of five charging stations.
The charging price and comprehensive strength of five CSs are calculated and shown in Table 3. It is found that CS4, with smaller comprehensive strength, has higher charging prices than the other CSs in each period. It can gain more profits by setting a higher charging price than the policy price. However, with higher comprehensive strength, CS1 and CS2 can obtain more charging demand and profit with a lower charging price.
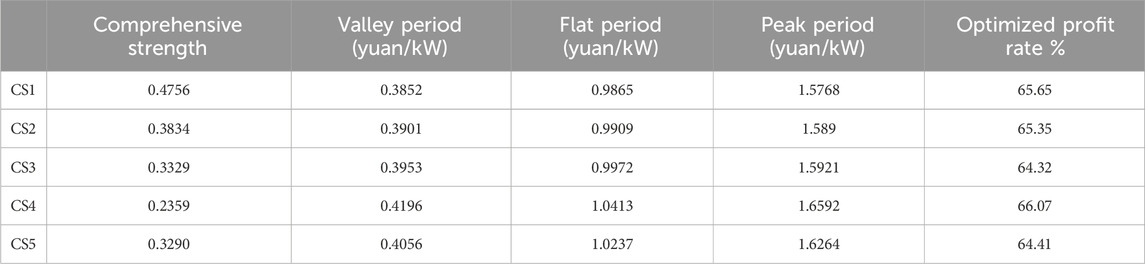
Table 3. Comprehensive strength and average charging price of five charging stations (CSs).
Similarly, three time points of 6:00, 10:00, and 18:00 are selected for simulation, and the number of CDAs occupied by each CS is shown in Figure 7. It is observed that the CSSS of CS3 increases 89 CDAs and the CSSS of CS4 decreases 207 CDAs with the increase in the charging price. The reason for such a great change is that CS3 and CS4 have weak comprehensive strength, and they are in the center of a region surrounded by many CSs.
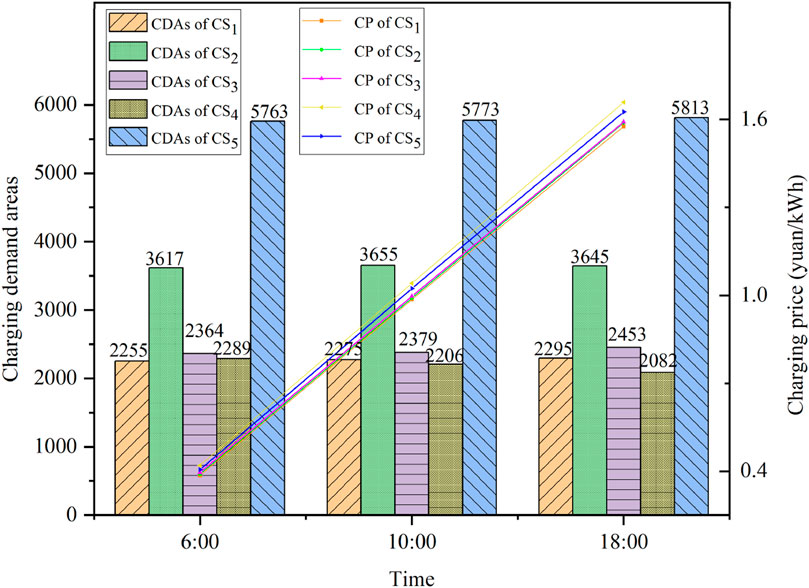
Figure 7. Number of charging demand areas and charging price of five charging stations.
5.3.2 Analysis of eight CSs
The initial CSSS of eight CSs is calculated, as shown in Figure 8. It can be seen that, interestingly, due to the strong comprehensive strength and the remote location, the market share of the CS1 is unchanged compared to the condition of the five charging stations. However, CS8 has the smallest comprehensive strength and is close to the other CSs, making the CDAs less competitive than other CSs, resulting in a very small CSSS, and its market share is only 0.2%.
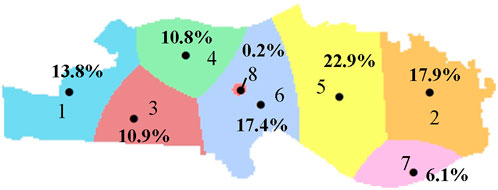
Figure 8. Initial service scope of eight charging stations.
The charging price and comprehensive strength of eight CSs are shown in Table 4. Due to higher user attention, CSs with larger comprehensive strength have lower real-time charging prices than policy electricity prices. However, CSs with smaller comprehensive strength will set higher real-time charging prices to ensure profits.
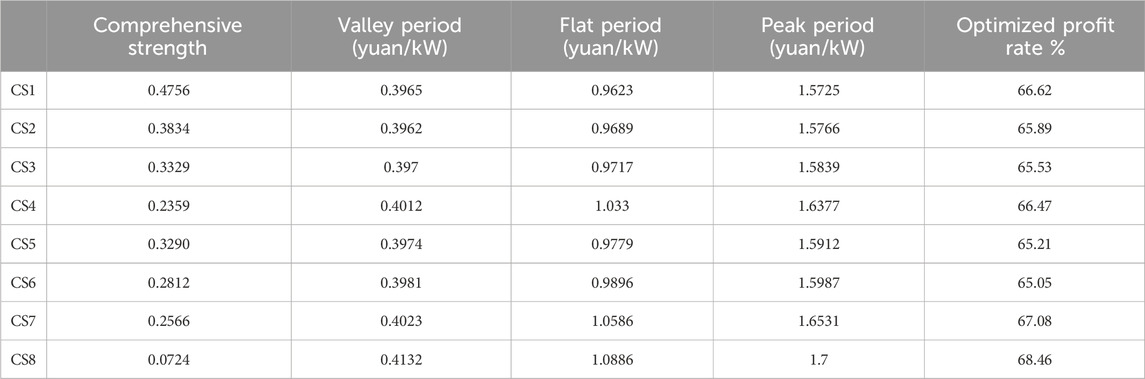
Table 4. Comprehensive strength and average charging price of eight charging stations (CSs).
The number of CDAs occupied by eight CSs is shown in Figure 9. With the increase in the number of CSs, market competition becomes increasingly fierce. Furthermore, the reduction in the distance between stations results in little difference in the CSSS, and CS5, with the largest CSSS, does not account for more than 4,000 CDAs. Meanwhile, due to the weak market competitiveness of CS7 and CS8, the CDAs of CS2, CS5, and CS6 account for more than half (58%). Compared to the scenario of five CSs, due to the addition of CS6, the number of CDAs of CS3 and CS4 has decreased, while CS1, with the strongest market competitiveness, has not been affected, and the CSSS has not changed. With the increase in the charging price, it is observed that the CSSS of CS4, CS7, and CS8 decreased due to the weak market competitiveness, and the CSSS of CS1, CS2, and CS5 increased due to the strong market competitiveness. In addition, the insignificant change in CSSS of CS3 and CS4 is mainly because they are in the center of a region surrounded by other CSs.
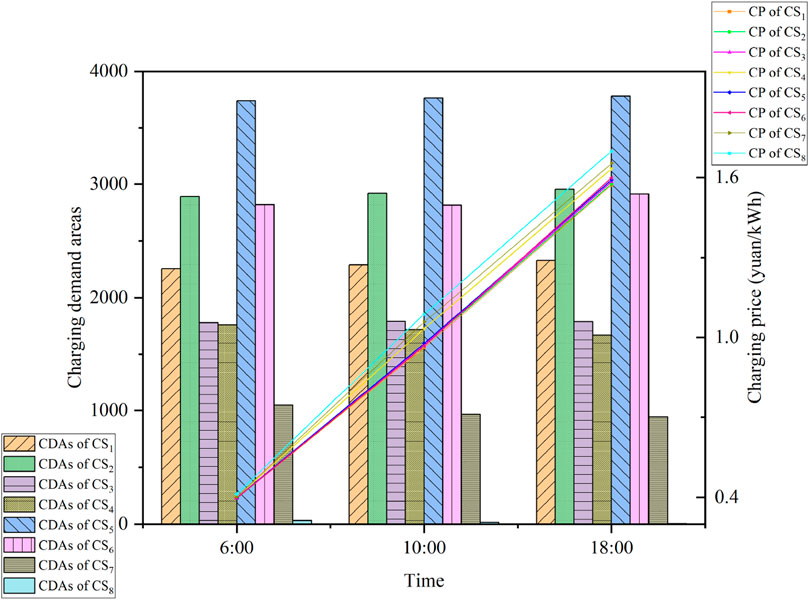
Figure 9. Number of charging demand areas and charging price of eight charging stations.
Table 5 presents the profit rate and power deviation rate of different CSs. It is noted that the profits obtained by the policy electricity price will decrease gradually with the increase in competitive CSs. Furthermore, when the number of CSs involved in real-time pricing optimization increases from 3 to 5 and 8, the profit margin increases by 2.60% and 4.05%, respectively; meanwhile, the power deviation decreases by 764 kW and 1,309 kW, respectively. That is because the increase in CSs expands the optimize adjustment space. Consequently, the total charging demand participating in optimization increases, and the profit distribution between CSs becomes more reasonable, which improves the CS profit rate significantly and reduces the power deviation of wind and photovoltaic power. However, for this case, the adjustment effect of power deviation is not obvious for all of Hunan Province because of the small number of CSs.
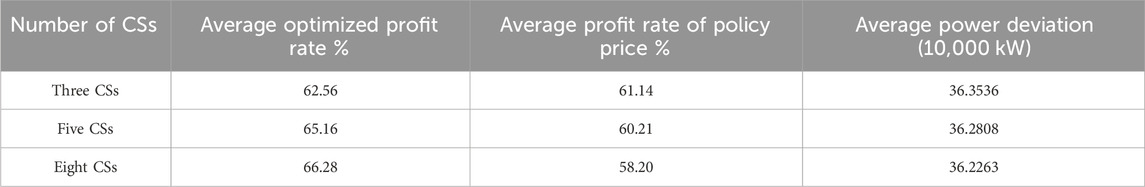
Table 5. Profit rate and power deviation rate of different charging stations (CSs).
6 Conclusion
A dynamic CSSS division model is proposed based on the strongest occupation method and pricing strategy in this paper. Notably, the variation in the CSSS is well simulated by the dynamic optimization of the charging price. Then, the relationship among the comprehensive strength, the charging price, and the charging demand is well reflected. Furong District of Changsha is simulated as an example, and the following conclusions are obtained:
1) Charging stations with greater comprehensive strength attract more attention from electric vehicle users, and users are more sensitive to the fluctuation of their charging price. Therefore, the charging station can obtain more profits by setting a lower charging price than the policy price.
2) The competition is more intense for areas with dense charging stations, and the CSSS change caused by charging price fluctuation is also more obvious. On the contrary, the CSSS is more stable with sparse charging stations, and the charging price fluctuation has less impact on the CSSS. It provides a reference for the construction of future charging facilities for operators.
3) With the increase in charging stations participating in the market competition, the profit based on the policy price will gradually decrease. Thus, the profit of charging stations should be improved by setting a real-time charging price based on the CSSS.
It should also be pointed out that the CSSS model should comprehensively consider the influence of regional differences, such as traffic conditions and geographic information, to improve the accuracy and authenticity of simulation results. Thus, the establishment of a complete CSSS model with the regional evaluation index system will be the next topic in future research.
Data availability statement
The original contributions presented in the study are included in the article/Supplementary Material; further inquiries can be directed to the corresponding author.
Author contributions
XY: Formal analysis, Writing–original draft. XT: Methodology, Writing–review and editing. YC: Validation, Writing–review and editing. JW: Data curation, Software, and Writing–original draft. YT: Visualization and writing–review and editing
Funding
The author(s) declare that financial support was received for the research, authorship, and/or publication of this article. This research was funded by the National Natural Science Foundation of China (grant numbers 52277076 and 52307081). Hunan Provincial Nature Science General Project (grant number S2024JJMSXM1107). Excellent Youth Program of Hunan Provincial Department of Education (grant number 23B0334)
Conflict of interest
Author YT was employed by State Grid Hunan Electric Power Company Limited.
The remaining authors declare that the research was conducted in the absence of any commercial or financial relationships that could be construed as a potential conflict of interest.
Publisher’s note
All claims expressed in this article are solely those of the authors and do not necessarily represent those of their affiliated organizations, or those of the publisher, the editors, and the reviewers. Any product that may be evaluated in this article, or claim that may be made by its manufacturer, is not guaranteed or endorsed by the publisher.
Supplementary material
The Supplementary Material for this article can be found online at: https://www.frontiersin.org/articles/10.3389/fenrg.2024.1378016/full#supplementary-material
References
Anna, B., Maurizio, C., and Davide, V. (2019). Scale and (quasi) scope economies in airport technology. An application to UK airports. Transp. Res. Part A Policy and Pract. 125 (C), 150–164. doi:10.1016/j.tra.2019.05.013
Ca, M. M., Grzanic, M., Pavic, I., Pandžić, H., and Capuder, T. (2022). The effects of household automation and dynamic electricity pricing on consumers and suppliers. Sustain. Energy, Grids Netw. 32, 100931. doi:10.1016/j.segan.2022.100931
Chen, C. S., Xiao, L. L., Duan, S. X., and Chen, J. (2019a). Cooperative optimization of electric vehicles in microgrids considering across- time- and- space energy transmission. IEEE Trans. Industrial Electron. 66 (2), 1532–1542. doi:10.1109/tie.2017.2784410
Chen, J., Huang, X. Q., Tian, S. M., Cao, Y., Huang, B., Luo, X., et al. (2019b). Electric vehicle charging schedule considering user's charging selection from economics. IET Generation, Transm. Distribution 13 (15), 3388–3396. doi:10.1049/iet-gtd.2019.0154
Chen, Y. T., Zeng, X. Z., and Wang, J. X. (2017). Airport service scope research based on improved Wilson model. J. East China Jiaot. Univ. 34 (05), 56–64. doi:10.16749/j.cnki.jecjtu.2017.05.009
China News Network (2023). China electric vehicle charging infrastructure promotion alliance: rapid growth of China's charging infrastructure. http://www.ce.cn/xwzx/gnsz/gdxw/202301/12/t20230112_38343857.shtml.
Dai, D. (2018). Selection of central cities and influence area of Yangzi River city cluster based on gravitational model. Sci. Technol. Perspect. (28), 290–292.
Gong, L. L., Cao, W., Liu, K. L., and Zhao, J. (2020). Optimal charging strategy for electric vehicles in residential charging station under dynamic spike pricing policy. Sustain. Cities Soc. 63 (0), 102474. doi:10.1016/j.scs.2020.102474
ITF Comprehensive electrification and global cooperation under the vision of carbon neutrality. World new energy vehicle congress, Hainan and virtual, August, 2022, 2022,
Khan, K., Sayed, I. E., and Arboleya, P. (2022). Multi-issue negotiation evs charging mechanism in highly congested distribution networks. IEEE Trans. Veh. Technol. 71 (6), 5743–5754. doi:10.1109/tvt.2022.3175266
Lai, S. Y., Qiu, J., Tao, Y. C., and Zhao, J. (2023). Pricing for electric vehicle charging stations based on the responsiveness of demand. IEEE Trans. Smart Grid 14 (1), 530–544. doi:10.1109/tsg.2022.3188832
Li, Y. B., Wang, J. N., Wang, W. Y., and Liu, C. (2023a). Dynamic pricing based electric vehicle charging station location strategy using reinforcement learning. Energy 281, 128284. doi:10.1016/j.energy.2023.128284
Li, Z., Liu, L., Ding, L., Wang, J. Y., Zhang, S. H., Chen, X. X., et al. (2023b). Scenario-based charging infrastructure planning based on tyson' s multilateral graph. Power Syst. Clean Energy 39 (3), 131–135.
Liu, H. C. (2022). World new energy vehicle conference: faster, farther, and smarter. Product. Reliab. Rep. 2022, 08. (in Chinese).
Liu, S. Q., Cui, W., and Zhang, L. (2019). Research on enterprise bidding mode selection and control strategy. Clust. Comput. 22 (6), 14269–14276. doi:10.1007/s10586-018-2285-x
Shinde, P., and Shanti, S. K. (2018). Stackelberg game-based demand response in multiple utility environments for electric vehicle charging. IET Electr. Syst. Transp. 8 (3), 167–174. doi:10.1049/iet-est.2017.0046
Wang, J. Y., Bharati, G. R., Paudyal, S., Ceylan, O., Bhattarai, B. P., and Myers, K. S. (2019). Coordinated electric vehicle charging with reactive power support to distribution grids. IEEE Trans. Industrial Electron. 15 (1), 54–63. doi:10.1109/tii.2018.2829710
Wang, S. Y., Bi, S. Z., and Zhang, Y. J. (2021). Reinforcement learning for real-time pricing and scheduling control in ev charging stations. IEEE Trans. Industrial Inf. 17 (2), 849–859. doi:10.1109/tii.2019.2950809
Wilson, A. G. (1972). Entropy in urban and regional modeling [J]. Economic Geography 48 (4), 364–394.
Wu, J. Q., He, R., Li, X., and Gao, T. (2016). Research on the radiation range of logistics park based on improved breakpoint model. Logist. Eng. Manag. 38 (11), 13–16+31.
Yang, H. R., Xu, Y. L., and Guo, Q. L. (2023). Dynamic incentive pricing on charging stations for real-time congestion management in distribution network: an adaptive model-based safe deep reinforcement learning method. IEEE Transaction Sustain. Energy 10, 1–13. doi:10.1109/tste.2023.3327986
Yang, X. L., Niu, D. X., Sun, L. J., Ji, Z., Zhou, J., Wang, K., et al. (2021). A bi-level optimization model for electric vehicle charging strategy based on regional grid load following. J. Clean. Prod. 325, 129313. doi:10.1016/j.jclepro.2021.129313
Yang, X. Y., Guo, X. P., Li, Y., and Yang, K. (2022). The sequential construction research of regional public electric vehicle charging facilities based on data-driven analysis—empirical analysis of Shanxi Province. J. Clean. Prod. 380 (1), 134948. doi:10.1016/j.jclepro.2022.134948
Zhang, X. M., Hong, R. Y., Wang, R. J., and Wei, N. (2010). Research on the service capacity of regional logistics parks based on Wilson model. Logist. Technol. 29 (Z1), 41–43.
Zhou, Z., Liu, Z. T., Su, H., and Zhang, L. (2023a). Planning of static and dynamic charging facilities for electric vehicles in electrified transportation networks. Energy 263, 126073. doi:10.1016/j.energy.2022.126073
Zhou, Z., Liu, Z. T., Su, H. Y., and Zhang, L. (2022). Integrated pricing strategy for coordinating load levels in coupled power and transportation networks. Appl. Energy 307, 118100. doi:10.1016/j.apenergy.2021.118100
Keywords: charging stations, service field strength, service scope, real-time pricing strategy, strongest occupation method
Citation: Yang X, Tang X, Chen Y, Wu J and Tan Y (2024) Charging station service scope division and real-time pricing strategy based on the strongest occupation method. Front. Energy Res. 12:1378016. doi: 10.3389/fenrg.2024.1378016
Received: 29 January 2024; Accepted: 20 March 2024;
Published: 22 April 2024.
Edited by:
Yitong Shang, Hong Kong University of Science and Technology, Hong Kong SAR, ChinaReviewed by:
Youjun Deng, Southwest Petroleum University, ChinaHaoasn Yang, Hong Kong Polytechnic University, Hong Kong SAR, China
Wenlong Liao, Swiss Federal Institute of Technology Lausanne, Switzerland
Copyright © 2024 Yang, Tang, Chen, Wu and Tan. This is an open-access article distributed under the terms of the Creative Commons Attribution License (CC BY). The use, distribution or reproduction in other forums is permitted, provided the original author(s) and the copyright owner(s) are credited and that the original publication in this journal is cited, in accordance with accepted academic practice. No use, distribution or reproduction is permitted which does not comply with these terms.
*Correspondence: Xiafei Tang, eGlhZmVpLnRhbmdAY3N1c3QuZWR1LmNu