 Runtao Zhang
 Lei Wang1,2
- 1State Grid Hebei Electric Power Research Institute, Shijiazhuang, China
- 2Hebei Key Laboratory of Simulation Modeling and Control for Energy Internet, Shijiazhuang, China
- 3State Key Laboratory of Alternate Electrical Power System with Renewable Energy Sources, North China Electric Power University, Baoding, China
Distributed photovoltaic systems can actively contribute to the primary frequency regulation of the power grid by reserving capacity. Traditional power reduction methods often employ fixed load reduction ratios, potentially resulting in inadequate frequency regulation capacity and unnecessary reserve power. This paper centers on optimizing power reserve control, starting with the construction of a two-stage model for a photovoltaic grid-connected inverter power generation system. It includes the design of a maximum power estimation method and the implementation of photovoltaic power reduction operation. The article proposes a strategy to utilize photovoltaic backup capacity for achieving primary frequency modulation effects in a short time scale. Additionally, it adopts a variable power reserve ratio operation strategy over the long term, aiming to enhance photovoltaic power generation and optimize solar energy utilization without compromising the grid’s frequency and quality. Finally, a MATLAB/Simulink model is developed to validate the effectiveness of the control strategy. Simulation results indicate that the proposed strategy satisfies frequency regulation requirements, enhances power generation efficiency, and improves the economic viability of photovoltaic operations.
1 Introduction
In recent years, amid the pursuit of the “dual carbon” goal, the rapid development of new energy generation, particularly wind and photovoltaic power, has unfolded. As these sources become increasingly integrated into the power grid, they play a pivotal role in diminishing reliance on fossil fuels and fostering environmental conservation. However, the rise of new energy sources coincides with a decline in the share of traditional energy derived from hydroelectric and thermal power generation units. This shift results in a reduction of rotating reserve capacity and moment of inertia within the power system (Lv et al., 2014). Nevertheless, the integration of new energy units into the grid typically involves the use of power electronic devices, such as inverters, which are unable to provide the traditional inertia characteristic. Consequently, the emerging power system exhibits the attribute of “low inertia,” posing new challenges and issues for the secure and stable operation of the power grid (Zhao et al., 2011). Simultaneously, since photovoltaic units often operate in Maximum Power Point Tracking (MPPT) mode to enhance energy utilization (Wang et al., 2018), there is a lack of excess frequency regulation resources. In instances of frequency fluctuations, photovoltaics cannot partake in primary frequency regulation and must rely on the gradual reduction of output from traditional units. This dependence inevitably leads to heightened frequency fluctuations, posing a threat to the safety of the system’s frequency.
To address the aforementioned challenges, enabling photovoltaics to actively engage in the primary frequency regulation of the power grid is imperative. This involves allocating a specific backup capacity for photovoltaics. Currently, there are two predominant approaches in the global academic community to achieve this objective. One method involves the incorporation of energy storage components for photovoltaics, creating a Virtual Synchronous Generator (VSG). This setup emulates traditional rotary synchronous generators by leveraging the external characteristics of photovoltaics (National Energy Administration, 2018). The resulting VSG exhibits high inertia and robust damping characteristics, allowing photovoltaics to autonomously contribute inertial support to the system without relying on frequency controllers. The alternative approach is the implementation of photovoltaic power reserve operation. This method enables the photovoltaic system to output power based on a predetermined ratio of reserved fixed capacity or maximum power (Xie et al., 2021). Given the relatively high cost and suboptimal economic efficiency of energy storage equipment (Zhang et al., 2021), coupled with the widespread occurrence of “light curtailment” in photovoltaic power stations (Guo et al., 2020), photovoltaic power reserve operation strategically utilizes the generated electricity from this “abandoned light.” Therefore, this article primarily focuses on the involvement of photovoltaic power reserve operation in the primary frequency regulation of the power grid.
In the context of primary frequency regulation, reference (Zhang et al., 2019) conducted an analysis of the photovoltaic grid-connected power generation system utilizing DC voltage sag control through the electrical torque method. The study demonstrated that the energy storage effect of capacitors on medium and short time scales could confer certain inertia characteristics to the system. Notably, the photovoltaic modules operated in MPPT mode, without accounting for reserving spare capacity for participation in primary frequency regulation. Reference (Wu et al., 2022) suggests augmenting frequency control through the addition of an integral loop to the traditional primary frequency modulation droop control. While this approach enhances the support of photovoltaics for grid frequency, it necessitates parameter readjustment in response to changing environmental conditions, limiting its universality. In contrast, reference (Li, 2022) introduces an adaptive droop control based on quantized minimum error entropy and an improved universal gravity search algorithm. This method aims to enhance the primary frequency modulation effect of the system and mitigate frequency deviations induced by disturbances. By optimizing the droop control coefficient in real-time, it improves the system’s frequency response. Reference (Zhang et al., 2020) proposes a function with irradiance as the independent variable and the droop coefficient as the dependent variable, allowing the droop coefficient to adapt to external irradiance conditions. However, the provided example only considers working conditions with irradiance exceeding 1,000.
In the realm of optimizing power reserve, a majority of pertinent literature has predominantly concentrated on the domain of wind power. Reference (Wang and Yuvan, 2024) introduced an evaluation function grounded in power generation and frequency regulation capability, ultimately deriving the optimal power reserve ratio curve under full wind speed conditions. By integrating wind speed predictions, a dynamically adjustable power reserve ratio was achieved. Similarly, reference (Xu et al., 2021) established a power reserve benefit function, employing the particle swarm optimization algorithm to determine the optimal power reserve ratio across diverse scenarios. The ratio was dynamically adjusted based on varying load levels. Currently, there is a dearth of an evaluation system for determining the optimal power reserve level specifically for photovoltaics. This is intricately linked to various environmental factors such as irradiance and temperature. Consequently, fixed power reserve ratios or static power reserve powers are often employed for photovoltaic power reserve operations, but this approach sacrifices adaptability to changing environmental conditions.
The initial segment of this paper discusses the implementation of photovoltaic power reserve operation, as introduced in reference (Zhou, 2021). This method empowers photovoltaic modules to modify the power reserve level using a predefined numerical curve for the power reserve ratio. The subsequent section elucidates the primary frequency regulation strategy outlined in this article. It integrates droop control and virtual inertial control to enhance the system’s frequency response during short-term load fluctuations. The third section introduces an optimization function for the power reserve ratio, influenced by light intensity and load level. This aims to refine frequency characteristics, augment total photovoltaic power generation, and conserve synchronous machine output over an extended duration. Finally, the fourth segment constructs a synchronous machine photovoltaic microgrid model using Matlab/Simulink. It validates the effectiveness of the proposed control strategies in this paper across both short-term and long-term scales.
2 PV load reduction control strategy
2.1 Maximum photovoltaic power estimation
The crux of photovoltaic power reduction operation lies in the real-time estimation of its maximum power. Accurate control of photovoltaic power reduction operations, contingent upon load reduction levels, hinges upon the prior estimation of the photovoltaic system’s maximum power. The following elucidates the principles and steps involved in implementing photovoltaic power reserve operation in this article.
2.1.1 Offline model of photovoltaic array
The photovoltaic array model employed in this study adopts the widely used five-parameter single diode model. The equivalent circuit principle is illustrated in Figure 1, and the corresponding mathematical expressions are presented in Eqs 1–5.
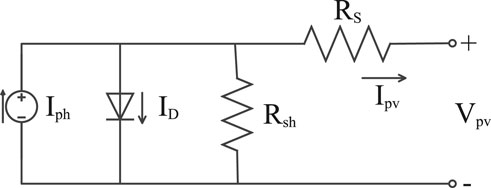
Figure 1. Equivalent circuit of the solar cell.
In these equations, Ipv is the PV output current; Iph is the photogenic current; I0 is the diode reverse saturation current; q is the electron charge, q = 1.6 × 10⁻¹⁹°C; k is Boltzmann’s constant; Vpv is the PV output voltage; RS is the series resistance; Rsh is the parallel resistance; A is the ideal diode factor; S is the irradiance; Voc and Isc are the PV array open-circuit voltage and short-circuit current; SSTC = 1,000 W/m2 and TSTC = 25°C are the standard test conditions; Isc,STC and Voc,STC are the short-circuited current and the open-circuit voltage under standard test conditions, respectively; and α and β are the thermal correlation coefficients.
2.1.2 Linear expression for maximum power short-circuit current
Reference (Kato T et al., 2018) suggests the existence of an approximately linear functional relationship between the maximum power Pmap of photovoltaics under specific conditions and the short-circuit current Isc under these conditions, as illustrated in Eq. 6:
where km is the fitting coefficient.
The photovoltaic cell model utilized in this example is the SunPower SPR-305E-WHT-D, featuring 66 parallel cells, 5 series cells, and a rated power of 100725 W. For the purpose of analysis, the parameters of the photovoltaic cell are detailed in Table 1. Maintaining a constant temperature of T = 25°C, the irradiance gradually increases from 50 W/m2 to 1,200 W/m2 at intervals of 50 W/m2. Offline data for short-circuit current and maximum power under various irradiance conditions are measured. Through the use of curve-fitting tools for linear regression on the acquired data, a value of km = 253.5 is obtained. Throughout the fitting process, the maximum fitting error is 0.020355, and the root mean square error is 0.00207482, indicating a robust linear relationship between the maximum photovoltaic power and short-circuit current.
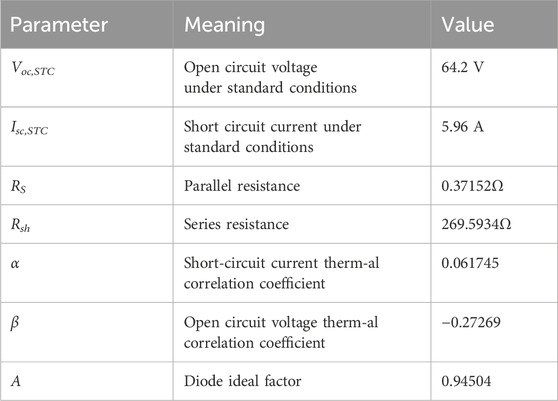
Table 1. Photovoltaic cell parameters.
2.1.3 Maximum power estimation expression
To reserve a certain amount of active power, photovoltaic power generation should operate at a deviation from the maximum power point. This article employs a proportional power reserve method and defines the target power reserve ratio as r*%, expressed as Eq. 7:
where Pmap represents the maximum power of a photovoltaic array, and its magnitude is influenced by external irradiance and temperature; Pr*% denotes the target power reserve point power.
To estimate the short-circuit current, we introduce a new intermediate variable Ir*%/Isc and explore its relationship with the target power reserve ratio r*%. Here, Ir*% represents the current corresponding to the specified power reserve ratio r*%, i.e., the target power reserve point current.
Here is the segmented fitting relationship for Ir*%/Isc as follows in Eq. 8:
In the above equation, when r*%>1, the Ir*%/Isc-r*% curve is a linear function. The value of Ir*%/Isc-r*%, at r*% = 0.1, can be determined through offline experimental testing. Subsequently, in conjunction with another data point r*%<=1, Ir*%/Isc = 1, the values of a4 and a5 can be derived. For the nonlinear curve with r*%<=1 in the functional relationship, measure the Ir*%/Isc values corresponding to the target load reduction ratios r*% of 0, 0.025, 0.05, 0.075, and 0.1, respectively, to construct an offline data table. Employ curve-fitting tools to perform linear regression on the data in the table to obtain the coefficients a0∼a3. Throughout the fitting process, the maximum fitting error is 0.00161, and the root mean square error is 0.000894. Therefore, it can be considered that the piecewise function in Eq. 8 exhibits a favorable fitting effect.
After modifying Eq. 8, the resultant expression for short-circuit current estimation is as follows in Eq. 9:
The expression for maximum power estimation derived from simultaneous Eqs 6, 9 is as follows in Eq. 10:
The specific values of each parameter in Eq. 10 are presented in Table 2. When applying this relationship in practice, estimate the sampling point current Ipv by substituting it into Eq. 10.
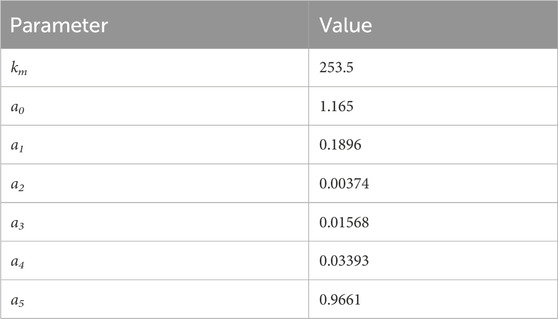
Table 2. The specific values of each parameter in Eq. 10.
2.2 Power reserve control and voltage tracking
Upon obtaining the estimated maximum power Pest following Eq. 10, power reserve control is applied to achieve the targeted power reserve ratio for the photovoltaic system. Reference (Zhou, 2018) details an enhanced mountain climbing method for real-time voltage tracking; however, it utilizes a fixed step size, potentially leading to voltage fluctuations. To mitigate such fluctuations, this paper introduces a variable-step voltage tracking strategy with real-time iteration capability. The procedural steps of the flowchart are outlined in Figure 2.

Figure 2. The control flow chart of the power reserve control.
After the photovoltaic system is initiated, the current output voltage Vpv, output current Ipv, and the pre-set target power reserve ratio r*% are collected. In this procedure, the maximum power estimation value Pest at the current moment is determined according to Eq. 10. When combined with the calculated photovoltaic array output power Ppv, the current power reserve ratio rest% can be obtained. This is given in Eq. 11.
There still exists a deviation between the current power reserve rate rest% and the target power reserve ratio r*%, expressed as in Eq. 12:
This article employs a voltage controller to achieve tracking of the target operating point. Eq. 12 is utilized as the deviation for voltage tracking, and a variable step voltage tracking control strategy is adopted to mitigate power fluctuations. The design is outlined as follows in Eqs 13, 14:
where Vpvref is the voltage reference value of the controller; γ is the proportion coefficient for the variable step size; Vcons is a fixed voltage control step size. In the model presented in this article, the initial value of Vpvref is set to 150 V, γ is taken as 100, and Vcons is set to 0.01 V.
3 Primary frequency modulation control strategy based on power reserve control
This article employs a two-stage photovoltaic power generation system as an illustrative example to elucidate the proposed control strategy. The topology structure and overall control diagram are depicted in Figure 3. In Figure 3, S represents ambient light intensity, T signifies ambient temperature, Cpv denotes the photovoltaic-side capacitor, Cdc is the DC-side capacitor, Lg stands for the filtering inductance, Cf represents the filtering capacitor, ugabc is the grid-connected voltage, igabc is the grid-connected current, and f is the grid frequency measured through a phase-locked loop (PLL). In this example, Cdc = 2.5 mF, Cf = 8 μF, Lg = 5 mH.
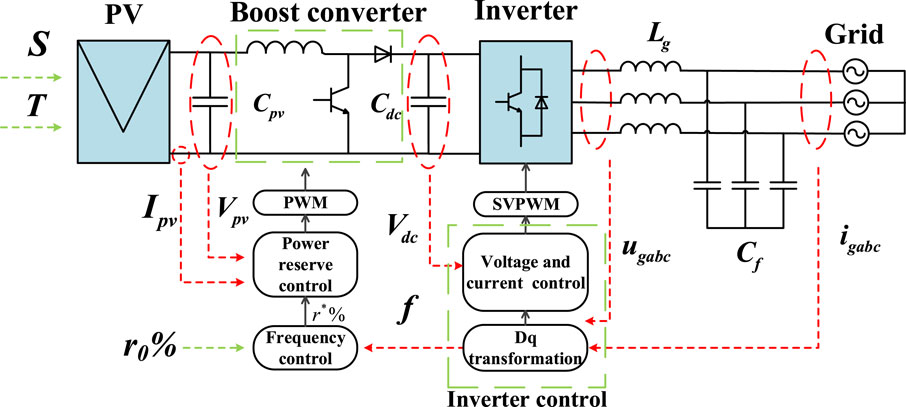
Figure 3. Structure block diagram of the proposed control strategy.
The control strategy presented in this article is primarily divided into three components: frequency control, power reserve control, and inverter control. In the inverter control segment, the collected ugabc and igabc are decoupled using Park transformation. The traditional voltage and current dual closed-loop control strategy is then employed for the decoupled signals, ensuring the stability of DC voltage and inverter current.
The role of the frequency control section is to relay the target power reserve ratio r*% received from the power reserve control section based on changes in the grid frequency measured by the phase-locked loop. This allows the photovoltaic power generation system to exhibit a primary frequency modulation response akin to that of traditional power generation units. To endow photovoltaic systems with droop and inertia characteristics resembling synchronous machines, this paper adopts the frequency control strategy diagram depicted in Figure 4. The control block diagram encompasses both droop control and inertial control, with the expression for the target power reserve ratio r*% as follows in Eq. 15:
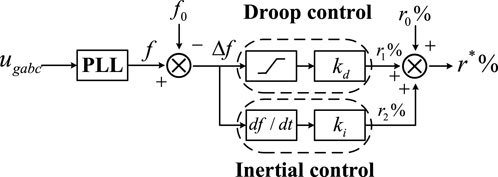
Figure 4. Primary frequency regulation control strategy for PV.
In Figure 4, f0 denotes the rated frequency of the power grid, set at 50 Hz; kd represents the sag coefficient, which is set to 1.3 in this article; ki is the inertia coefficient, established as 0.08 in this article; r0% denotes the given initial power reserve ratio, set at 10% in this article; r1% and r2% are the deviation values of the load reduction ratio caused by droop control and inertia link, respectively. The r*% is derived by adding the initial power reserve ratio r0% to the deviation values r1% and r2% of the power reserve ratio. It serves as the reference value for the power reserve ratio and acts as the input for the power reserve control section. When the grid frequency f deviates from the rated frequency f0, a frequency deviation occurs, leading to a droop power reference power reserve ratio r1% and an inertia power reference power reserve ratio r2%. This results in the generation of a new reference power reserve ratio r*% enabling the photovoltaic system to track this new reference power reserve ratio.
The power reserve control segment employs the iterative process illustrated in the flowchart in Figure 2. Through the close coordination of the frequency control and power reserve control components, the ultimate objective of having photovoltaic modules output power reserve power towards the target is achieved.
4 Variable power reserve ratio setting
4.1 National standard
To advance the development of photovoltaic virtual synchronous generators, the State Grid of China issued the “Technical Guidelines for Virtual Synchronous Generators” (State Grid Corporation of China, 2016a) and the “Technical Requirements and Test Methods for Unitary Photovoltaic Virtual Synchronous Generators” (State Grid Corporation of China, 2016b). These regulations hold guiding significance for the photovoltaic units operating under power reserve in this article. In the specifications concerning the primary frequency regulation function, it is stipulated that assuming the rated power of the photovoltaic system is Pn, when the system frequency decreases, the virtual synchronous generator should increase the active output in response to the system frequency change. The maximum adjustable amount of active output should be at least 10% of Pn. Conversely, when the frequency increases, the virtual synchronous generator should reduce the active power output, with the maximum reduction amount being at least 20% of Pn. Once it reaches 20% of Pn, it can no longer continue to adjust downwards.
While photovoltaic power reduction and load reduction operations maintain active power reserve similar to traditional synchronous machines, they also result in the wastage of photovoltaic energy and a reduction in the overall power generation of the photovoltaic system. Essentially, this entails trading a portion of sunlight for the frequency regulation capability of the photovoltaic system. In light of this, the National Energy Administration has laid out specific requirements for wind and solar power curtailment: in the pursuit of advancing clean energy development, the consumption of clean energy should decrease annually, and the proportion of wind and solar power curtailment and power rationing should be minimized. Specifically, the curtailment rates for wind, solar, and hydropower in the Three North regions should be kept below 10%, while in other regions, the curtailment rates should be below 5%. This aims to fundamentally address the issue of wind and solar power curtailment.
The determination of backup power size should consider both frequency regulation capability and light curtailment factors. Regarding the stipulations for primary frequency regulation of virtual synchronous generators, it is emphasized that active power regulation should be at least 10% of Pn, with a maximum curtailment limit of 10% in the Three North region and 5% in other regions for wind and light curtailment. In summary, this article establishes a benchmark power reserve ratio of 10%, satisfying both the minimum requirements for active power output in primary frequency regulation and the limits for abandoned light.
4.2 Variable power reserve ratio function based on light intensity and load level
To enhance the long-term power generation efficiency of photovoltaics and address the power redundancy issue associated with fixed power reserve ratios, this section proposes a variable power reserve ratio function based on light intensity and load level. Light intensity plays a decisive role in the output of photovoltaic power plants due to its correlation with environmental factors. Hence, the establishment of power reserve ratios needs to account for the impact of variations in light intensity. When light intensity increases, photovoltaic output rises. Consequently, the power reserve ratio should be increased to curtail photovoltaic power generation in the prevailing environment, mitigating the frequency elevation resulting from the augmented power. Conversely, when light intensity decreases, photovoltaic output diminishes. In such instances, the power reserve ratio should be reduced to augment photovoltaic power generation, addressing the frequency reduction induced by power curtailment. Based on this analysis, defining a variable power reserve ratio curve over an extended time scale can alleviate frequency fluctuations stemming from changes in irradiance conditions.
In contrast, traditional power reserve control does not account for the system load situation, leading to poor flexibility and reduced power generation efficiency. This section incorporates considerations for load levels. When the system load is low, a higher power reserve ratio can be implemented to curtail the output of photovoltaic units, augmenting additional active power reserves. Conversely, when the system load is high, a lower power reserve ratio can be adopted to boost active power output and achieve a balance in success ratio. Based on this analysis, it is imperative to comprehensively consider the impact of changes in load levels when defining the power reserve ratio curve for variations over an extended period.
Considering the analyses above, this article proposes the variable power reserve ratio function for photovoltaic power stations as follows in Eq. 16:
In Eq. 16, S represents the predicted future illumination intensity based on the illumination intensity at a specific time, PL is the instantaneous load of the system at the same future time in the daily load curve predicted by load forecasting, and Pav is the average load of that day. By configuring the variable load reduction rate in Eq. 16, the frequency regulation performance of the photovoltaic unit is maintained without compromise, while simultaneously improving power generation efficiency and economic performance. Essentially, it involves striking a balance between photovoltaic output and the output of traditional units.
5 Case study
5.1 Case description
This article relies on MATLAB/Simulink simulation software and constructs a simulation system illustrated in Figure 5. The system comprises a photovoltaic power plant with a rated power of 100 kW, a synchronous generator set with a rated power of 200 kW (comprising a synchronous generator, turbine, and speed control system), and a load PL. The efficacy of the power reserve control, primary frequency modulation, and variable power reserve ratio strategies proposed in this article will be validated through three simulation scenarios.
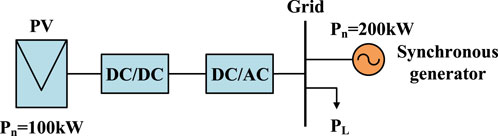
Figure 5. Structure diagram of simulation.
5.2 Sudden load changes on a short-term scale
The simulation scenario maintains the light intensity S at a constant level of 1000 W/m2 and the temperature T at 25°C. The initial power reserve ratio r0% is set to 10%. At the 8th second of system operation, the load PL undergoes a sudden increase of 8 kW. Before this abrupt change, the steady-state frequency of the power grid was 50 Hz. The simulation results are presented in Figure 6.
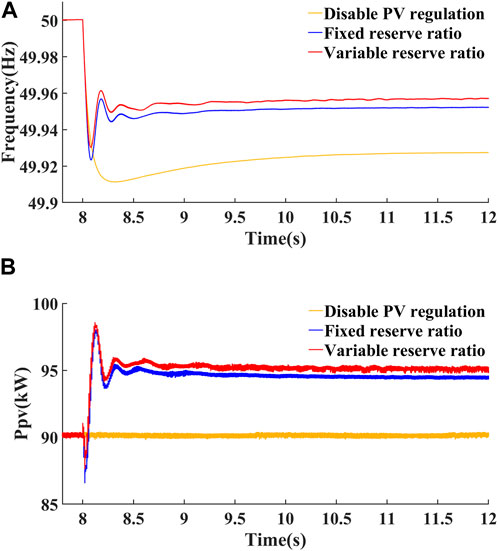
Figure 6. Simulation result chart for sudden increase in load.
Figure 6 compares the simulation results of three control strategies employed by the system in response to frequency reduction caused by a sudden increase in load. From Figure 6A, it can be observed that when the photovoltaic system does not engage in frequency regulation, the lowest point of the grid frequency drop is 49.916 Hz, and the steady-state frequency is 49.928 Hz. When the photovoltaic system participates in frequency regulation and employs a fixed power reserve ratio, the lowest point of the grid frequency drop is 49.924 Hz, and the steady-state frequency is 49.953 Hz. When the photovoltaic system participates in frequency regulation and adopts a variable power reserve ratio, the lowest point of the grid frequency drop is 49.931 Hz, and the steady-state frequency is 49.957 Hz. As shown in Figure 6B, when the photovoltaic system does not partake in frequency regulation, its output power remains nearly constant at the given power reserve power, and the power stabilizes around 90 kW. When the photovoltaic system engages in frequency modulation and adopts a fixed power reserve ratio, due to the frequency decrease, the reference power reserve ratio correspondingly decreases in the primary frequency modulation stage, leading to an increase in photovoltaic output power, which stabilizes around 94.5 kW. When the photovoltaic system engages in frequency regulation and adopts a variable power reserve ratio, the photovoltaic output power stabilizes around 95.1 kW.
Similarly, by maintaining the light intensity S at a constant level of 1000 W/m2, keeping the temperature T at 25°C, and leaving the initial power reserve ratio r0% unchanged at 10%, the system experiences a sudden decrease of 8 kW in load PL at the 8th second of operation. Prior to this sudden change, the steady-state frequency of the power grid was 50 Hz. The simulation results are depicted in Figure 7.
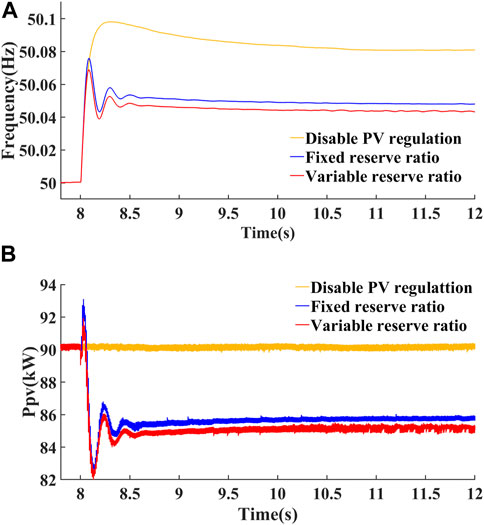
Figure 7. Simulation result chart during sudden load reduction.
Figure 7 compares the simulation results of three control strategies implemented by the system in response to frequency increase caused by a sudden reduction in load. As illustrated in Figure 7A, when the photovoltaic system does not engage in frequency regulation, the highest point of frequency increase in the power grid is 50.095 Hz, and the steady-state frequency is 50.08 Hz. When the photovoltaic system engages in frequency regulation and employs a fixed power reserve ratio, the highest point of frequency increase in the power grid is 50.075 Hz, and the steady-state frequency is 50.51 Hz. When the photovoltaic system engages in frequency regulation and adopts a variable power reserve ratio, the highest point of frequency increase in the power grid is 50.072 Hz, and the steady-state frequency is 50.48 Hz. As shown in Figure 7B, when the photovoltaic system does not partake in frequency regulation, its output power remains nearly constant at the given power reserve power, and the power stabilizes around 90 kW. When the photovoltaic system engages in frequency modulation and employs a fixed power reserve ratio, due to the increase in frequency, the reference power reserve ratio increases correspondingly in the primary frequency modulation stage, resulting in a reduction in photovoltaic output power that stabilizes around 85.7 kW. When the photovoltaic system engages in frequency regulation and adopts a variable power reserve ratio, the photovoltaic output power stabilizes around 85.1 kW.
In summary, by implementing the primary frequency regulation strategy proposed in this article, the system promptly adjusted its output to engage in frequency regulation when confronted with frequency changes resulting from sudden load variations. This adjustment improved frequency fluctuations and laid the groundwork for subsequent secondary frequency regulation, thereby validating the feasibility of the proposed strategy in the short time scale.
5.3 Fluctuations in irradiance and load on a long-term scale
In this scenario, the effectiveness of the variable power reserve ratio strategy is tested by considering long-term fluctuations in irradiance and load. Due to the memory constraints of the simulation software, the total simulation duration is limited to 60 s. For the first 10 s of the simulation, light intensity, temperature, load, and synchronous machine output are maintained at constant levels, allowing the system to operate stably at the rated frequency of 50 Hz. Starting from the 10th second, fluctuations in light intensity and load are introduced for a total duration of 50 s. The planned output of the synchronous machine is adjusted based on offline experimental data, and the irradiance curve and load curve are proportionally reduced according to actual measurement data from the photovoltaic power station and the daily load curve provided by the power grid company. The simulated time period from 10 s to 60 s corresponds to a specific day from 8:00 to 16:20 in real time. This time period is selected because only when the photovoltaic output exceeds 20% of the rated power, primary frequency regulation capability is required. During the rest of the time periods, the system operates in Maximum Power Point Tracking (MPPT) mode, and the photovoltaic output is higher between 8:00 and 16:20, meeting the conditions for having primary frequency regulation capability. The irradiance and load fluctuations introduced in the simulation are illustrated in Figure 8.
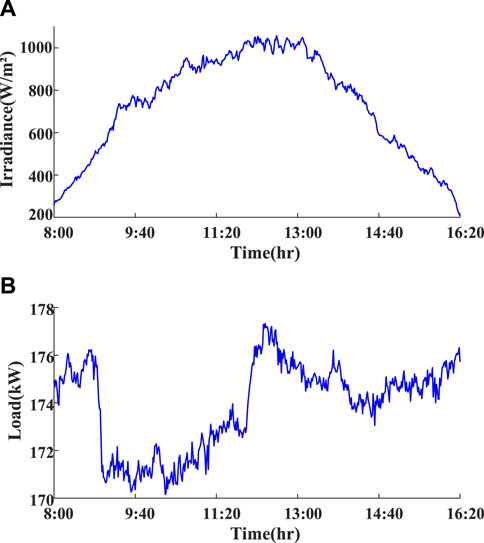
Figure 8. The variation curve of irradiance and load.
The simulation results are shown in Figure 9.
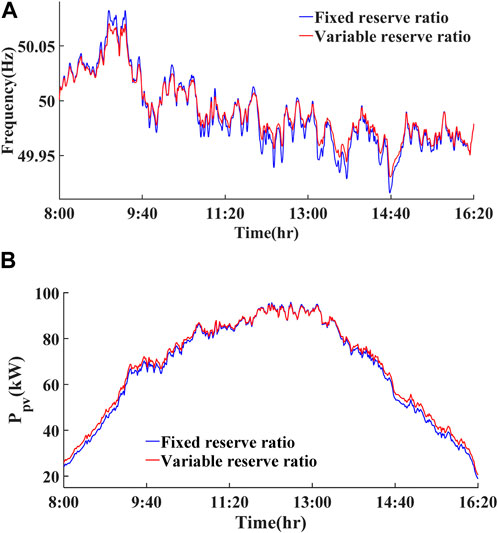
Figure 9. Simulation results on a long-term scale.
In Figure 9A, it is observed that in the scenario of long-term load and irradiance fluctuations, the frequency response curves of the photovoltaic system participating in frequency regulation using fixed and variable power reserve ratio strategies almost overlap. The maximum frequency deviation between the two curves is only 0.008163 Hz. Therefore, it can be generally inferred that the fixed power reserve ratio strategy does not significantly compromise the primary frequency regulation performance of the system when compared to traditional fixed power reserve ratio strategies. Figure 9B illustrates the comparison of photovoltaic power generation using different power reserve strategies in the system. The simulation results statistics for the two strategies are presented in Table 3. It can be observed that the adoption of the variable power reserve ratio strategy has led to an improvement in photovoltaic power generation compared to the traditional strategy, with an increase of approximately 4.26%.
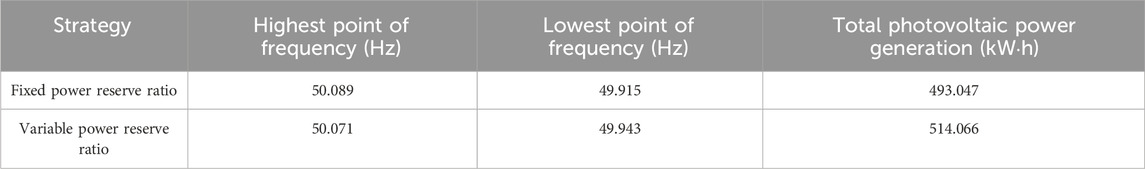
Table 3. Frequency and power Generation.
In summary, the variable power reserve ratio strategy has effectively achieved the intended objectives by enhancing the utilization of light energy and improving the system’s overall economic efficiency without compromising its frequency modulation performance.
6 Conclusion
This article introduces a primary frequency modulation strategy that combines droop control and inertial control on a short time scale. This approach enables the photovoltaic system to adjust its output in response to real-time reference power reserve ratios, effectively managing frequency changes caused by power imbalances. Additionally, a variable power reserve ratio function based on light intensity and load level has been proposed on a long-term scale. Compared to traditional strategies, this strategy has stronger primary frequency regulation capability and overall photovoltaic power generation has also been improved. It maximizes the use of clean energy, relieves the output pressure of traditional units, and improves the economic benefits of long-term operating scenarios.
Future research in this field could explore the impact of energy storage and supercapacitors on short-term frequency modulation effects. Additionally, efforts can be made to enhance and refine the elements considered in the variable power reserve ratio function. This may involve proposing clearer and quantifiable numerical indicators to further determine the optimal real-time power reserve ratio.
Data availability statement
The original contributions presented in the study are included in the article/Supplementary material, further inquiries can be directed to the corresponding author.
Author contributions
RZ: Conceptualization, Data curation, Methodology, Writing–original draft, Writing–review and editing. LW: Formal Analysis, Writing–original draft. SZ: Resources, Visualization, Writing–original draft, Writing–review and editing. ZC: Data curation, Methodology, Supervision, Writing–original draft, Writing–review and editing. CS: Conceptualization, Investigation, Software, Writing–original draft. ZL: Data curation, Validation, Writing–review and editing. HZ: Conceptualization, Formal Analysis, Investigation, Methodology, Writing–original draft, Writing–review and editing.
Funding
The author(s) declare financial support was received for the research, authorship, and/or publication of this article. This research is supported by the Science and Technology Project of State Grid Hebei Electric Power Co., Ltd. (kj 2023-015).
Conflict of interest
Authors RZ, LW, SZ, ZC and CS were employed by State Grid Hebei Electric Power Research Institute.
The remaining authors declare that the research was conducted in the absence of any commercial or financial relationships that could be construed as a potential conflict of interest.
The authors declare that this study received funding from State Grid Hebei Electric Power Co., Ltd. The funder had the following involvement in the study: help providing study design, preparing the manuscript and decising to publish.
Publisher’s note
All claims expressed in this article are solely those of the authors and do not necessarily represent those of their affiliated organizations, or those of the publisher, the editors and the reviewers. Any product that may be evaluated in this article, or claim that may be made by its manufacturer, is not guaranteed or endorsed by the publisher.
References
Guo, J., Tong, C., Balarko, C., Hui, S., and Yuen, R. (2020). Stability of isolated microgrids with renewable generation and smart loads. IEEE Trans. Sustain. Energy 11, 4. doi:10.1109/TSTE.2020.2980276
Kato, T., Kimpara, Y., Tamakoshi, Y., Kurimoto, M., Funabashi, T., and Sugimoto, S. (2018). An experimental study on dual P-f droop control of photovoltaic power generation for supporting grid frequency regulation. IFAC-PapersOnLine 51 (28), 622–627. doi:10.1016/j.ifacol.2018.11.773
Li, Q. (2022). Study on photovoltaic power generation participating in grid frequency regulation. Ph.D. diss. Beijing: North China Electric Power University. doi:10.27140/d.cnki.ghbbu.2021.000899
Lv, Z., Sheng, W., Zhong, Q., Liu, H., Zeng, Z., Yang, L., and Liu, L. (2014). Virtual synchronous generator and its application in microgrid. Proc. Chin. Soc. Electr. Eng. 34 (16), 2591–2603. doi:10.13334/j.0258-8013.pcsee.2014.16.009
National Energy Administration (2018). Notice on relevant matters concerning the development and construction of wind power and photovoltaic power generation in 2021. https://www.iea.org/policies/14120-notice-on-matters-concerning-the-development-and-construction-of-wind-power-and-photovoltaic-power-generation-in-2021.
State Grid Corporation of China (2016a). Technical Guidelines for virtual synchronous generators. Beijing, China: State Grid Corporation of China.
State Grid Corporation of China (2016b). Technical requirements and test methods for unit photovoltaic virtual synchronous generator. Beijing, China: State Grid Corporation of China.
Wang, F., Song, S., Cao, Y., Xie, H., Zhang, X., Zhang, J., et al. (2018). Multi-scale assessment of wind and solar power Resources based on continuous wavelet transform. J. Shandong Univ. Eng. Sci. 48 (5), 124–130. doi:10.6040/j.issn.1672-3961.0.2018.172
Wang, Y., and Yuan, H. (2024). Frequency regulation strategy for direct-drive wind turbine units considering wind speed forecasting. J. North China Electr. Power Univ., 1–9.
Wu, P., Liu, B., Yang, P., Song, S., Liu, Z., and Qin, L. (2022). Primary frequency modulation control and evaluation of photovoltaic considering weather and operating state. Eng. J. Wuhan Univ. 55 (3), 275–282. doi:10.14188/j.1671-8844.2022-03-009
Xie, X., He, J., Mao, H., and Li, H. (2021). New issues and classification discussion on the stability of ‘dual-high' power systems. Proc. Chin. Soc. Electr. Eng. 41 (2), 461–475. doi:10.13334/j.0258-8013.pcsee.201405
Xu, B., Peng, Y., Zhang, L., Bian, X., and Li, D. (2021). Study on primary frequency regulation of DFIG participating in power system based on optimization of unloading and dynamic inertia control. Renew. Energy Resour. 39 (09), 1217–1223. doi:10.13941/j.cnki.21-1469/tk.2021.09.012
Zhang, H., Cao, Y., Zhang, Y., and Li, C. (2021). Evolution and analysis method requirements of dynamic behavior in power system frequency. J. Shandong Univ. Eng. Sci. 51 (5), 42–52. doi:10.6040/j.issn.1672-3961.0.2021.174
Zhang, S., Jiao, L., Zhang, H., Shi, L., and Yang, H. (2020). “A new control strategy of active participation in frequency regulation of photovoltaic system,” in 2020 IEEE 4th Conference on Energy Internet and Energy System Integration (EI2), Wuhan, China, October, 2020, 2314–2318.
Zhang, Yi, Wu, Y., Ni, L., et al. (2019). Inertia analysis of photovoltaic grid-connected generation system with droop control under DC voltage. Smart Power 47 (12), 37–43.
Zhao, Z., Lei, Y., He, F., Lu, Z., and Qi, T. (2011). Technical overview of large-capacity grid-connected photovoltaic power stations. Automation Electr. Power Syst. 35 (12), 101–107.
Zhou, S. (2018). Research on active power control strategy of wind and solar power generation participating in power grid frequency regulation. Ph.D. diss., Jilin, China: Northeast Electric Power University.
Keywords: distributed photovoltaics, power reserve control, grid frequency, primary frequency modulation, optimize power reserve
Citation: Zhang R, Wang L, Zeng S, Cheng Z, Su C, Li Z and Zhang H (2024) Research on active participation of distributed photovoltsics in power grid primary frequency control strategy. Front. Energy Res. 12:1377351. doi: 10.3389/fenrg.2024.1377351
Received: 27 January 2024; Accepted: 08 March 2024;
Published: 21 March 2024.
Edited by:
Kaiping Qu, China University of Mining and Technology, ChinaReviewed by:
Junyi Zhai, China University of Petroleum, ChinaBingbing Shao, Hefei University of Technology, China
Copyright © 2024 Zhang, Wang, Zeng, Cheng, Su, Li and Zhang. This is an open-access article distributed under the terms of the Creative Commons Attribution License (CC BY). The use, distribution or reproduction in other forums is permitted, provided the original author(s) and the copyright owner(s) are credited and that the original publication in this journal is cited, in accordance with accepted academic practice. No use, distribution or reproduction is permitted which does not comply with these terms.
*Correspondence: Runtao Zhang, enJ0X2dyaWRAMTI2LmNvbQ==