 Bing Li1
 Guocheng Yang
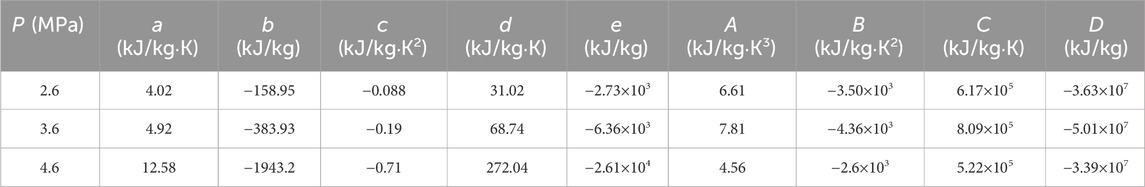

94% of researchers rate our articles as excellent or good
Learn more about the work of our research integrity team to safeguard the quality of each article we publish.
Find out more
DATA REPORT article
Front. Energy Res., 06 March 2024
Sec. Energy Storage
Volume 12 - 2024 | https://doi.org/10.3389/fenrg.2024.1376724
This article is part of the Research TopicAdvancements in Thermal Safety and Management Technologies for Energy Storage SystemsView all 7 articles
Natural gas, a prominent, high-quality, and eco-friendly energy source, plays a significant role in the global energy structure, accounting for approximately 23% of the total energy consumption (Xu et al., 2022). Following extraction, natural gas undergoes liquefaction to facilitate its storage and transportation. During the liquefaction process, natural gas condenses within the spiral tubes of spiral-wounded heat exchangers (Ding et al., 2017). However, due to its composition of methane, ethane, propane, nitrogen, carbon dioxide, and other components, the condensation of natural gas exhibits complex heat transfer characteristics. In particular, the occurrence of phase change during condensation results in a decrease in temperature, known as the temperature glide phenomenon, which poses challenges for simulating natural gas condensation.
While existing research has focused on the condensation of hydrocarbon refrigerants within spiral tubes (Qiu et al., 2018; Yu et al., 2018; Tian et al., 2022), there is currently a lack of studies specifically addressing the simulation of natural gas condensation in this context. The widely used Lee model (Lee, 1980), based on gas dynamic theory, simplifies the Hertz-Knudsen equations to obtain the condensation source phase (Knudsen, 1934). However, the Lee model is primarily suitable for calculating phase transitions at a specific saturation temperature and is applicable only to the condensation calculation of pure refrigerants with a constant saturation temperature, neglecting the influence of temperature glide in condensation of natural gas.
In order to accurately calculate the condensation heat transfer of natural gas and account for the temperature variation with vapor quality, it is essential to establish a specific condensation model for natural gas. In this study, a new variable-temperature phase change model is employed to simulate natural gas condensation within spiral tubes. Through simulation, we can determine the range of heat transfer coefficients and pressure drops within the tube, critical parameters for heat exchanger design. Additionally, analyzing phase distribution can offer valuable insights into the local heat transfer characteristics within the tube, thereby aiding in addressing potential issues related to localized heat transfer deterioration.
The simulated object consists of a spiral-wound tube with 4 spiral cycles, featuring an inner diameter of 9.4 mm, a winding diameter of 395 mm, and a helix angle of 8.3°, as shown in Figure 1. To optimize computational efficiency, the simulation divides the spiral-wound tube into 8 sections (Sections 1–8), each representing half a spiral cycle with a length of approximately 646 mm. The outlet of one section and the inlet of the subsequent section were linked using the “Profile” file function, incorporating mapped parameters such as velocity, temperature, and vapor quality. Furthermore, to ensure inlet flow development, an additional flow development section (Section 0) was introduced before the inlet of Section 1, with the outlet results of Section 0 serving as the inlet conditions for Section 1.

FIGURE 1. Geometric model.
The tube wall is made of aluminum (density 2,719 kg/m3, specific heat capacity 871 J/kg K, thermal conductivity 202.4 W/m K). The natural gas inside the tube is a mixture with a molar composition of 97.9% methane, 0.61% ethane, 0.05% propane, 0.67% nitrogen, and 0.77% carbon dioxide. This composition information was acquired from samples collected and analyzed using an offline gas chromatograph.
The simulation conditions were provided by the Shanghai Marine Diesel Engine Research Institute and include: the first set conditions (inlet pressure of 2.6 MPa, inlet temperature of −97°C, and heat flux of 11.9 kW/m2), the second set conditions (inlet pressure of 3.6 MPa, inlet temperature of −76°C, and heat flux of 17.2 kW/m2), and the third set conditions (inlet pressure of 4.6 MPa, inlet temperature of −75°C, and heat flux of 22.1 kW/m2). The properties of the natural gas under these conditions were obtained using the property calculation software Refprop Version 10.0. Typically, these physical properties are expressed as nonlinear functions of temperature, pressure, and molar composition (Kunz and Wagner, 2012). For the purposes of this study, the molar composition was considered constant, and pressure loss was deemed negligible, rendering the physical properties solely dependent on temperature. To accurately model the total specific enthalpy, gas specific enthalpy, and vapor quality, the values obtained from the software were used to derive fitting functions, as illustrated in Eqs 1–4. These fitted functions have deviations in specific enthalpy of 0.001%–0.33% and in vapor quality of −0.03–0.04.
where, hv and hl are the vapor and liquid specific enthalpy, respectively; h is the two-phase specific enthalpy; x is the vapor quality; the T is the temperature of natural gas; a, b, c, d, e, A, B, C and D are the coefficients of these fitting functions, and their values are listed in Table 1.
To accurately depict the phase change behavior of natural gas condensation, a variable temperature phase change model is employed. The total specific enthalpy in each cell is determined using the energy equation, and then inserted into Eq. 3 to calculate the phase transition temperature TT. By substituting the computed phase transition temperature for the saturation temperature in the Lee model, as demonstrated in Eqs 5–7, it becomes feasible to simulate the temperature reduction during the condensation process.
where, aG and aL are the volume fractions of gas and liquid phases; ρG and ρL are the densities of gas-phase and liquid-phase natural gas, kg/m3; VG is the gas-phase velocity, m/s; mLG and mGL are the mass transfer rates due to evaporation and condensation, kg/(m3 s); t’ is the relaxation time coefficient, which is taken as 1,000 in this simulation, s-1; TG and TL are the temperatures of gas-phase and liquid-phase natural gas in the calculation unit, K; TT is the phase changing temperature, calculated using Eqs 3, K.
The spiral tube model was grid-mapped using ICEM software, employing hexahedral structured grids. Local control was applied to the boundary layer and the central region grid, which measured approximately 2.66 mm × 2.66 mm in size. Consistent with literature (Qiu et al., 2018), an enhanced wall function boundary was utilized, with the thickness of the first wall boundary set at 0.0004 mm to ensure a y plus value below 0.5.
To assess grid independence, the global grid size was adjusted from 1 to 0.5 mm, and the number of boundary layers was raised from 8 to 50. Examination of the initial segment under these conditions showed that reducing the global grid size to 0.6 mm and increasing the boundary layer grid to over 30 layers resulted in a less than 1% change in average wall temperature and heat transfer coefficient. As a result, the study adopted a global grid size of 0.6 mm and 30 boundary layers as the grid parameters.
The simulation utilizes the Volume of Fluid (VOF) model, with the properties in the transport equations determined based on the presence of each phase in every control volume. The k-epsilon model is chosen as the turbulence model for this simulation. By solving the governing equations for mass, momentum, and energy transfer, the VOF model enables the prediction of complex flow phenomena associated with condensation, providing valuable insights into the behavior of condensing fluids within different geometrical configurations.
According to the three sets of experimental conditions mentioned above, the development section (section 0) is set as a mass flow inlet boundary and free flow outlet boundary, while the wall surface is set as an adiabatic wall surface, allowing the two-phase mass to flow and develop fully within it. The heat transfer section (sections 1–8) is set up with a velocity inlet and free flow outlet, and the wall is set up with constant heat flow density and no-slip boundary conditions according to the working conditions.
The solver is set up as a pressure-based solver, with pressure-velocity coupling operating in the PISO mode. The Skewness Correction and Neighbor Correction are both set to 1 by default. Gradient interpolation is carried out using the Least Squares Calculation Cell Based method, chosen for its relatively high accuracy and reduced pseudo-diffusive effects. The pressure interpolation utilizes the PRESTO! method, particularly suitable for highly cyclonic flow, while the momentum interpolation method is based on the second-order windward format. Additionally, the Volume Fraction discrete format adopts the Modified HRIC method, and the discrete formats of the remaining terms are also in the second-order windward format.
The simulated results were validated using experiments, where liquid nitrogen was used to cool the natural gas inside the spiral wound tube. The experimentally measured average heat transfer coefficient inside the tube showed a deviation of within ±14% compared to the simulated results.
The simulation results indicate that the temperature of natural gas gradually decreases from the first section to the eighth section. Specifically, the temperature decreases from −97.2°C to −99.2°C under the first set conditions, from −75.9°C to −94.7°C under the second set conditions, and from −74.6°C to −87.6°C under the third set conditions. This suggests that the phase change model effectively captures the impact of variable phase transition temperature during the natural gas condensation process. Furthermore, as the vapor quality decreases, the heat transfer coefficient demonstrates a pattern of increasing and then decreasing, with the maximum heat transfer coefficient occurring near a vapor quality of around 0.3. Across the three sets of conditions, the heat transfer coefficient ranges from 2,747.2 to 3,183.9 W/m2K (first set conditions), 1,233.4–3,593.7 W/m2K (second set conditions), and 1,176.5–2,641.2 W/m2K (third set conditions).
The pressure drop of natural gas flow gradually decreases as condensation progresses from the first section to the eighth section. Specifically, at the first set of conditions, the pressure drop decreases from 520.9 to 358.2 Pa, at the second set of conditions it decreases from 515.9 to 109.1 Pa, and at the third set of conditions, it decreases from 641.8 to 335.9 Pa. This phenomenon can be attributed to the reduction in flow velocity accompanying the transition of the gas phase to the liquid phase.
Analysis of the vapor quality data reveals distinct phase distribution patterns under varying conditions. It is evident that under the first set of conditions, natural gas does not undergo complete liquefaction, whereas under the second and third sets of conditions, complete liquefaction of natural gas is observed in the eighth section.
The phase distribution inside the spiral tube exhibits notable differences compared to that in the horizontal tube. Specifically, a region of lower vapor quality is discernible near the center of the spiral tube. This phenomenon is likely attributed to the presence of secondary flow, which induces a significant radial velocity component, thereby transporting liquid towards the center of the tube. This contrasts with the distribution of liquid along the wall of a horizontal tube (i.e., annular flow). The observed secondary flow in the spiral tube can reduce the thickness of the liquid film on the tube wall, thereby enhancing heat transfer within the tube. Furthermore, the accumulation of liquid in the lower region on one side away from the winding center, influenced by centrifugal force and gravity, may lead to deteriorated heat transfer in this area.
This study has provided a comprehensive investigation into the heat transfer coefficient and pressure drop of natural gas flow condensation in spiral tubes, offering valuable insights into the behavior of natural gas during the condensation process. Through the simulation, some conclusions can be drawn as follow:
The observed trend of the heat transfer coefficient peaks near a vapor quality of 0.3.
The gradual decrease in pressure drop as condensation progresses can be attributed to the reduction in flow velocity.
The phase distribution within the spiral tube is characterized by a region of lower vapor quality near the center of the tube and a concentration of liquid in the lower region away from the winding center.
As a result, it is recommended that when designing spiral wound tube heat exchangers, greater heat transfer area should be incorporated in regions of high vapor quality and below vapor quality of 0.3. Furthermore, given the demonstrated enhancement of heat transfer by secondary flow, reducing the spiral winding radius has the potential to improve the heat transfer performance of the spiral wound tube heat exchanger.
The raw data supporting the conclusion of this article will be made available by the authors, without undue reservation.
BL: Writing–original draft. CL: Writing–review and editing. BZ: Writing–review and editing. GY: Writing–review and editing. WW: Writing–review and editing. WL: Writing–review and editing. CC: Writing–review and editing.
The author(s) declare that financial support was received for the research, authorship, and/or publication of this article. The authors gratefully acknowledge the supports from National Natural Science Foundation of China (Grant No. 52104067) and Shanghai Marine Diesel Engine Research Institute.
The authors declare that the research was conducted in the absence of any commercial or financial relationships that could be construed as a potential conflict of interest.
All claims expressed in this article are solely those of the authors and do not necessarily represent those of their affiliated organizations, or those of the publisher, the editors and the reviewers. Any product that may be evaluated in this article, or claim that may be made by its manufacturer, is not guaranteed or endorsed by the publisher.
The Supplementary Material for this article can be found online at: https://www.frontiersin.org/articles/10.3389/fenrg.2024.1376724/full#supplementary-material
Ding, C., Hu, H., Ding, G., Chen, J., Mi, X., Yu, S., et al. (2017). Experimental investigation on downward flow boiling heat transfer characteristics of propane in shell side of LNG spiral wound heat exchanger. Int. J. Refrig. 84, 13–25. doi:10.1016/j.ijrefrig.2017.08.006
Kunz, O., and Wagner, W. (2012). The GERG-2008 wide-range equation of state for natural gases and other mixtures: an expansion of GERG-2004. J. Chem. Eng. data 57, 3032–3091. doi:10.1021/je300655b
Lee, W. H. (1980). A Pressure iteration scheme for two-phase flow modeling. Los Alamos: University of California.
Qiu, G., Xu, Z., Cai, W., and Jiang, Y. (2018). Numerical study on the condensation flow and heat transfer characteristics of hydrocarbon mixtures inside the tubes of liquefied natural gas coil-wound heat exchangers. Appl. Therm. Eng. 140, 775–786. doi:10.1016/j.applthermaleng.2018.05.090
Tian, Z., Zheng, W., Li, X., Zheng, L., and Jiang, Y. (2022). Numerical investigation on condensation heat transfer performance of mixed hydrocarbon refrigerant in spirally tubes. Int. J. Refrig. 139, 13–24. doi:10.1016/j.ijrefrig.2022.04.001
Xu, J., Lin, W., Chen, X., and Zhang, H. (2022). Review of unconventional natural gas liquefaction processes. Front. Energy Res. 10, 915893. doi:10.3389/fenrg.2022.915893
Keywords: heat transfer coefficient, pressure drop, natural gas, flow condensation, spiral tube
Citation: Li B, Li C, Zheng B, Yang G, Wu W, Li W and Cao C (2024) CFD simulation data report: heat transfer coefficient and pressure drop of natural gas flow condensation in spiral tube. Front. Energy Res. 12:1376724. doi: 10.3389/fenrg.2024.1376724
Received: 26 January 2024; Accepted: 20 February 2024;
Published: 06 March 2024.
Edited by:
Haotian Liu, University of California, Los Angeles, United StatesReviewed by:
Zhi Yang, Rice University, United StatesCopyright © 2024 Li, Li, Zheng, Yang, Wu, Li and Cao. This is an open-access article distributed under the terms of the Creative Commons Attribution License (CC BY). The use, distribution or reproduction in other forums is permitted, provided the original author(s) and the copyright owner(s) are credited and that the original publication in this journal is cited, in accordance with accepted academic practice. No use, distribution or reproduction is permitted which does not comply with these terms.
*Correspondence: Guocheng Yang, aGFycm9kMTg0NjZAMTI2LmNvbQ==
Disclaimer: All claims expressed in this article are solely those of the authors and do not necessarily represent those of their affiliated organizations, or those of the publisher, the editors and the reviewers. Any product that may be evaluated in this article or claim that may be made by its manufacturer is not guaranteed or endorsed by the publisher.
Research integrity at Frontiers
Learn more about the work of our research integrity team to safeguard the quality of each article we publish.