 Yue Gan1
 Yixin Jia
95% of researchers rate our articles as excellent or good
Learn more about the work of our research integrity team to safeguard the quality of each article we publish.
Find out more
ORIGINAL RESEARCH article
Front. Energy Res. , 28 May 2024
Sec. Sustainable Energy Systems
Volume 12 - 2024 | https://doi.org/10.3389/fenrg.2024.1376531
This article is part of the Research Topic Distributed Learning, Optimization, and Control Methods for Future Power Grids, Volume II View all 21 articles
To steadily promote the reform of sales electricity prices, China has innovatively proposed to carry out grid enterprises’ agency power purchase business (GEAPPB) as a transitional scheme for industrial and commercial users to enter the power market in the future. However, because the GEAPPB covers a wide range of users and involves complex business processes, the risks throughout the process of the GEAPPB will affect the organization and operation of the business. This paper proposes a GEAPPB risk assessment technique. First, a risk evaluation index system containing 10 indicators is designed based on the characteristics and development process of GEAPPB. Second, a risk assessment model based on the fuzzy full consistency method (FUCOM-F) and gray relational analysis (GRA)-improved MARCOS is constructed. Finally, seven grid enterprises in China are taken as examples to verify the validity and scientificity of the model. The results show that improving the accuracy of power forecasting, optimizing the agency power purchase strategy, and strengthening demand response management are the key schemes to reduce the risk of GEAPPB. Compared with the other three evaluation models, the proposed model has good applicability and effectiveness for the risk evaluation of GEAPPB.
To promote power market reform, alleviate energy supply pressure, and promote global low-carbon energy transformation, it is necessary to steadily promote sales electricity price reform and strengthen coordination with industrial and environmental policies. Some countries have practical experience in implementing sales reforms in the power market, and the sales electricity pricing mechanism is shown in Table 1 (Walawalkar et al., 2010; Carstairs and Pope, 2011; Ilieva and Gabriel, 2014). Texas in the United States liberalized the wholesale and retail electricity markets, with 75% of the load in a competitive electricity sales market (Brehm and Zhang, 2021). However, in February 2021, it suffered a severe power crisis, with the wholesale market price once exceeding 9,000 $/(MWh) (An et al., 2021), thus increasing the risk tolerance of electricity consumers. To ensure the implementation of the sales electricity price reform, it is necessary to establish a power supply guarantee service mechanism (Wang et al., 2021), protect the rights and interests of all users, and achieve optimized allocation of economic factors. Ensuring the return of power supply services to the market has become an important component of a competitive electricity market.
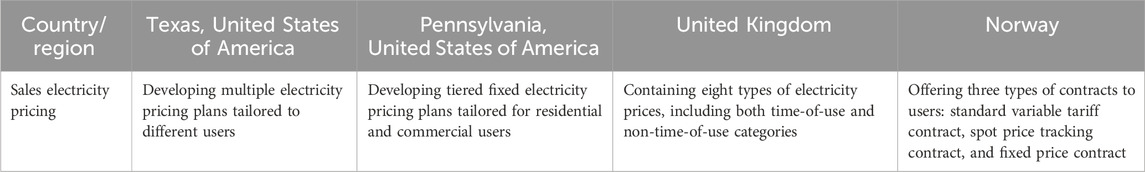
Table 1. Current status of sales electricity pricing reform.
In October 2021, China issued the “Notice on Matters Related to the Organization of Power Grid Enterprise Agent Purchasing Work” (The National Development and Reform Commission, 2021), which determined that industrial and commercial users not yet directly participating in the electricity market will be agents purchased by power grid enterprises through a marketization approach, with the core goal being to ensure the implementation of the sales electricity price reform after large-scale users enter the market. The grid enterprises’ agency power purchase business (GEAPPB) is an important measure to implement the marketization reform of coal-fired feed-in electricity prices and promote the reform of sales electricity prices. On the one hand, price fluctuations can be used to adjust the energy demand of enterprises and solve the problem of supply–demand imbalance in the electricity market. On the other hand, the costs associated with the rapid increase in international primary energy prices can be channeled to the demand side, with demand-side enterprises bearing the variable costs so that power supply enterprises can better perform their functions. Under the agent power purchase mechanism, the grid enterprise becomes the largest special retailer, executing a unified agent price without charging service fees when selling electricity to the agent user. When purchasing electricity, grid enterprises need to purchase electricity in the market according to the market price every month and then form the average feed-in tariff.
With the gradual deepening of the GEAPPB, the risks of the business have gradually emerged, appearing at various stages of the transaction. For example, before conducting the decision-making for the GEAPPB, risks mainly come from two aspects: one is the deviation in predicting the electricity consumption of agent users, and the other is the deviation in predicting the market price of agent purchasing power. The fluctuating amplitude of both uncertainties changes over time, bringing new opportunities and challenges to the operation and development of China’s power grid enterprises. Furthermore, due to the varying importance of risks within different risk categories, it is inappropriate to uniformly consider all risks as having equal weight. Therefore, the main challenge in successfully conducting GEAPPB lies in how to differentiate the priority of risk assessment indicators, consider the characteristics of different risk indicators, and comprehensively assess the risk situation throughout the entire process of the business operation. In the aforementioned context, first, this paper analyzes the key information of the GEAPPB and the uncertain factors that may be encountered during the business development process. Second, it identifies the full process risks of the GEAPPB and establishes a risk assessment index system. Finally, it adopts scientific methods to evaluate the comprehensive risks faced by the business and conducts case simulations. The research in this paper is of great significance in providing theoretical guidance for the GEAPPB.
Existing research mainly focuses on optimized decision-making and system-assisted decision-making in the power purchase and sale business. Huang et al. (2022) provided an interactive two-stage retail electricity market based on transactive energy as an effective platform for prosumers to participate in distribution-side retail transactions. Yu et al. (2018) proposed an optimal model of power purchase for regional power grids, considering the uncertainties of wind power and the effect of the day-ahead market. Tang et al. (2019) established a decision-making model of electricity procurement and sale for electricity retailers with multiple retail contract modes based on information gap decision theory. Dunnan et al. (2019) proposed the power user response model based on the time-of-use tariff and then constructed the purchasing and selling electricity model of the power-selling retailers, considering a differentiated time-of-use TOU tariff. Fang and Wang (2023) established an optimal real-time pricing and electricity package strategy for retail electric providers based on social learning. However, there are a few studies on the agency power purchase service of the grid enterprises. Zhao et al. (2013) constructed an electricity purchasing and selling risk control optimization model for a power grid corporation, considering user demand elasticity, electricity distribution in the contract market and real-time market, and the compensation cost for user blackouts. Zhou et al. (2023) analyzed the demand for refined pricing mechanisms of the grid enterprise agency power purchase service and constructed a pricing model that takes into account the comprehensive evaluation grading of users and the industry-differentiated pricing system. Li et al. (2023) established an assessment model of guaranteed power supply profit and loss of power grid under agent purchasing policy.
There are many types of risks faced by power grid enterprises in carrying out agency power purchase services. To promote the organization and development of GEAPPB, it is of great significance to study the risk perception and risk management methods of agency power purchase services. Through conditional value-at-risk, Russo et al. (2022) assessed the retailers’ profitability and risk exposure to different levels of PV self-generation by assuming different retail tariff schemes. Luo et al. (2019) and Guo et al. (2019) considered the uncertainty of power market transactions caused by renewable energy output and load fluctuations and selected the conditional value-at-risk as the risk assessment index, constructing a risk assessment model for electricity retailers. To examine the effects of retailers’ risk preferences on their strategies and equilibrium outcomes in the retail market, Zhao et al. (2023) proposed an equilibrium model for price-making retailers by employing the mean–variance utility theory to model the risk preferences of retailers. Deng et al. (2020) determined the risk-averse and risk-neutral strategies of electricity retailers in the power procurement problem.
Through the literature review mentioned above, the existing risk assessment of power grid enterprise agency power purchase services has mainly the following shortcomings:
(1) The player in power purchase and sale strategy optimization is generally oriented to power generation enterprises, power retailers, and power users and less focused on power grid enterprises, which is not in line with the functional positioning of China’s power grid enterprises in the context of sales price reform.
(2) Existing studies have mainly dealt with the impact of a single risk factor on market players, such as the risks associated with uncertainties in electricity prices, new energy power, and loads, without considering the conduct of power purchase and sale business under the influence of multiple risk factors.
Against this background, this paper establishes a risk assessment model for power grid enterprises’ agency power purchase services. First, this study analyzes the uncertainties that may be encountered in the agency power purchase business, identifies the risks throughout the business process, and designs a risk indicator system for the GEAPPB. Second, it builds a comprehensive risk assessment model for GEAPPB to achieve comprehensive risk perception and assessment. Finally, it proposes strategies for power grid enterprises to cope with the abovementioned risks, with a view to providing theoretical guidance for grid enterprises’ agency power purchase services. The innovations and contributions of this paper are as follows:
(1) The research player in this paper is focused on the power grid enterprises under the background of sales price reform based on the new functional positioning of power grid enterprises to carry out the agency power purchase business, identifying the risk throughout the whole process of the business, and constructing an indicator system including 10 indicators for assessing the risk of the GEAPPB.
(2) A comprehensive risk assessment model for GEAPPB based on fuzzy full consistency method (FUCOM-F) and gray relational analysis-improved MARCOS (GRA-MARCOS) technology has been established. On the one hand, the weighting method of FUCOM-F can reduce the uncertainty in the process of experts judging the degree of influence of indicators. On the other hand, the GRA-MARCOS technology can reflect the similarity between schemes while fully considering the differences in the evaluation indicators, making the evaluation results more scientific and objective.
(3) Taking seven power grid enterprises in China to carry out the agency power purchase business as an example, the results show that the imperfect purchasing strategy, the fluctuation of electricity prices, and the users’ defaults on a bill are the important factors affecting the risk of the power purchasing business. Furthermore, compared with the other three hybrid decision models, the model constructed in this paper has good applicability and validity for the risk assessment of the GEAPPB.
The remainder of this paper is organized as follows: Section 2 describes the whole process risk of the agency power purchase business, Section 3 constructs a comprehensive risk assessment model for the GEAPPB, and Section 4 conducts case analysis. Section 5 summarizes this paper.
The grid enterprises’ agency power purchase includes electricity users who have not participated in the electricity market, such as residents, agriculture, industry, and commerce. The agency power purchase requires the management and analysis of electricity users, combined with user attributes and industries, to determine the electricity consumption scale and characteristics of electricity users, providing support for power grid enterprises to formulate agency user electricity demand. The power grid enterprise agent purchase priority with photovoltaic, wind power, and other new power generation matching transactions, therefore, the development of market agent power purchase needs real-time monitoring and prediction of new energy power and load, providing a decision-making basis for the agent market purchase demand.
The process of the GEAPPB is as follows:
(1) Predict the electricity consumption and time-sharing curve of residential, agricultural, industrial, and commercial users purchased by the grid agent in the next month.
(2) Predict and schedule the power generation of priority generation units for the next month.
(3) Determine the agent purchasing power and time-sharing curve that the grid needs to purchase in the electricity market.
(4) Calculate the monthly electricity price for industrial and commercial users in the next month by combining the power generation of priority generator units, the market power purchase contracts for agent commercial and industrial users, and deviation power consumption.
(5) Calculate the actual feed-in electricity prices, deviation electricity fees, and auxiliary service fees for industrial and commercial users of power grid agents.
The monthly process of the power grid agency power purchasing business is shown in Figure 1.
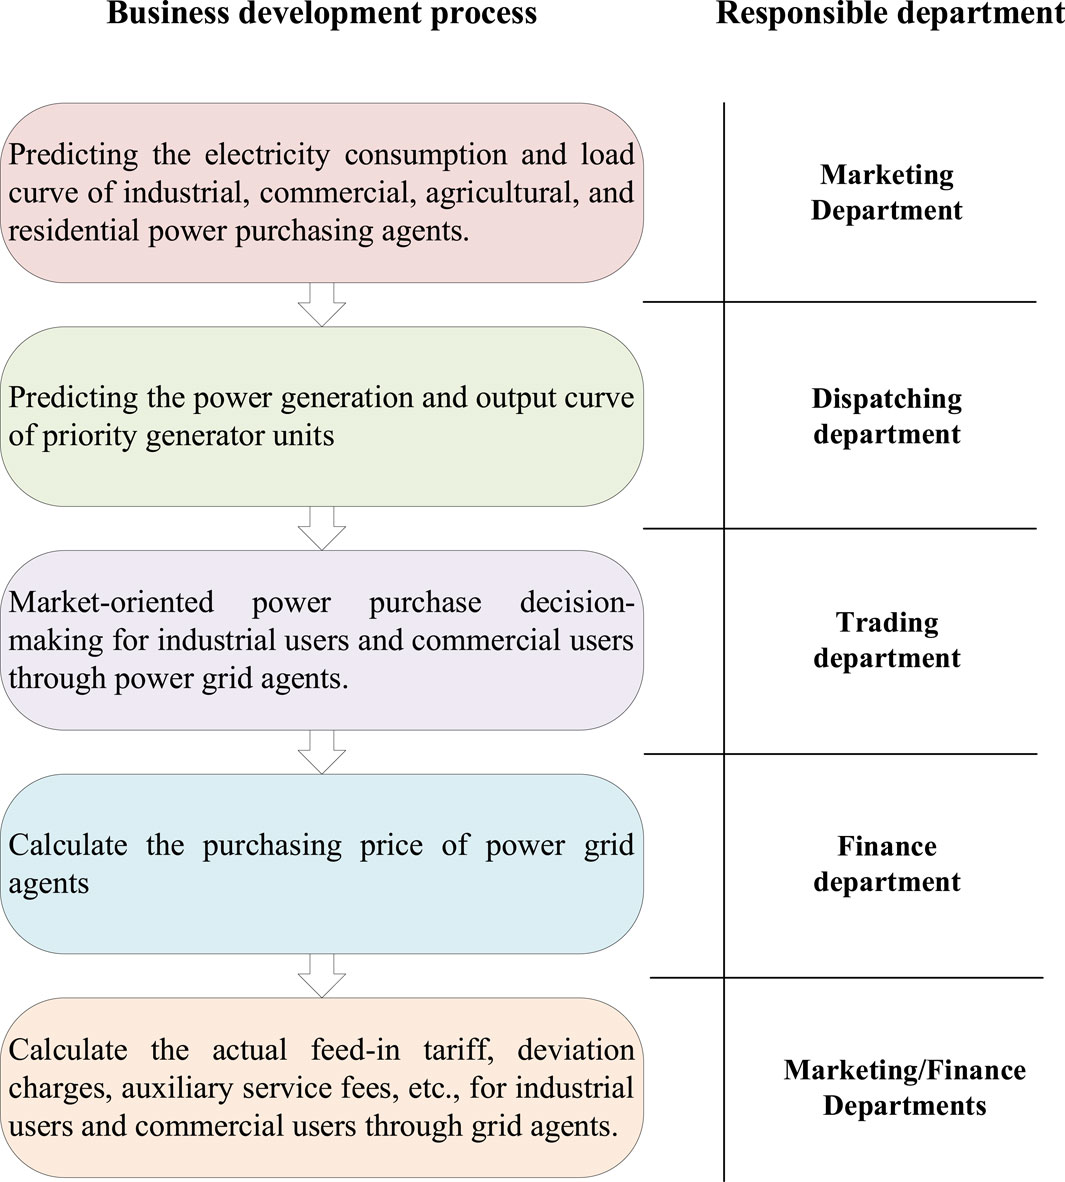
Figure 1. Monthly business development process.
The power grid enterprises face uncertainties when carrying out agency power purchase business; a timely and accurate assessment of the business risk will help the smooth implementation of the business and improve the competitiveness of grid enterprises. The design of a scientific and reasonable evaluation index system is the basis for the risk assessment of power purchasing agency business. The selected indicators should be sufficient, comprehensive, specific, and able to reflect the characteristics of the GEAPPB.
Incorporating the process of power grid agency purchasing business, key issues to be addressed in risk assessment can be summarized as follows:
1) Pre-transaction: The power grid enterprises need to accurately forecast the electricity consumption for residential, agricultural, and industrial sectors and the power generation and load curves of generating units. This affects the decision-making on the quantity and shape of electricity purchases in the market. Otherwise, there will be risks of equipment operation and forecasting deviations. Furthermore, power grid enterprises need to choose appropriate purchasing strategies to avoid the impact of imperfect strategies on the purchasing prices for agent users.
2) In transactions: The power grid enterprises need to monitor changes in the electricity market, participate in the electricity market scientifically in accordance with market rules, and guard against related risks in the electricity market transactions, such as price fluctuations and risks of poor power supply. At the same time, attention should be paid to potential risks in the market, such as collusion and price suppression.
3) Post-transaction: After business transactions, the power grid enterprises need to settle the expenses of agency power purchases based on transaction settlement rules. Additionally, it is necessary to further improve credit management to prevent issues such as default by the power generation side and arrears by users. Based on the key risks existing in the agency power purchase business process of power grid enterprises, the process of constructing the risk assessment indicator system is as follows:
Step 1: Determine the initial assessment indicators according to policies and documents, such as the Notice on Matters Related to the Organization of Power Grid Enterprise Agent Purchasing Work.
Step 2: After conducting research and investigation on the process of the GEAPPB, analyze the steps and characteristics of business in the pre-transaction, transaction, and post-transaction stages and adjust the initial assessment indicators.
Step 3: Based on existing research results in various studies (Gao et al., 2018; Ju et al., 2020; Zhang et al., 2022), further optimize the assessment indicators.
Step 4: Invite relevant experts, academics, and business practitioners in the field of electricity sales to review and adjust the existing indicators based on their expertise and experience.
The framework of the indicator system is shown in Figure 2.

Figure 2. Risk indicator system for the GEAPPB.
From the perspectives of policy risk, market risk, operational risk, and safety risk, this paper analyzes the process risk of the GEAPPB. Guided by the principles of indicator system construction, a comprehensive risk evaluation indicator system for the GEAPPB in China under the situation of sales electricity price reform is constructed. The indicator system contains three layers: layer 1 is the target layer, which is the process risk management of the GEAPPB, measuring the risk evaluation results; layer 2 is the criterion layer, which divides the process risks of the GEAPPB into three stages: pre-transaction, transaction, and post-transaction; and layer 3 is the indicator layer, which selects risk indicators that are independent of each other and represent the process risk of the GEAPPB.
In summary, compared to the traditional risk assessment systems that only consider risks in isolated stages, the risk assessment framework constructed in this paper takes into account the potential risks that may arise throughout the entire process of business operations, covering dimensions such as policy, market, operations, and safety, providing a more comprehensive consideration of business risks.
Risks in the business appear at various stages of the transaction, while the importance of risks in various categories is not the same and cannot be generally considered to be equally weighted risks without prioritization. At the same time, it is necessary to set different risk thresholds for different risk indicators to determine whether the risk is within an acceptable range. The research on the comprehensive risk assessment method of the GEAPPB can lay a theoretical foundation for risk management improvement and the smooth progress of the GEAPPB.
The Full Consistency Method (FUCOM) was first proposed by German scholar Pamučar et al. (2018), which has the advantage of high consistency in ranking results. Considering the uncertainty in the process of experts judging the influence degree of indicators, this paper introduces triangular fuzzy numbers (TFNs) to improve FUCOM and determines the weights of the risk evaluation index for the agency power purchase business.
There are
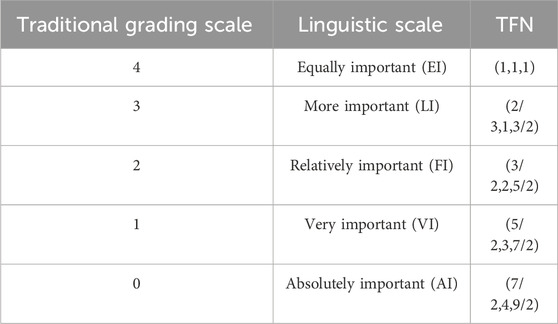
Table 2. Fuzzy linguistic scale.
The FUCOM-F can be divided into four steps.
Step 1: Construct the evaluation indicator system. There are n indicators denoted by
Step 2: Calculate the initial ranking of evaluation indicators. The decision-makers initially rank the indicators in descending order based on their judgment and preference for the importance of the indicators, thus obtaining the ranking result, denoted as
Step 3: Use TFNs to compare the degree of influence between indicators. According to the fuzzy linguistic scale given in Table 1, the fuzzy significance
where
Step 4: Calculate the optimal fuzzy weights and the fuzzy weight coefficients of the indicators. The final weight coefficient should meet the following conditions:
Condition 1. The ratio of the weight coefficients of
Condition 2. The final weight coefficient should satisfy transferability, i.e.,
The optimal weight coefficient solved should minimize the judgment deviation of the decision-maker, i.e., the transitivity between the weight coefficients fully meets
It can be proven that the transferability between weight coefficients is fully satisfied only when
where
To achieve complete consistency, it is necessary to satisfy
where
The traditional MARCOS method determines the utility function of the alternatives by defining the relationship between the alternative solutions and the reference object and achieving a compromise ranking of the ideal and negative ideal alternatives associated with them. Gray relational analysis is a multifactor statistical analysis method, and its basic idea is to determine whether the relationship is tight based on the similarity of the geometric shapes of sequence curves (Stanković et al., 2020). Introducing gray relational theory to calculate the utility of alternative solutions relative to positive and negative ideal solutions and forming GRA-MARCOS, which can reflect the similarity between the solutions while fully considering the differences in indicators, makes the evaluation results more scientific and objective. The steps for GRA-MARCOS are as follows:
Step 1: Create an initial decision matrix. The evaluation model consists of defining a set of
Step 2: Normalized initial decision matrix. The initial decision matrix is normalized using Eqs 11, 12 to obtain the normalized initial decision matrix
where
Step 3: Calculate the weighted, normalized decision matrix. Multiply the normalized decision matrix
Step 4: Calculate the positive and negative ideal solutions of MARCOS. The negative ideal solution (AAI) is the worst, while the ideal solution (AI) is the best. Define AAI and AI according to the properties of the indicators.
Step 5: Calculate the utility of the alternatives with respect to the positive and negative ideal solutions. Calculate the utility of the alternatives relative to the positive and negative ideal solutions based on the weighted normalized decision matrix and the positive and negative ideal solutions.
First, calculate the gray relation of the single indicators
where
Second, calculate the utility of alternatives relative to positive and negative ideal solutions:
Step 6: Calculate the utility function of the alternative with respect to the positive and negative ideal solutions. The utility function is the relative distance of the alternatives with respect to the positive and negative ideal solutions, calculated according to Eqs 20, 21:
Step 7: Calculate the comprehensive utility function of the alternatives. Based on the utility degree and utility function of the alternatives with respect to the positive and negative ideal solutions, the comprehensive utility function of the alternatives is obtained by applying Eq. 22.
Finally, the alternative solutions are ranked in descending order based on the comprehensive utility function values.
A survey is conducted on the agency power purchase business of seven provincial power grid enterprises in China (with different characteristics in different provinces, including high load demand, a high proportion of new energy generation, and a high proportion of industrial users). The quantitative indicators are primarily collected by averaging the indicator data from March 2022 to December 2023 for the seven grid enterprises. The qualitative indicators are assessed through expert surveys using questionnaires. Furthermore, government officials, academics, employees, and risk management experts from government, universities, and power grid enterprises are invited to evaluate the comprehensive evaluation index system of GEAPPB, resulting in the risk assessment results.
FUCOM-F ranks the importance of all indicators, combines the pairwise judgment results of the indicators, and determines the weight of the indicators by solving the optimization model, ensuring that the results have high consistency. After reaching a consensus on the importance of indicators, decision-makers determine the ranking of all indicators. The ranking result in this paper is
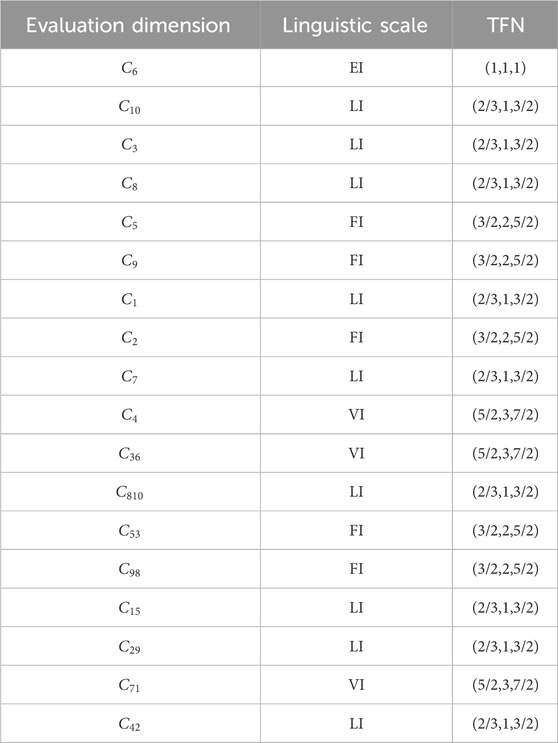
Table 3. Index weight ranking and its corresponding linguistic scale.
To clarify the FUCOM-F, this section solves the evaluation dimensions. According to Eq. 1, the comparative significance between the evaluation dimensions is defined as follows:
The corresponding fuzzy vectors are thus obtained as follows:
Since the final weight coefficients should satisfy the transferability, the following constraints are obtained:
Therefore, a fuzzy non-linear model can be constructed, and the optimal value of the indicator can be calculated by solving Eqs. 5–8. l, m, and u, respectively, denote the lower, middle, and upper limits of the triangular fuzzy numbers.
In this paper, the fuzzy weights of the evaluation dimensions are obtained using MATLAB software:
The fuzzy weights of the indicators in all dimensions are calculated according to the above steps, and the local weights of the indicators are obtained by solving Eqs 9, 10. The results are shown in Table 4.
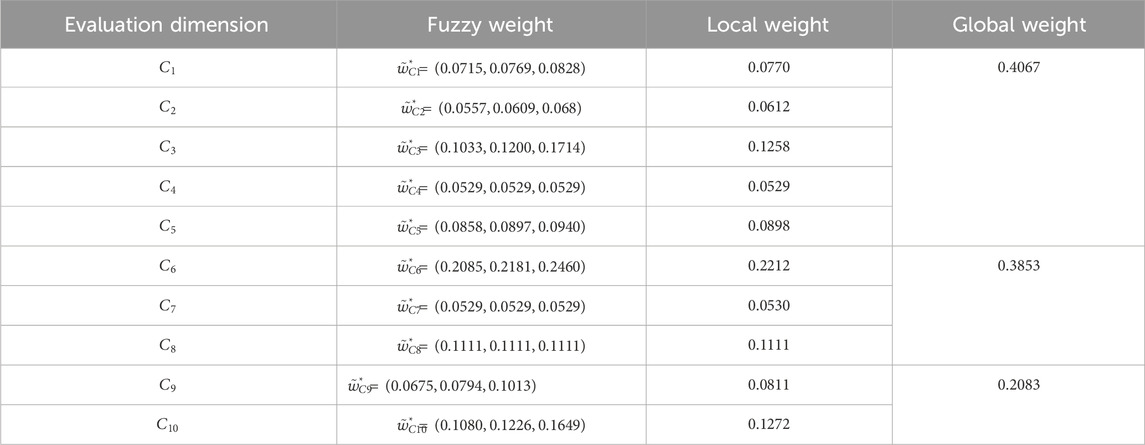
Table 4. Weight results of the evaluation dimension and dimension index.
First, the original data of the seven selected cases on each indicator are normalized by applying Eq. 13, and combined with the index weighting results, the weighted normalized decision matrix
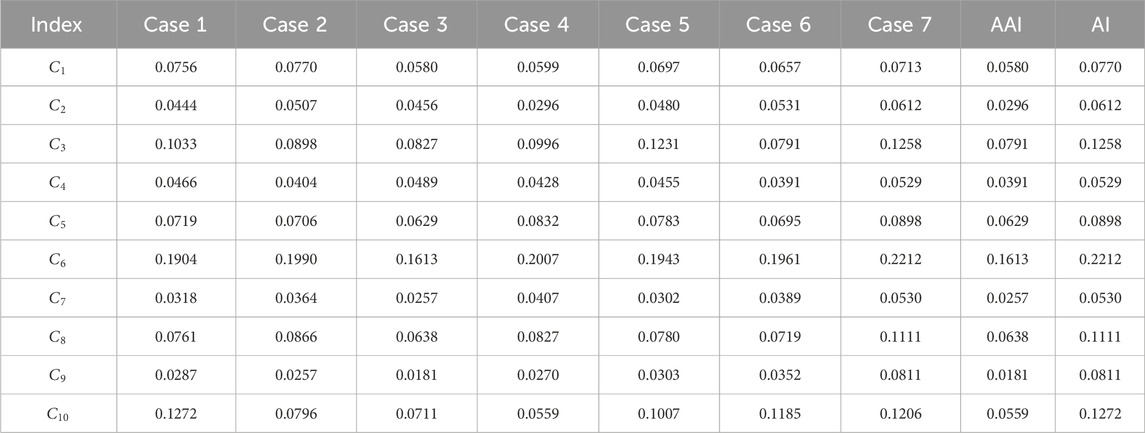
Table 5. Results of the MARCOS-weighted normalized decision matrix.
Based on the weighted normalized decision matrix and the positive and negative ideal solutions of MARCOS, the gray relation degrees
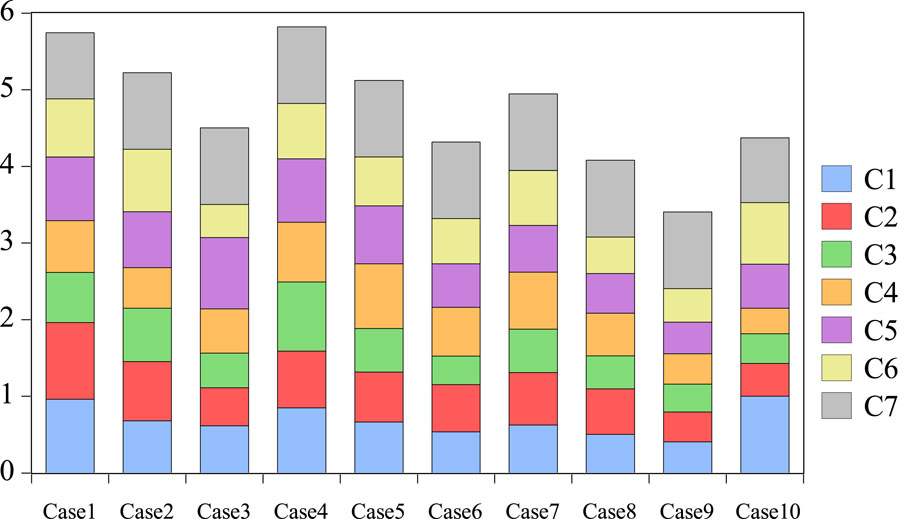
Figure 3. Calculation results of
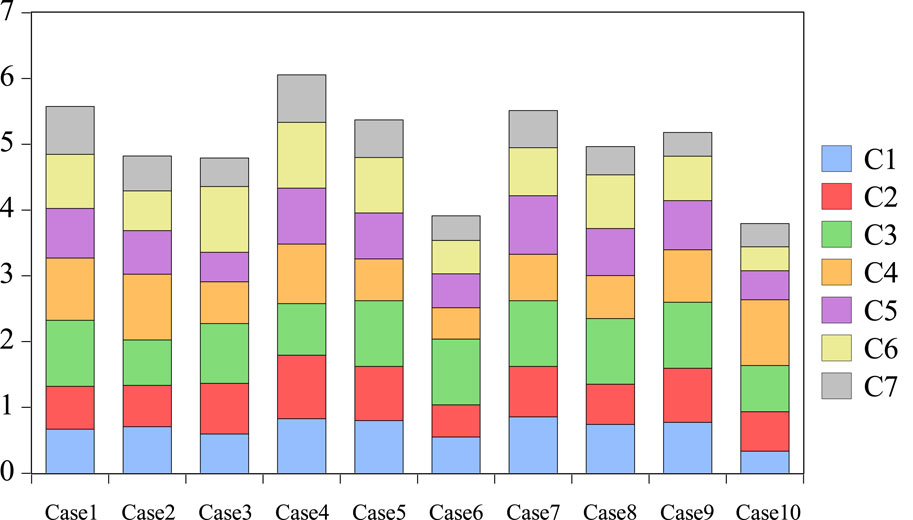
Figure 4. Calculation results of
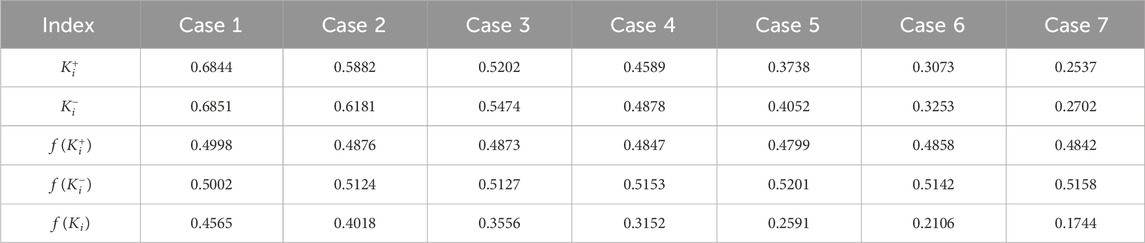
Table 6. Calculation results of GRA-MARCOS.
Second, the utility functions of the alternatives relative to the positive and negative ideal solutions are calculated, i.e., the relative distances of the seven cases relative to the positive and negative ideal solutions. Finally, based on the utility degree and utility function of the seven cases relative to the positive and negative ideal solutions, Eq. 22 is applied to obtain the comprehensive utility function of the seven cases and rank them. The GRA-MARCOS calculation process and results are shown in Table 8.
According to Table 8, Case 1 has the best performance with a comprehensive utility function of 0.4565, while Case 7 has the worst performance with a comprehensive utility function of 0.1744.
To verify the effectiveness of the proposed evaluation model, four comparative models are set up, as shown in Table 7, where Model 1 is the model proposed in this paper. Models 1 and 2 are compared to verify the effectiveness of the proposed weighting method; Models 1, 3, and 4 are compared to verify the effectiveness of the proposed evaluation method.
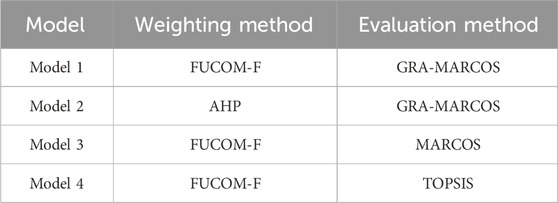
Table 7. Basic information of comparison models.
The robustness of the model in this paper is verified through a ranking consistency test, and the sample discriminability is verified through a sample separation test.
(1) Ranking consistency test
Ranking consistency is an important indicator reflecting the robustness of multi-attribute decision-making methods. This study constructs the ranking consistency index as shown in Eqs 23–25:
where
This part takes seven cases as examples to verify the robustness of the model. Based on the basic data of the grid enterprises on each index, we obtain the ranking results of agent power purchasing risks for seven cases under each comparison model and then calculate the ranking consistency of the four comparison models relative to Model 1, and the results are shown in Table 8.
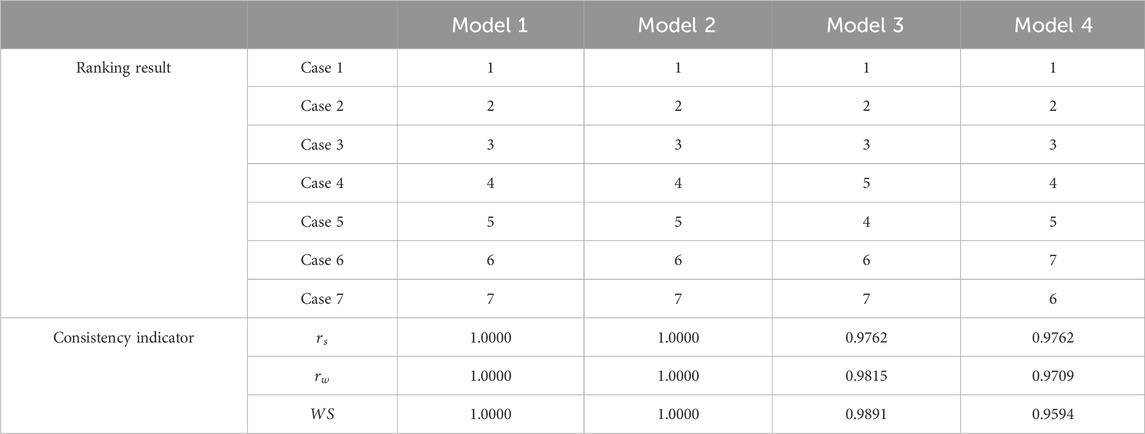
Table 8. Basic information of comparison models.
According to Table 8, the values of Model 2 in the three ranking consistency indexes are equal to those of Model 1. Although Models 3 and 4 have certain ranking differences compared with Model 1, the ranking consistency coefficients are greater than 0.95. The ranking consistency index of the three comparative models compared to the model constructed in this paper is higher than 0.95, indicating high consistency between the ranking results of the comparative models and the model proposed in this paper, validating the robustness of the ranking results of the model constructed in this paper.
(2) Sample separation test
A sample separation test is an important method to judge the validity of the ranking results of multi-attribute decision models. Common indexes of sample separation include standard deviation
where
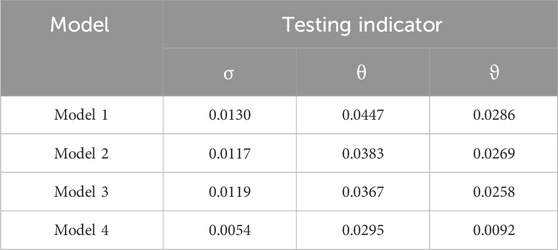
Table 9. Sample separation test results.
As can be seen from Table 9, the three sample separation indexes of Model 1 are greater than those of the other three models. Specifically, the sample separation of the model constructed in this paper is 6.32%–210.87% higher compared to the comparative models, indicating that compared with the comparison models, the evaluation model proposed in this paper has better performance in sample differentiation and can better reflect the risk of the GEAPPB. Therefore, the hybrid multi-attribute decision-making model based on FUCOM-F weighting and GRA-MARCOS proposed in this paper can better improve decision-making efficiency while ensuring robustness.
The power grid enterprises can take the following measures to gradually optimize the agency power purchase strategy and promote market-based power procurement with the lowest risk:
(1) Improve the prediction accuracy of power purchases. To improve the accuracy of power consumption prediction for users, power grid enterprises can comprehensively apply big data prediction technology to build a short-term power prediction model under the integration of multiple algorithms, accurately predict the monthly total electricity consumption and time of use electricity consumption in the next month, support the market agent power purchase business, and reduce the deviation fee of agent purchasing power.
(2) Optimize the agent power purchase strategy. Based on the feed-in prices of thermal power, hydropower, and new energy, combined with the prediction results of market-based power purchase, power grid enterprises construct an optimization model for agency power purchase strategies, calculate the transaction costs of different energy, carry out multi-scenario agency power purchase strategy deduction, and optimize the power transaction declaration strategy.
(3) Strengthening demand response management. Demand-side response can not only reduce the electricity consumption cost of users but also guarantee the real-time balance of the power grid. Grid enterprises can carry out demand-side management on a regular basis, guiding users to adjust the production and consumption plans without affecting efficiency, balancing the power consumption of the deviation part, and thus reducing the risk of deviation assessment.
The electricity market in China is still in a stage of continuous development and improvement, during which the price and operation modes of the electricity market are being improved. From the current policy perspective, the grid enterprises’ agency power purchase is only a transitional way for future industrial and commercial users to enter the market. In order to solve the problems of supply and demand uncertainty, price prediction deviation, and difficulties in coordinating corporate decision-making in the GEAPPB, this paper proposes a risk assessment model of the GEAPPB based on FUCOM-F and GRA-MARCOS, which provides a theoretical tool to improve the performance of the GEAPPB participating in the electricity market. The results of this paper are as follows:
(1) The risk of electricity price fluctuation, user defaults on a bill, and an imperfect power purchase strategy are the key factors affecting the risk of the GEAPPB. The risk of the GEAPPB is controlled by improving the prediction accuracy of power purchases, optimizing the agent power purchase strategy, and strengthening demand response management.
(2) The developed model has good applicability to the risk assessment of the GEAPPB. On the one hand, the proposed FUCOM-F weighting method can effectively reduce the number of paired comparisons of indicators (only n-1) and improve the consistency of evaluation results, which is conducive to improving the reliability calculation of weight coefficients. On the other hand, the gray relation is introduced into MARCOS, and the gray relation degree is used to replace the Euclidean distance as the utility degree of the alternatives relative to the positive and negative ideal solutions, which effectively overcomes the problem of the sagging line that exists in the traditional MARCOS and improves the evaluation accuracy.
(3) For power grid enterprises, conducting agency power purchases is a novel business approach, and the effectiveness of such operations may vary depending on the development and construction characteristics of different regions. Therefore, to address the continuously changing market environment and business needs when conducting risk assessments for future agency power purchase businesses, it is advisable to incorporate actual application scenarios from different regions, consider the changes in emerging market entities and market trading varieties, and design a more targeted evaluation index system. Furthermore, combining data analysis with predictive modeling techniques can be employed for indicator calculation to achieve more timely identification and assessment of risks associated with agency power purchase business.
The original contributions presented in the study are included in the article/supplementary material; further inquiries can be directed to the corresponding authors.
YG: writing–original draft and writing–review and editing. CZ: writing–original draft and writing–review and editing. BC: writing–original draft and writing–review and editing. JL: writing–original draft and writing–review and editing. YZ: writing–original draft and writing–review and editing. YJ: writing–original draft and writing–review and editing.
The author(s) declare that no financial support was received for the research, authorship, and/or publication of this article.
Authors YG, CZ, BC, and JL were employed by State Grid Fujian Electric Power Co., Ltd.
The remaining authors declare that the research was conducted in the absence of any commercial or financial relationships that could be construed as a potential conflict of interest.
Reviewer XX declared a shared affiliation with authors YZ and YJ at the time of the review.
All claims expressed in this article are solely those of the authors and do not necessarily represent those of their affiliated organizations, or those of the publisher, the editors, and the reviewers. Any product that may be evaluated in this article, or claim that may be made by its manufacturer, is not guaranteed or endorsed by the publisher.
An, X. M., Sun, H. D., Zhang, X. H., et al. (2021). Analysis and lessons of Texas power outage event on February 15, 2021. Proc. CSEE 41 (10), 3407–3415.
Brehm, P. A., and Zhang, Y. (2021). The efficiency and environmental impacts of market organization: evidence from the Texas electricity market. Energy Econ. 101, 105359. doi:10.1016/j.eneco.2021.105359
Carstairs, J., and Pope, I. (2011). The case for a new capacity mechanism in the UK electricity market—lessons from Australia and New Zealand. Energy policy 39 (9), 5096–5098. doi:10.1016/j.enpol.2011.06.004
Deng, T., Yan, W., Nojavan, S., and Jermsittiparsert, K. (2020). Risk evaluation and retail electricity pricing using downside risk constraints method. Energy 192, 116672. doi:10.1016/j.energy.2019.116672
Dunnan, L., Erfeng, X., Guangyu, Q., and Zhendong, D. (2019). A study on the purchasing and selling strategy of power selling companies considering differentiated time-sharing prices. Energy Procedia 156, 296–301. doi:10.1016/j.egypro.2018.11.145
Fang, D., and Wang, P. (2023). Optimal real-time pricing and electricity package by retail electric providers based on social learning. Energy Econ. 117, 106442. doi:10.1016/j.eneco.2022.106442
Gao, Y., Zhou, X., Ren, J., Zhao, Z., and Xue, F. (2018). Electricity purchase optimization decision based on data mining and Bayesian game. Energies 11 (5), 1063. doi:10.3390/en11051063
Guo, L., Ding, Y., Bao, M., et al. (2019). An optimal power purchase model of inter-provincial traders in two-level electricity market considering risk management. Power Syst. Technol. 43 (8), 2726–2734.
Huang, C., Zhang, M., Wang, C., Xie, N., and Yuan, Z. (2022). An interactive two-stage retail electricity market for microgrids with peer-to-peer flexibility trading. Appl. energy 320, 119085. doi:10.1016/j.apenergy.2022.119085
Ilieva, I., and Gabriel, S. (2014). Electricity retailers’ behavior in a highly competitive Nordic electricity market. J. Energy Mark. 7 (4), 17–46. doi:10.21314/jem.2014.107
Ju, L., Wu, J., Lin, H., Tan, Q., Li, G., Tan, Z., et al. (2020). Robust purchase and sale transactions optimization strategy for electricity retailers with energy storage system considering two-stage demand response. Appl. Energy 271, 115155. doi:10.1016/j.apenergy.2020.115155
Li, J., Wang, Z. X., and Yue, Q. (2012). Triangular approximation preserving the centroid of fuzzy numbers. Int. J. Comput. Math. 89 (6), 810–821. doi:10.1080/00207160.2012.659664
Li, J., Zhang, N., Chai, X., et al. (2023). “Assessment of guaranteed power supply profit and loss of power grid under agent purchasing policy,” in 2023 8th Asia Conference on Power and Electrical Engineering (ACPEE) (IEEE), 1039–1044.
Luo, S., Jiang, C., Wang, X., et al. (2019). Power trading strategy and risk assessment of electricity retailing company under power system reform. Power Syst. Technol. 43 (3), 944–953.
Pamučar, D., Stević, Ž., and Sremac, S. (2018). A new model for determining weight coefficients of criteria in mcdm models: full consistency method (fucom). Symmetry 10 (9), 393. doi:10.3390/sym10090393
Russo, M., Kraft, E., Bertsch, V., and Keles, D. (2022). Short-term risk management of electricity retailers under rising shares of decentralized solar generation. Energy Econ. 109, 105956. doi:10.1016/j.eneco.2022.105956
Stanković, M., Stević, Ž., Das, D. K., Subotić, M., and Pamučar, D. (2020). A new fuzzy MARCOS method for road traffic risk analysis. Mathematics 8 (3), 457. doi:10.3390/math8030457
Tang, L., Liu, J. C., Yang, Y. F., et al. (2019). Study on strategies of electricity procurement and sale of power retailer with multiple retail contract modes based on information gap decision theory. Power Syst. Technol. 43, 1978–1988.
The National Development and Reform Commission (2021). Notice on Matters related to the organization of power grid enterprise agent purchasing Work [EB/OL]. Available at: https://www.ndrc.gov.cn/xwdt/tzgg/202110/t20211026_1300893.html (Accessed on October 23, 2021).
Walawalkar, R., Fernands, S., Thakur, N., and Chevva, K. R. (2010). Evolution and current status of demand response (DR) in electricity markets: insights from PJM and NYISO. Energy 35 (4), 1553–1560. doi:10.1016/j.energy.2009.09.017
Wang, D., Ding, W., Gao, F., Xu, Y., and Hu, J. (2021). Influence of guaranteed power supply service on competitive power market and compensation mechanism design. IOP Conf. Ser. Earth Environ. Sci. 621 (1), 012167. doi:10.1088/1755-1315/621/1/012167
Yu, S., Wen, B., Wang, L., and Chen, J. (2018). Electricity purchasing strategy for the regional power grid considering wind power accommodation. IEEE Trans. Electr. Electron. Eng. 13 (8), 1110–1118. doi:10.1002/tee.22673
Zhang, Y., Zhao, H., Li, B., and Qi, Z. (2022). Research on credit rating and risk measurement of electricity retailers based on Bayesian Best Worst Method-Cloud Model and improved Credit Metrics model in China's power market. Energy 252, 124088. doi:10.1016/j.energy.2022.124088
Zhao, C., Sun, J., He, P., Zhang, S., and Ji, Y. (2023). Integrating risk preferences into game analysis of price-making retailers in power market. Energies 16 (8), 3339. doi:10.3390/en16083339
Zhao, H. Y., Tan, F. Z., Ju, W. L., and Chen, Z. H. (2013). The electricity purchasing and selling risk control optimization model for power grid corporation. Appl. Mech. Mater. 2607 (389-389), 161–165. doi:10.4028/www.scientific.net/amm.389.161
Keywords: grid enterprises, agency power purchase business, risk evaluation, fuzzy full consistency method, MARCOS
Citation: Gan Y, Zheng C, Chu B, Li J, Zhang Y and Jia Y (2024) Research on the risk assessment of the power grid enterprises’ agency power purchase business in China: A hybrid multi-attribute decision-making framework based on FUCOM-F and GRA-MARCOS. Front. Energy Res. 12:1376531. doi: 10.3389/fenrg.2024.1376531
Received: 25 January 2024; Accepted: 16 April 2024;
Published: 28 May 2024.
Edited by:
Tianyang Zhao, Royal Institute of Technology, SwedenReviewed by:
Xiaomin Xu, North China Electric Power University, ChinaCopyright © 2024 Gan, Zheng, Chu, Li, Zhang and Jia. This is an open-access article distributed under the terms of the Creative Commons Attribution License (CC BY). The use, distribution or reproduction in other forums is permitted, provided the original author(s) and the copyright owner(s) are credited and that the original publication in this journal is cited, in accordance with accepted academic practice. No use, distribution or reproduction is permitted which does not comply with these terms.
*Correspondence: Yixin Jia, MTIwMjIyMjA2MzE0QG5jZXB1LmVkdS5jbg==
Disclaimer: All claims expressed in this article are solely those of the authors and do not necessarily represent those of their affiliated organizations, or those of the publisher, the editors and the reviewers. Any product that may be evaluated in this article or claim that may be made by its manufacturer is not guaranteed or endorsed by the publisher.
Research integrity at Frontiers
Learn more about the work of our research integrity team to safeguard the quality of each article we publish.