 Ma Aiqing
 Gao Dawei
- Department of Electrical Engineering, Shanghai University of Electric Power, Shanghai, China
A transformer inter-turn fault identification method is proposed based on the digital twin concept to tackle the challenges of high operational complexity and low accuracy associated with traditional transformer fault identification methods. Initially, the Bald Eagle Search algorithm is employed to optimize the critical parameters of the Extreme Learning Machine (ELM), determining the optimal input layer weight and hidden layer threshold of the Extreme Learning Machine. Subsequently, leveraging the digital twin concept, a digital replica of the physical transformer is established, enabling multi-physical field coupling simulation encompassing electrical, thermal, and acoustic domains to elucidate the variation patterns of various physical parameters across different operational scenarios and fault scenarios. Furthermore, key physical characteristic parameters such as sound pressure and winding hot spot temperature are carefully selected to drive a fault identification model tailored to inter-turn faults within the framework of the digital twin concept. Through a detailed investigation using 630 kV A/10 kV transformers as a case study, the results exhibit an impressive fault identification accuracy of 95.24% for the proposed method. Comparative analysis reveals notable enhancements in fault identification accuracy of 12.22%, 7.85%, and 3.73% for ELM, Support Vector Machine and Tuna Swarm Optimization—ELM models, respectively. These findings underscore the effectiveness and practicality of the transformer inter-turn fault identification method based on the digital twin concept, offering valuable insights for the real-time monitoring and diagnosis of inter-turn faults in transformers.
1 Introduction
Winding faults in oil-immersed transformers are a prevalent type of fault encountered in power transformers (FAIZ and SOLEIMANI, 2017), with inter-turn faults accounting for over 60% of all such faults (MORADZADEH et al., 2021). In the initial stages of inter-turn faults in transformers, they are often characterized by partial discharge and local high temperatures. However, if left unaddressed for an extended period, these faults can escalate and lead to more severe issues like inter-turn short circuits and phase faults. This can ultimately result in a reduced insulation life of transformers and even equipment damage (Liu et al., 2023), leading to significant losses in transformers and power systems. Therefore, accurately and promptly identifying faults in oil-immersed transformers during the early stage of inter-turn faults is of considerable research significance.
In modern times, the identification of inter-turn faults in oil-immersed transformers primarily involves the analysis of key parameters such as winding current, magnetic flux distribution, and hot spot temperature (Etumi and Anayi, 2016; CUI et al., 2020). While an inter-turn fault identification method utilizing electric-thermal fusion analysis has been proposed, its accuracy in detecting low-voltage mild faults is limited to 77% (Zhang et al., 2023). This limitation arises from the fact that during minor inter-turn faults in a transformer, the fault current within the coil is minimal, resulting in subtle changes in the magnetic field, low sensitivity, and insignificant temperature variations. Research has delved into the distribution characteristics of vibration acceleration and magnetic flux density in inter-turn fault windings of single-phase transformers, comparing findings with experimental data (Pan et al., 2020). Moreover, the monitoring of frequency response function distribution during inter-turn faults in transformers through pulse short circuit tests has provided valuable insights (Lin et al., 2018). The occurrence of inter-turn faults in transformers triggers abrupt changes in current and magnetic fields, leading to elevated internal temperatures and intensified mechanical vibrations (SOLEIMANI et al., 2020). Through a comprehensive examination of the interplay among multiple physical parameters and the judicious selection of key parameters as identification signals, the accuracy of inter-turn fault detection can be significantly enhanced. Reference (Zhang et al., 2021) has pioneered the establishment of a digital twin of a physical transformer using digital twin technology, enabling the deduction of inter-turn faults and offering a novel avenue for studying the identification of such faults in transformers.
With the advancement of digital twin technology, rapid and efficient artificial intelligence concepts have been integrated into traditional transformer fault identification methods. Conventional approaches to transformer fault identification primarily involve genetic algorithms, SVM, BP neural networks, among others. References (WU et al., 2019; WANG and HAN, 2021; XU et al., 2022) have introduced a fault identification method based on residual BP neural network, demonstrating superior diagnostic accuracy compared to traditional BP neural networks (ZHAO et al., 2020). While this method performs well with small sample data, it is less suitable for large data samples. Meanwhile, references (Kari et al., 2018; LIJ et al., 2021) have proposed a fault identification method that combines genetic algorithms and SVM, with research indicating that the fusion algorithm yields more accurate identification results than traditional methods. In another vein, references (YUAN et al., 2013; MENGL et al., 2016) have utilized Extreme Learning Machine (ELM) to identify and analyze inter-turn faults in the gas content of transformer oil. Owing to its formidable computing power and swift training speed, ELM enjoys broader application. However, given the random generation of input layer weights and hidden layer thresholds during its training process, it becomes imperative to judiciously optimize its key parameters (Xin et al., 2016). Enter the Bald Eagle Search Algorithm (BES) (ALSATTAR et al., 2020), a novel metaheuristic algorithm renowned for its robust search capabilities in optimizing key parameters and effectively addressing complex parameter optimization problems.
This article introduces a multi-physical parameter identification method for detecting inter-turn faults in transformers, leveraging the BES-ELM framework. The approach involves using the Bald Eagle Search Algorithm (BES) to optimize the key parameters of Extreme Learning Machine (ELM), thereby attaining optimal input layer weights and hidden layer thresholds for ELM. In line with the digital twin concept, a digital twin model mirroring a physical transformer is meticulously crafted. Through the creation of a multi-physical field coupling encompassing electricity, heat, and sound, simulations are conducted to deduce the physical parameters across various operational and fault scenarios. Subsequently, a fault identification model driven by inter-turn fault data is developed, selecting key parameters showcasing multiple physical traits like sound pressure and winding hot spot temperature. These parameters are harnessed to establish a robust diagnostic model for transformer faults. In the experimental phase, 12 multi-physical feature parameters are utilized as input signals for the transformer fault diagnosis model, while the inter-turn fault type serves as the output signal for the identification model. Following rigorous training and testing, the results demonstrate that the proposed research methodology exhibits enhanced speed and accuracy in identifying inter-turn faults within transformers.
2 BES-ELM principle
ELM is a classic single hidden layer feedforward neural network, which consists of three layers: input layer, hidden layer, and output layer. The schematic diagram of the network structure is shown in Figure 1.
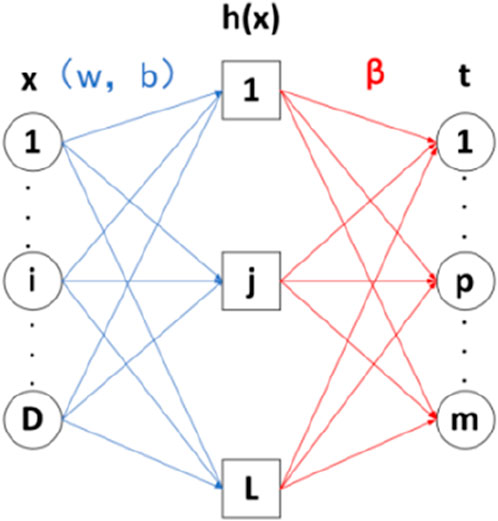
Figure 1. Schematic diagram of extreme learning machine.
The operational process is as follows: Initially, the number of neurons in the hidden layer is inputted. Subsequently, the connection weights between the input layer and the hidden layer, along with the threshold of the hidden layer neurons, are randomly set. Then, an activation function is selected, and the output matrix of the hidden layer neurons is calculated, followed by computing the output weights.
For D samples (xi,ti), ELM with L hidden layers can be represented as (Eqs 1–3):
Its matrix form is represented as:
In the formula:
In the formula: H is the output matrix for hidden layers,β is the output weight matrix, T is the output matrix for the objective function. F is the Activation function used for hidden layer neurons, we use sigmoid (MATIAST et al., 2014), Obtain the output weight matrix by inverting the generalized matrix.
It can be seen that the values of Wi and bi have a significant impact on the accuracy and effectiveness of fault identification. As they are randomly generated and have a lot of uncertainty, the BES algorithm is introduced to optimize their key parameters and obtain the best weights to construct a fault identification model.
BES algorithm is an innovative intelligent optimization technique renowned for its robust global search capabilities and rapid convergence speed. It emulates the hunting process of bald eagles for segmented optimization, delineated into three distinct stages: initially, the algorithm randomly selects the search space; subsequently, it scours the space for prey; and finally, it swoops down to capture the quarry (Long et al., 2022).
1) Randomly select the search space and update the best search position according to the number of prey. The position update formula is (Eq. 4)
Where:Pi,new is the position of the ith vulture after updating; Pi is the position of the ith vulture before updating; R is a random number within (0, 1); A is the control parameter, and the range is (1.5, 2); Pmean is the average distribution position; Pbest is the current best search location.
2) The update formula (Eqs 5–8) for the spiral flight position of a bald eagle in the search space is
Where:
3) The equation of state for a bald eagle flying from its optimal diving position to its prey is (Eqs 10–12)
Where:c1 and c2 is the movement intensity of the vulture toward the center, their value range is (1, 2).
The process for the BES-ELM fault diagnosis model is illustrated in Figure 2. The specific steps for conducting a fault diagnosis are as follows:
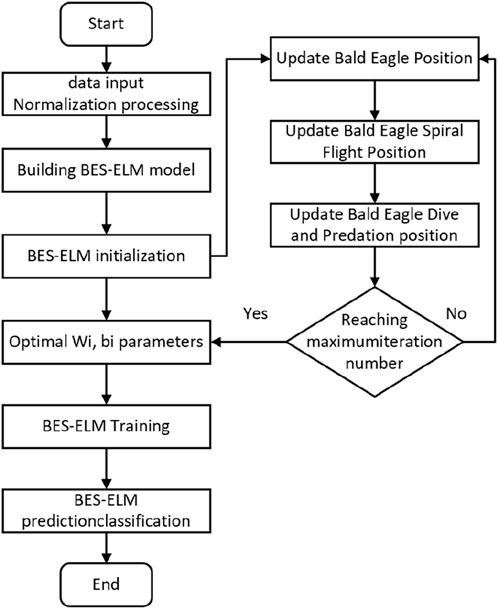
Figure 2. Flow Chart of BES-ELM Fault identification Model.
Step 1: Normalize the multi-physical characteristic parameters of the oil-immersed transformer and establish them as model inputs.
Step 2: Set the fitness function by utilizing BES-ELM to predict the accuracy of sample output as a fitness function, which is used to compute the initial individual’s fitness value.
Step 3: Conduct the Bald Eagle Search Algorithm process, updating the bald eagle position, spiral flight position, and diving and predation position.
Step 4: Calculate the fitness of the offspring and merge it with the parent individual, leaving only individuals with better fitness.
Step 5: Iteratively repeat steps 3 and 4 until reaching the maximum number of iterations.
Step 6: Output the optimized input weight (Wi) and hidden layer bias matrix (bi), and construct the BES-ELM fault diagnosis model.
Step 7: Train the model for classification and prediction of inter-turn fault diagnosis in oil-immersed transformers.
3 Identification method for inter-turn faults in transformers based on digital twin
The fundamental concept of the inter-turn fault identification method for transformers, grounded in the digital twin paradigm, is depicted in Figure 3. The research inquiry is segmented into four modules as follows: 1) Development of a digital space model for transformers. 2) Execution of multi-physics field coupling simulations under normal operational circumstances. 3) Derivation of multi-physics characteristic parameters in the presence of inter-turn faults. 4) Implementation of data-driven techniques using twin data for inter-turn fault identification in transformers.
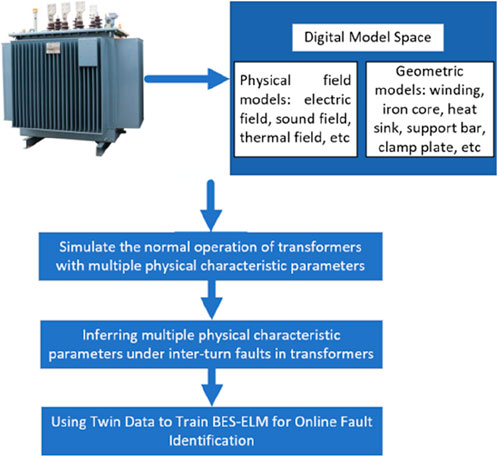
Figure 3. Flowchart of Transformer inter-turn Fault Identification Based on Digital Twin.
3.1 Construction of transformer digital mode
This article focuses on a three-phase oil-immersed transformer with a 630 kVA capacity and high and low winding voltages of 10/0.4 kV. The COMSOL finite element simulation software is utilized to construct a digital model of the physical transformer. Figure 4A illustrates the comprehensive architecture of the transformer, comprising primarily an iron core, winding, oil tank, and heat sink. To enhance the realism of the simulation results, the study encompasses not only the winding and iron core within the transformer, but also considers the oil, support bars, and clamps. Figure 4B presents the essential internal structure of the transformer. Owing to the substantial quantity of windings, accurately segmenting the digital model grid poses a challenge, leading to extensive computation times. To expedite calculations and conserve memory, it is imperative to examine and process the windings in blocks. Additionally, taking into account the physical properties of transformer oil, parameters such as density, specific heat capacity, dynamic viscosity, and thermal conductivity are established as temperature-dependent functions.
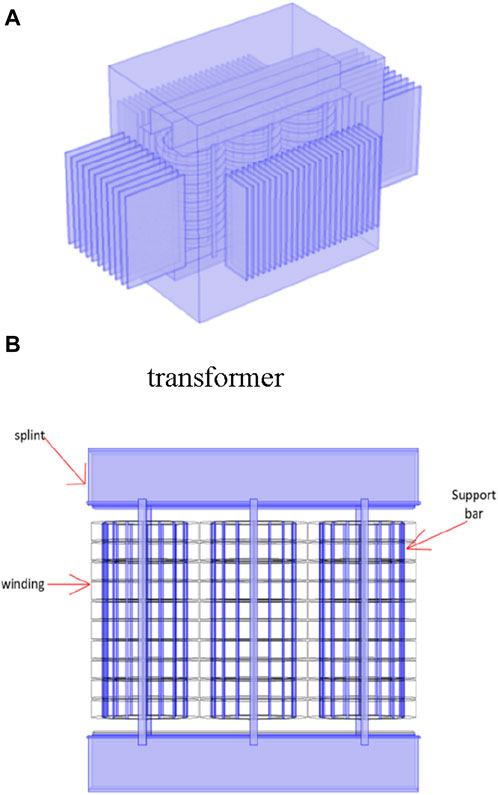
Figure 4. (A) Overall architecture diagram of transformer. (B) Key internal structure diagram of transformer.
3.2 Multi-physical coupling simulation during normal operation of transformers
Examining 630 kV A/10 kV oil-immersed transformers as the focal point of study, the inter-turn faults under diverse conditions are inferred. Upon referencing pertinent historical data, it was ascertained that the transformer’s load factor k predominantly ranges between 0.7 and 1.2. To this end, six load segments were established with an increment of 0.1. The environmental temperature typically clusters within the range of −10°C–40°C. By employing a 5°Cinterval, 11 temperature segments were defined. Furthermore, fluctuations in ambient wind speed can impact the convective heat transfer coefficient on the transformer’s surface. In this regard, ambient wind speeds of 3 m/s and 12 m/s were selected. Consequently, 18 distinct practical scenarios were formulated, enabling an exploration of the electrical, mechanical, thermal, and acoustic interactions in normal transformers across various operational scenarios. This investigation sought to derive the multi-physical characteristic parameters of transformers during routine operation within their respective operational contexts.
3.3 Simulation and deduction of multiple physical characteristics under inter-turn faults
As seen in Figure 5, in light of this article’s three-phase symmetrical structure model of the transformer, coupled simulation analysis was performed on the inter-turn fault configuration of the B-phase winding. This is also applicable to inter-turn faults in windings A and C, although not discussed here. Considering the actual circumstances surrounding inter-turn faults, six fault locations and three fault grades were designated for fault settings. The severity of the fault is defined as the percentage of defective turns relative to the total number of windings. Through randomly selecting the composition of working sections between environmental temperature, wind speed, and load coefficient, corresponding boundary conditions were established to simulate the occurrence of inter-turn faults.

Figure 5. Inter-turn Fault Circuit Diagram.
3.4 Inter-turn fault identification based on BES-ELM and multi-physical feature parameter fusion analysis
When a transformer encounters an inter-turn fault, its primary characteristics manifest as partial discharge and localized high temperature. The magnetostrictive effect of the iron core is heightened under the influence of electromagnetic and temperature fields. Concurrently, due to electrical and thermal stresses, the vibration of the iron core and winding amplifies, culminating in noise generation. Through an examination of the interplay of multiple physical fields during inter-turn faults in transformers, various physical characteristic parameters encompassing current, temperature, and sound pressure were extracted. Specifically, the pivotal characteristic parameters selected for identifying inter-turn short circuit faults include:Environmental parameters, such as ambient temperature and wind speed; Electrical parameters such as encompassing the current flow on the high-voltage and low-voltage sides of the B-phase winding, along with the current ratio between the high-voltage and low-voltage sides); Temperature parameters such as comprising the top oil temperature, bottom oil temperature, and hot spot temperature of the high and low voltage windings of phase B; Sound pressure metrics such as including the maximum and minimum sound pressures on the surface of the transformer oil tank, as well as the ratio of the maximum to minimum sound pressure on the tank’s surface.
By employing the aforementioned key characteristic parameters for transformer fault identification, a total of 550 sets of actual scene characteristic parameters were obtained through simulation and deduction of multiple physical traits during inter-turn faults. Out of these, 440 sets of data were allocated for the training set of the fault identification model, while 110 sets were designated for testing purposes. These encompass six distinct degrees of corresponding fault types. The BES-ELM fault identification model was utilized as the fault classifier, with the input node set to 12 and the output node set to six based on key feature parameters and fault types. To mitigate the impact of numerical fluctuations in key multi-physical characteristic parameters on the training process, a normalization method was uniformly applied to process each paired dataset. Through this standardization process, parameter information with relatively minimal absolute numerical fluctuations was obtained.
4 Example simulation analysis
4.1 Coupling simulation of transformer rated operation.
This study focuses on a 630 kV A/10 kV three-phase oil-immersed transformer as the subject of research, with its main parameters detailed in Table 1. Initial conditions were established, with an ambient temperature of 20°C, wind speed of 3 m/s, and a load factor of K = 1.0. A comprehensive multi-physical field coupling analysis of the electric, thermal, and acoustic fields was conducted using finite element software. The coil was uniformly configured with multiple turns, and a sine source power supply was selected for excitation, operating at a frequency of 50 Hz with a phase difference of 2/3. Initial temperature values for the internal components and shell heat sinks of the transformer were set to align with the ambient temperature. The iron core, composed of magnetostrictive material, was defined as nonlinear isotropic. The background sound pressure was set to Pa, with the sound propagation boundary established as a perfectly matched layer (Bing et al., 2021). The winding material was specified as copper from the material library. Furthermore, the transformer oil was characterized using a linear elastic model and described as a weakly compressible fluid. The surface heat flux at the bottom of the transformer oil tank was set to h = 4w/(m2·K), while the heat flux on other surfaces of the transformer oil tank was designated as h = 10w/(m2·K), and the heat flux of the heat sink was defined as h = 15w/(m2·K).
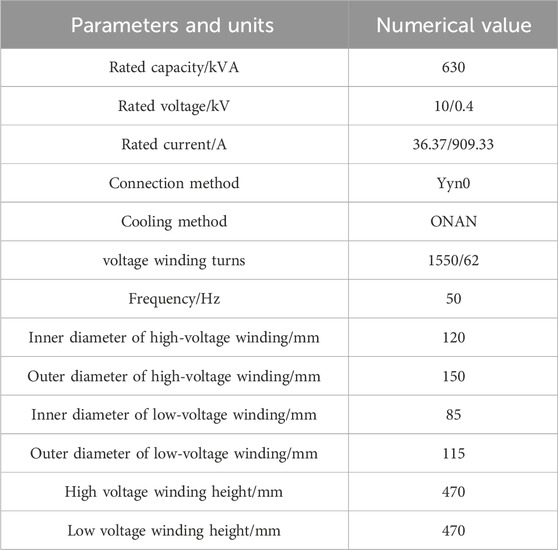
Table 1. Main parameters of transformer.
Taking the occurrence of a single inter-turn fault on the low-voltage side of a three-phase transformer as an example for in-depth analysis. When the insulation performance between turns of a transformer is good, the resistance is high and the current is almost zero. As the insulation performance decreases, the resistance decreases, and the energy loss on the resistance will significantly increase. When a short circuit occurs due to insulation breakdown between turns, the resistance rapidly decreases, and the equivalent parallel capacitance branch can be ignored. Each winding can be equivalent to a series model of resistance and inductance. According to the figure below, IA, IB, and IC respectively represent the phase current on the high voltage side of an oil immersed transformer during a inter-turn fault on the low voltage side; Ia, Ib, and Ic represent the phase current during low-voltage inter turn faults; Is represents inter turn fault short circuit circulating current; Is represents the current flowing through the inter turn fault coil; Ras represents the resistance of the faulty coil; Rs represents the equivalent fault resistance of inter turn faults; M represents the mutual inductance between each winding. Due to the presence of inter turn faults, mutual inductance between the same winding cannot be ignored.
Figure 6 presents the current variation curve in the three-phase winding of the transformer during regular operation. Given the symmetrical distribution structure of the three-phase winding, let’s consider the B-phase winding for analysis. From the illustration, it is evident that the maximum current on the high-voltage side of the B-phase during normal operation reaches 36.803A, while the maximum current on the low-voltage side of the B-phase is 902.17A. Notably, the rated current of this transformer stands at 36.37/909.33A, falling well within the permissible operating error range.
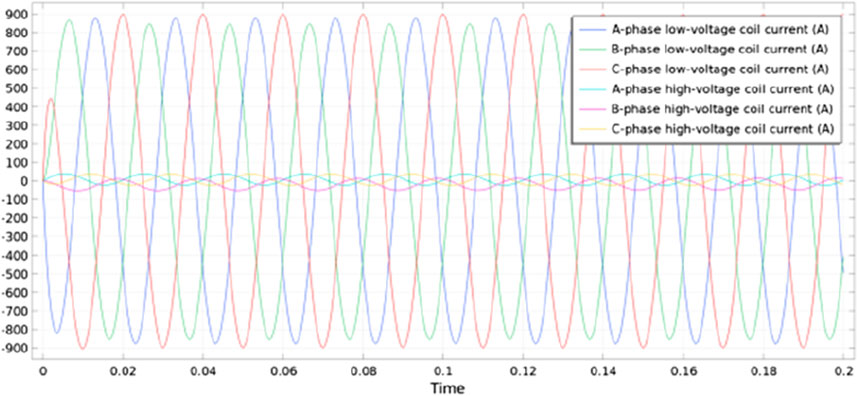
Figure 6. Diagram of current variation during rated operation of transformer.
AUtilizing the inherent FFT function (time-domain to frequency-domain conversion) within the COMSOL software, the analysis delves into the time-domain vibration acceleration serving as the excitation source for the sound field. Adhering to the established research protocols outlined in pertinent literature, the investigation focuses on the sound pressure distribution map at 100 Hz. The simulation results unveil the sound pressure distribution across the surface of the fuel tank, as depicted in Figure 7. Noteworthy findings reveal a maximum sound pressure of 31.6 Pa and a minimum sound pressure of −59.4 Pa on the fuel tank’s surface.
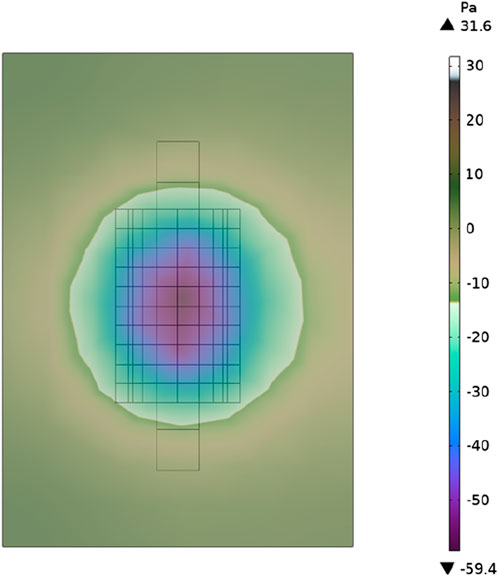
Figure 7. Sound pressure distribution diagram during rated operation of transformer.
After 3–4 h of continuous operation, if the temperature variation remains below 1°C, it indicates that the model has achieved a steady state. The simulation outcomes during rated operation are visually represented in Figures 8, 9. Specifically, the temperature span of the high-voltage winding ranges from 27°C to 42.2°C, while the low-voltage winding registers temperatures between 36.9°C and 46.9°C. Notably, with an increase in the winding height, there is a gradual rise in the winding temperature, although a slight decrease is observed at the top, aligning with pertinent research findings.
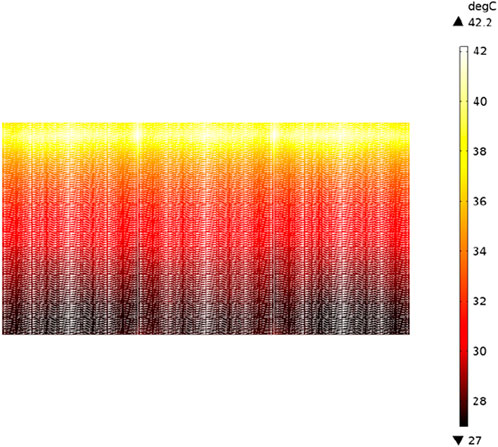
Figure 8. Temperature diagram of high-voltage winding during rated operation of transformer.
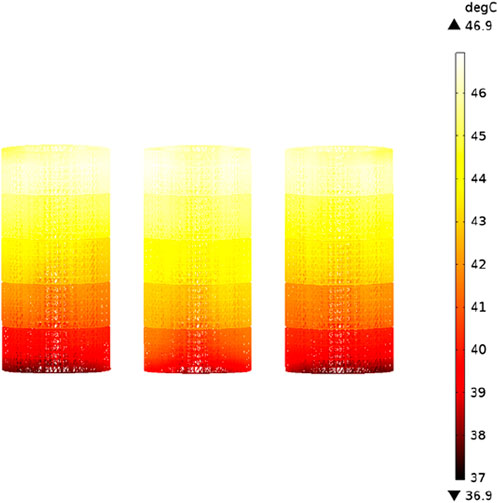
Figure 9. Temperature diagram of low-voltage winding during rated operation of transformer.
To ascertain the accuracy and rationality of the established model, a comparative analysis was conducted between the simulated values of the winding’s hot spot temperature and the calculated values in accordance with GB/T 1094.7-2008 guideline (China Standards Press, 2008). Moreover, the simulated surface sound pressure of the fuel tank was compared with the experimental verification method for load noise outlined in reference (REIPLINGER, 1988). As illustrated in Table 2, the obtained results reveal that the multi-physical characteristic parameters derived from simulation and the numerical errors obtained from analytical experiments both fall within 6%, signifying that the digital twin model established in this paper can effectively and accurately reflect the multi-physical characteristic parameters of real transformers.
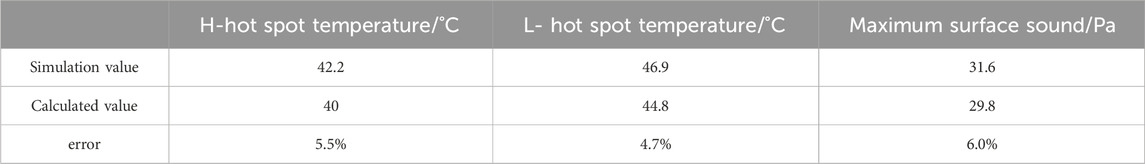
Table 2. Comparison of multiple physical parameters.
4.1 Coupling simulation of transformer inter-turn fault
Using a 1% inter-turn fault scenario positioned at the apex of the B-phase high-voltage winding as a case study, various physical characteristic parameters under such fault conditions were derived and thoroughly analyzed. As seen in Figure 10, notably, it was observed that the occurrence of a 1% inter-turn fault within the high-voltage winding of phase B in the transformer led to minimal changes in the winding current before and after the AC two-phase fault. However, in the event of a inter turn short circuit fault, a reverse current surged within the faulty coil, reaching a peak amplitude of 252.12A, representing an escalation of 6–7 times in comparison to the coil current under normal operating conditions.

Figure 10. Current diagram of transformer B phase high-voltage winding after fault.
Figure 11 illustrates the surface sound pressure distribution diagram of the transformer winding in the event of a 1% inter-turn fault on the high-voltage side of phase B. The depicted results indicate that when such fault occurs, the sound pressure distribution across the transformer oil tank surface ranges from −148 to 65.9 Pa. Upon comparison with values recorded during non-fault conditions, it is evident that the maximum sound pressure on the transformer oil tank’s surface increases from 31.6 to 65.9 Pa, while the minimum sound pressure decreases from −59.4 to −148 Pa.
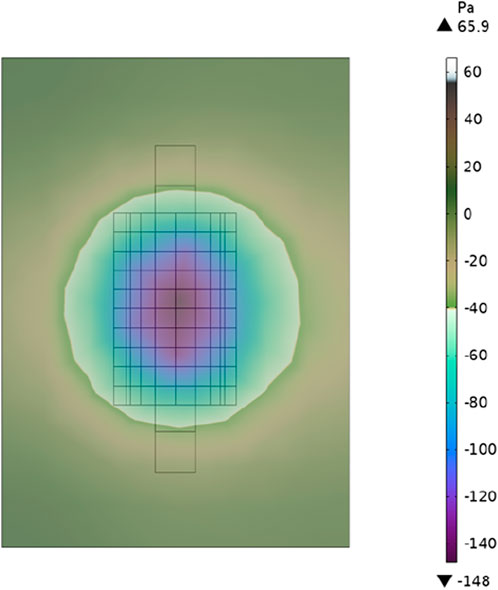
Figure 11. Surface Sound Pressure of Oil Tank after Transformer inter-turn fault.
Figures 12–14 depict the temperature simulation results 3 hours subsequent to the occurrence of the inter-turn fault. These results reveal that the temperature of the coil located at the inter-turn fault site is substantially higher than that of the surrounding winding, with the maximum temperature of the winding escalating from 42.2°C to 80.1°C - an increase of 37.9°C. Similarly, the maximum temperature of the low-voltage winding increased from 46.9°C to 56.4°C, signifying an elevation of 9.5°C. This temperature variation can be attributed to the loss of the winding, which is directly proportional to the magnitude of the current upon inter-turn fault occurrence. As such, the current within the faulty coil amplifies by a factor of six to seven, leading to an increase in loss. Furthermore, the heat transfer process in the high-voltage winding also causes a rise in temperature for its low-voltage counterpart. An analysis conducted on the surface temperature of the oil tank post-transformer failure corroborates these findings, with the maximum temperature on the transformer oil tank’s surface surging from 36.3°C to 46°C - an increase of 9.7°C.
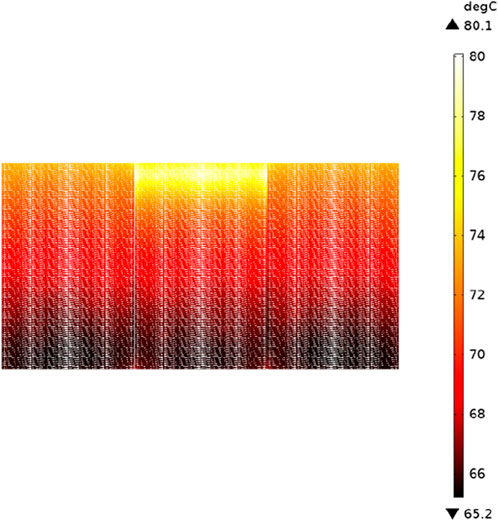
Figure 12. Temperature diagram of high-voltage winding after transformer inter-turn fault.
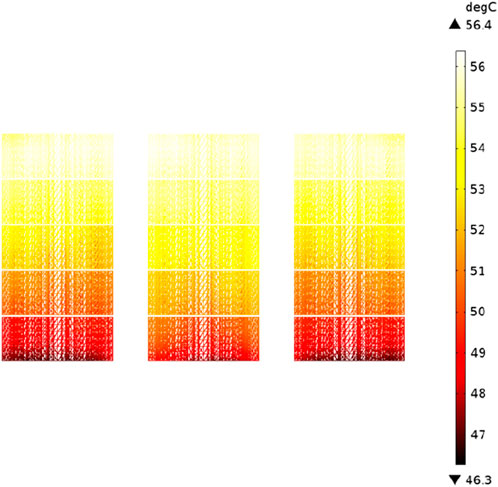
Figure 13. Temperature diagram of low-voltage winding after transformer inter-turn fault.
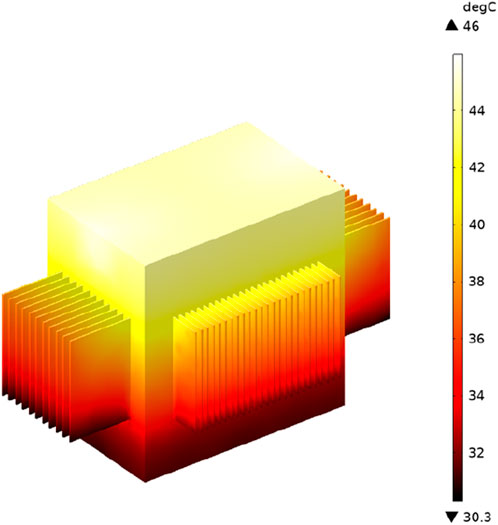
Figure 14. Temperature diagram of oil tank after transformer inter-turn fault.
4.2 Analysis of transformer inter-turn fault identification results based on digital twin concept
BThrough the meticulous recording and organization of multiple physical characteristic parameters pertaining to inter-turn faults extracted from the digital twin model, a fault identification model is meticulously trained using Matlab. The results of the identification tests conducted on its test set are then thoroughly compared and analyzed. Upon scrutinizing the iteration curves of SVM, ELM, TSO-ELM, and BES-ELM, it becomes apparent that the fault identification model proposed in this study, utilizing BES-ELM, exhibits a notably swifter convergence rate. Remarkably, it attains the convergence state by the 24th attempt, boasting the highest fitness value among the various algorithms assessed, with merely two instances of veering into local optima. Contrastingly, other algorithms experience multiple occurrences of falling into local optima, underscoring the efficacy of the identification method predicated on BES-ELM and the fusion analysis of multiple physical parameters for inter-turn fault identification in the transformers under study.
CConducting a comprehensive comparative analysis and research on the identification outcomes of transformer inter-turn faults utilizing BES-ELM, ELM, SVM, and TSO-ELM models, Figures 15, 16 unveil insightful findings. Employing the SVM model for fault diagnosis resulted in 1 ①error, 5 ②errors, 1 ③error, 3 ④errors, 5 ⑤errors, and 1 ⑥error, yielding a commendable comprehensive fault diagnosis accuracy rate of 85.85%. Conversely, employing the ELM model for fault diagnosis led to 1 ①error, 3 ②errors, 1 ③error, 1 ④error, and 5 ⑤errors, culminating in a notably higher comprehensive fault diagnosis accuracy rate of 87.74%. Through a meticulous comparison and analysis of the identification results obtained from ELM and SVM, it is deduced that within the framework of the transformer inter-turn fault identification model established under the digital twin paradigm in this study, ELM surpasses SVM, showcasing superior identification performance.

Figure 15. Svm diagnosis results.
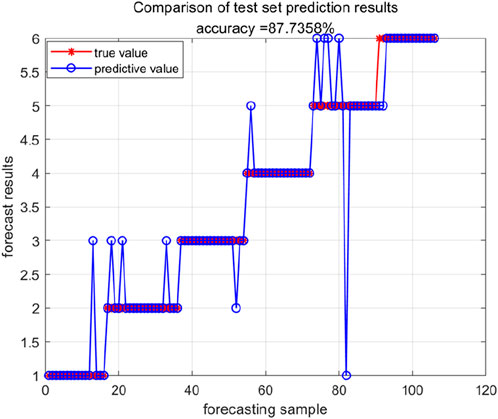
Figure 16. ELM diagnosis results.
Subsequently, the critical parameters of ELM undergo iterative optimization utilizing the TSO and BES optimization algorithms. Illustrated in Figures 17, 18, the application of the TSO-ELM model for fault diagnosis yielded 1 ①error, 3 ②errors, 1 ④error, 1 ⑤error, and 3 ⑥errors, resulting in an impressive comprehensive fault diagnosis accuracy rate of 91.51%. Conversely, employing the BES-ELM model for fault diagnosis led to 1 ①error, 1 ②error, 2 ④errors, and 1 ⑤error, showcasing a notably higher comprehensive fault diagnosis accuracy rate of 94.34%. These results underscore the efficacy of the optimization algorithms in enhancing the fault diagnosis accuracy of the ELM model, particularly highlighting the superior performance achieved through the utilization of the BES optimization algorithm.
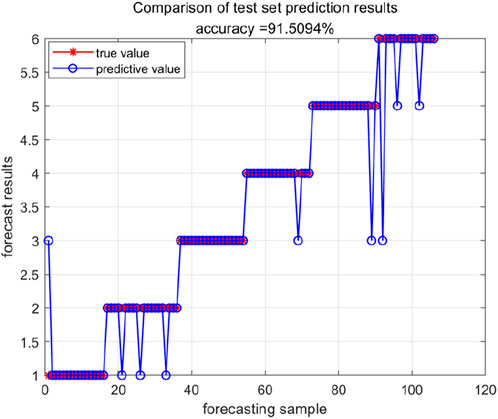
Figure 17. TSO-ELM diagnostic results.
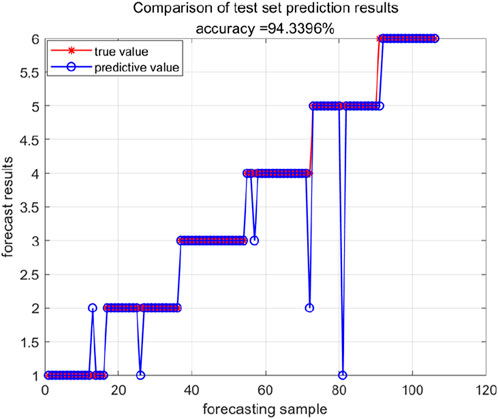
Figure 18. BES-ELM diagnosis results.
Conducting a detailed analysis of the identification outcomes derived from the four algorithms, the fault identification accuracy of the BES-ELM model attains an impressive 94.34%. In comparison to the identification results obtained from the other three algorithms, a substantial enhancement in diagnostic accuracy is observed, with improvements of 8.49%, 6.61%, and 2.83% noted, respectively. This notable progress underscores the marked advancements in diagnostic precision and convergence achieved through the implementation of the BES-ELM model and the fusion of multiple physical feature parameters for inter-turn fault diagnosis as proposed in this study. Consequently, this method emerges as highly suitable for early fault detection and diagnosis in instances of inter-turn faults occurring in transformers.
5 Conclusion
The methodology presented in this paper introduces a novel approach to identifying transformer inter-turn faults, leveraging the concept of a digital twin. Through the utilization of BES for optimizing the pivotal parameters of ELM and the integration of digital twin technology, a virtual counterpart of the actual transformer is created to replicate its operational processes accurately. This simulation facilitates the extraction of multiple physical characteristic parameters during inter-turn fault occurrences, which are subsequently harnessed for model training and identification purposes. As a result, the following conclusions can be derived:
1) The fault identification approach, which employs the BES algorithm to optimize the critical parameters of ELM, demonstrates superior and expedited convergence capabilities. Remarkably, the BES-ELM model achieves convergence by the 24th iteration and encounters local optima setbacks only twice, contrasting with other algorithms that frequently face challenges with local optima in fault diagnosis models.
2) Create a digital twin of a physical transformer utilizing digital twin technology. Through a comparison of simulated hot spot temperatures and sound pressures with analytically derived values, it is evident that the discrepancies are consistently below 6%. This outcome underscores the validity and precision of the model developed in this study.
3) Upon scrutinizing the identification outcomes from the four algorithms, it is evident that the accuracy of the BES-ELM fault model identification stands at an impressive 95.24%. In contrast to the identification results of the remaining three algorithms, there has been a notable enhancement in diagnostic accuracy by 12.22%, 7.85%, and 3.73%, respectively. Furthermore, the computational time is notably accelerated, thereby affirming the superiority of the BES-ELM model for transformer inter-turn fault diagnosis, showcasing enhanced diagnostic performance.
Data availability statement
The original contributions presented in the study are included in the article/Supplementary Material, further inquiries can be directed to the corresponding author.
Author contributions
MA: Supervision, Writing–original draft, Writing–review and editing. GD: Writing–original draft, Writing–review and editing. QT: Software, Writing–review and editing. WW: Software, Writing–review and editing.
Funding
The author(s) declare that no financial support was received for the research, authorship, and/or publication of this article.
Conflict of interest
The authors declare that the research was conducted in the absence of any commercial or financial relationships that could be construed as a potential conflict of interest.
Publisher’s note
All claims expressed in this article are solely those of the authors and do not necessarily represent those of their affiliated organizations, or those of the publisher, the editors and the reviewers. Any product that may be evaluated in this article, or claim that may be made by its manufacturer, is not guaranteed or endorsed by the publisher.
Supplementary material
The Supplementary Material for this article can be found online at: https://www.frontiersin.org/articles/10.3389/fenrg.2024.1376306/full#supplementary-material
References
Alsattar, H. A., Zaidan, A. A., and Zaidan, B. B. (2020). Novel meta-heuristic bald eagle search optimisation algorithm. Artif. Intell. Rev. 53 (3), 2237–2264. doi:10.1007/s10462-019-09732-5
Bing, Li, Wang, Z., Liu, H., et al. (2021). Experiment on vibro-acoustic characteristic of 500 kV single-phase transformer under DC-bias. Trans. China Electrotech. Soc. 36 (13), 2801–2811.
China Standards Press (2008). Power transformers Part 7: load guidelines for oil immersed power transformers. GB/T 1094.7-2008. Beijing: China Standards Press.
Cui, Y., Hou, H., Lei, S., Tao, Q., Gehao, S., and Xiuchen, J. (2020). A fault diagnosis method for power transformers considering unbalanced case samples. High. Volt. Eng. 46 (1), 33–41. doi:10.13336/j.1003-6520.hve.20191227004
Etumi, A. A., and Anayi, F. (2016). The application of correlation technique in detecting internal and external faults in three-phase transformer and saturation of current transformer. IEEE Trans. Power Deliv. 31 (5), 2131–2139. doi:10.1109/tpwrd.2016.2572608
Faiz, J., and Soleimani, M. (2017). Dissolved gas analysis evaluation in electric power transformers using conventional methods a review. IEEE Trans. Dielectr. Electr. Insulation 24 (2), 1239–1248. doi:10.1109/tdei.2017.005959
Kari, T., Gao, W., Zhang, Z., Mo, W., Wang, H., and Cui, Y. (2018). Transformer fault diagnosis based on support vector machine and genetic algorithm. J. Tsinghua Univ. Nat. Sci. Ed. 58 (7), 623–629. doi:10.16511/j.cnki.qhdxxb.2018.25.032
Lij, HAIC, Feng, Z., et al. (2021). A transformer fault diagnosis method basded on oarameters optimization of hybrid kernelextremelearningmachuine. IEEEAc-cess (99), 1. doi:10.1109/ACCESS.2021.3127164
Lin, C., Ou, X., Yang, X., Sun, W., Rao, Z., He, H., et al. (2018). Vibration characteristics of transformers under short-circuit impulse state and detection of inter turn short-circuit faults. High. Volt. Technol. 44 (11), 3569–3576. doi:10.19487/j.cnki.1001-8425.2018.09.015
Liu, G., Guan, Yu, Dong, M., Ma, X. S., Tang, Y. P., Liu, B., et al. (2023). Research progress on the characteristics and detection of inter turn faults in transformers. Insul. Mater. 56 (11), 1009–9239. doi:10.16790/j.cnki.1009-9239.im.2023.11.002
Long, W., Zhuo, C., Huang, W., Yinyuan, G., Xiang, L., Xucheng, C., et al. (2022). A reconstruction method for photovoltaic arrays under partial shading conditions based on the bald eagle search algorithm. Electr. Power Constr. 43 (3), 22–30. doi:10.12204/j.issn.1000-7229.2022.03.003
Matiast, SOUZAF. J. O. R., Araújo, R., and Antunes, C. H. (2014). Learning of a single-hidden layer feedforward neural network using an optimized extreme learning machine. Neurocomputing 129, 428–436. doi:10.1016/j.neucom.2013.09.016
Mengl, L. I. C., Zhang, X., and An, X. (2016). Compound feature selection and parameter optimization of ELM for fault diagnosis of rolling element bearings. ISA Trans. 65 (65), 556–566. doi:10.1016/j.isatra.2016.08.022
Moradzadeh, A., Pourhossein, K., Mohammadi-Ivatloo, B., and Mohammadi, F. (2021). Locating inter-turn faults in transformer windings using isometric feature mapping of frequency response traces. IEEE Trans. Industrial Inf. 17 (10), 6962–6970. doi:10.1109/tii.2020.3016966
Pan, C., Shi, W., and Tao, M. (2020). Research on the electromagnetic characteristics of inter turn short circuits in single-phase transformers. High. Volt. Technol. 46 (5), 1839–1856. doi:10.13336/j.1003-6520.hve.20200515040
Reiplinger, E. (1988). Study of noise emitted by power transform-ers based on today’s viewpoint. Paris: CIGRE.
Soleimani, M., Faiz, J., Nasab, P. S., and Moallem, M. Temperature measuring-based decision-making prognostic approach in electric power transformers winding failures measuring-based decision-making prognostic approach in electric power transformers winding failures. IEEE Trans. Instrum. Meas., 2020, 69(9)6995–7003. doi:10.1109/tim.2020.2975386
Wang, X., and Han, T. (2021). Transformer fault diagnosis based on Bayesian optimized random forest. Electr. Meas. Instrum. 58 (6), 167–173. doi:10.19753/i.issn1001-1390.2021.06.024
Wu, J., Weimei, Q. I. N., Liang, H., Jin, S., and Luo, W. (2019). Transformer Fault identification method based on adaptive limit learning machine. Electr. Power Autom. Equip. 39 (10), 181–186. doi:10.16081/j.epae.201908037
Xiaojun, Q., Xun, Li, Yangting, Ai, and Hansen, C. H. (2002). A waveform synthesis algorithm for active control of transformer noise: implementation. Appl. Acoust. 63 (63), 467–479. doi:10.1016/s0003-682x(01)00060-3
Xin, S., Zhu, Y., Ning, X., Wang, L., Sun, G., and Chen, G. (2016). Fault diagnosis of power transformers based on deep self coding networks. Power Autom. Equip. 36 (5), 122–126. doi:10.16081/j.issn.1006-6047.2016.05.021
Xu, L., Zhang, Y., Zhang, Q., Hu, K., Wang, M., and Zhang, G. (2022). Orthogonal experiment method based improved MRFO algorithm to optimize BP in transformer fault diagnosis. South. Power Syst. Technol. 16 (7), 46–54. doi:10.13648/i.cnki.issn1674-0629.2022.07.006
Yuan, J.-s., Zhang, L.-w., Wang, Y., and Shang, H.-k. (2013). Research on transformer fault diagnosis method based on extreme learning machine. ElectricalMeasurement&Instrumentation (12), 21–36. doi:10.19753/j.issn1001-1390.2020.13.001
Zhang, L., Gehao, S., Hou, H., and Jiang, X. (2021). Identification method of inter turn short circuit fault in oil immersed transformers based on fusion analysis of electric heating characteristics. Power Grid Technol. 45 (7), 2474–2482. doi:10.13335/j.1000-3673.pst.2020.2054
Zhang, L., Gehao, S., Zizhan, Ni, and Jiang, X. (2023). Research on the early electrothermal characteristics of inter-turn faults in oil immersed power transformers. J. Electr. Eng. 15 (43), 0258–8013. doi:10.13334/j.0258-8013.pcsee.220591
Keywords: oil immersed transformer, digital twin, bald eagle search algorithm, inter-turn fault, multiple physical characteristic parameters, fault identification
Citation: Aiqing M, Dawei G, Tonghui Q and Wei W (2024) Identification method for inter-turn faults in transformers based on digital twin concept. Front. Energy Res. 12:1376306. doi: 10.3389/fenrg.2024.1376306
Received: 25 January 2024; Accepted: 18 March 2024;
Published: 12 April 2024.
Edited by:
Shuqing Zhang, Tsinghua University, ChinaReviewed by:
Liu Gang, North China Electric Power University, ChinaCan Ding, China Three Gorges University, China
Copyright © 2024 Aiqing, Dawei, Tonghui and Wei. This is an open-access article distributed under the terms of the Creative Commons Attribution License (CC BY). The use, distribution or reproduction in other forums is permitted, provided the original author(s) and the copyright owner(s) are credited and that the original publication in this journal is cited, in accordance with accepted academic practice. No use, distribution or reproduction is permitted which does not comply with these terms.
*Correspondence: Gao Dawei, OTgxMzgxNzY4QHFxLmNvbQ==