 Tingting Hu1
 Bai Zhang
94% of researchers rate our articles as excellent or good
Learn more about the work of our research integrity team to safeguard the quality of each article we publish.
Find out more
ORIGINAL RESEARCH article
Front. Energy Res. , 27 March 2024
Sec. Sustainable Energy Systems
Volume 12 - 2024 | https://doi.org/10.3389/fenrg.2024.1374467
This article is part of the Research Topic Emerging Technologies for the Construction of Renewable Energy-Dominated Power System View all 32 articles
When multiple distributed PV (photovoltaic) systems are integrated into multiple nodes of the distribution network, this will lead to the significant influence of the grid-tied node voltage of the power distribution network resulting from the uncertainty of PV power. Therefore, this aspect needs to be further studied in terms of how to effectively characterize the uncertainty of the voltage influence in a grid-tied multi-PV system distribution network. Focusing on this problem, a modeling and analysis method for distribution networks with PV cells based on Markov global sensitivity is proposed in this paper. Firstly, a global Markov chain is constructed using the Markov chain and the power flow equation to model the uncertainty of PV power. Furthermore, a Markov global sensitivity function is proposed to characterize the influence degree of the voltage on the distribution network nodes while multi-point PV system are grid-tied to system. The case study results show that the uncertainty model of multi-point PV grid-connection can be effectively constructed using the proposed method in this paper, and the uncertainty influence analysis is accurate. This is of great significance for grid connection planning and the optimization control of new energy systems, as well as for the new energy consumption increase.
With the development of society, the demand for energy is increasing. Currently, the development of new energy is a dependable way to improve energy supply sustainability. Within new energy developments (Pan al., 2019; Tang et al., 2021; Liang et al., 2023), the PV system is attracting more and more attention.
A small or medium-sized PV cell constructed near load usually called distributed PV system, which is one of the main research directions. The distributed PV system is generally directly connected into the multiple nodes of low-voltage distribution networks.
In this grid-tied mode, on the one hand, the PV power is mostly used by the load of the distribution network, which improves the absorption rate of new energy (Li et al., 2023; Xuan et al., 2020; Reshikeshan et al., 2021; Xing and Mu, 2023); on the other hand, the multi-point integration into the distribution network mode will cause the changing of the node voltage of the distribution network. Further, the PV power is volatile and intermittent, resulting from climate factors, and the large and fluctuant PV power may result in an uncertain power flow and power quality problems in the distribution network, especially at the end of the low-voltage distribution network, which will cause power scheduling difficulties. In addition, the distribution network generally connects the load, which is also uncertain. Therefore, power uncertainty arises in the source side and the load side at the same time, which causes the stability to be challenged in lower voltage distribution networks (Jafari et al., 2022; Liu et al., 2022).
Therefore, the study on the PV power uncertainty is of great significance for distribution networks, in terms of the planning and construction of power systems, the consumption and improvement of new energy, etc.
In traditional research, PV power prediction and load power prediction are attracting more attention and lots of prediction methods have been proposed, which are useful for reducing the power uncertainty of PV cells and the load (Wang et al., 2022; Goh et al., 2023; Zhang et al., 2023; Zhou et al., 2023). Further, the PV power prediction results can be used to analyze its influence on a distribution network connected to PV cells.
In relevant research on the power uncertainty of PV cells connected to power systems, the output power uncertainty probability model of PV or other DG (distributed generation) systems can be modeled (Constante-Flores and Illindala, 2019; Palahalli et al., 2021; Rayati et al., 2022; Reddy et al., 2023), and then the power uncertainty probability model can be used for power flow calculations or power planning calculations. In (Constante-Flores and Illindala, 2019), a non-Gaussian model of DG is developed, namely, its output power uncertainty is represented in the form of a probability. Further, the PV power probability model and the control strategy can be combined together to optimize the control of the system power (Rayati et al., 2022).
On the network side, a probabilistic model of the distribution network’s voltage can be established and used. The power flow calculation is probabilistic and the optimal control of the reactive power and voltage can be achieved (Baptista et al., 2019; Chu et al., 2022). Further, focusing on the power uncertainty of DG systems, an ESS (energy storage system) can also be used to restrain the power uncertainty to achieve the optimal control of the system power (Hong and Wu, 2019).
In a distribution network, the power flow uncertainty caused by the uncertainty of PV power that can be analyzed from the perspective of control and scheduling; for example, economic optimal scheduling can be achieved based on deterministic mixed integer linear programming (L. Meng et al., 2022). And machine learning can also be used to estimate the power flow (A. Demazy et al., 2020). From the perspective of system scheduling, by coordinating the PV power and load, the optimal power flow of the system can be obtained (Widén et al., 2017; Hu et al., 2021).
However, while a large number of PV systems are connected into distribution networks, these DG systems are multi-coupled with distribution networks and loads; each node voltage of the distribution network is related to all the grid-tied PV. This means there is global uncertainty displayed between the photovoltaic and the distribution network, and this uncertainty is enhanced with the increase of PV connected to the network.
In traditional studies, global uncertainty modeling for PV systems and the impact analysis for distribution networks need to be studied further. Therefore, how to develop global uncertainty modeling for PV systems, and how to comprehensively represent the degree of influence on the distribution network tied in with multiple PV cells in a multi-node manner is the key content of this paper. Focusing on the above problems, a modeling and analysis method for a distribution network with multi-PVs based on the Markov global sensitivity for a multi-photovoltaic grid-tied network is proposed, in which a global Markov sensitivity function is established to be associated with the grid-tied PV and the distribution network, to accurately characterize the influence of the distribution network resulting from the PV power uncertainty.
This paper is organized as follows. In Section 2, the uncertainty analysis of PV connected into distribution network is carried out. In Section 3, the model based on global Markov sensitivity for multiple grid-tied PV cells is proposed. In Section 4, the case study is developed. Section 5 gives the conclusion of this paper.
Shown in Figure 1 is a diagram of a distribution network.
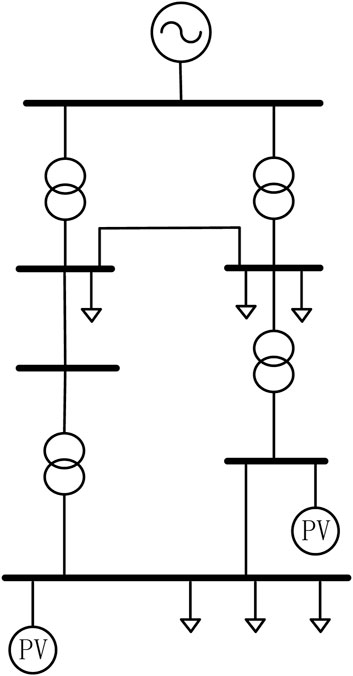
Figure 1. Diagram of a distribution network.
As shown in the Figure 1, the network contains multiple buses and nodes. The PV cells and loads are connected into the distribution network in different nodes. The output power of the PV is affected by a variety of climate factors, as shown below (Wang and Yang, 2017):
where A0 is a constant; μ is the Boltzmann constant; q is the electronic charge; ISC is the short circuit current varied with irradiation intensity; IDO is the equivalent saturation current of the diode; T is the environment temperature.
It can be seen from the above formula that the climate factors are the main factors to result in the strong uncertainty of PV power.
The PV system can be equivalent to a PQ node if the PV system is connected into a power system. With the fluctuation of grid-connected power, the power quality problem may be generated, such as voltage fluctuations, flicker, and other problems.
Uncertainty modeling is helpful to quantitatively understand the uncertainty of PV power. In this paper, a Markov chain is used to model the power state of PV cells.
The Markov chain is one of the typical algorithms used to describe the uncertainty of a random variable process, in which the present state can be used to describe the future state of the variable; the state of the variable at different times can present the variable development uncertainty. For a discrete power sequence {p1, p2 … … pt, pt+1}, the state in t+1 can be described by the following probabilities (He, 2008; Tabone and Callaway, 2015; Zhang et al., 2021):
where p is the probability of each state.
Figure 2 shows the process transfer between various random states:
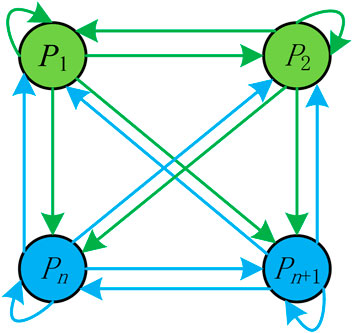
Figure 2. Diagram of the state transfer of power sequence.
As can be seen from Figure 2, each power state can be transferred to its own initial state or other states, and the transition uncertainty can be described by the transition probability. All the state transition processes can be represented as a state transition matrix:
where Amn is the transition probability. Namely, in the state transition matrix, each element corresponds to the transition probability of a variable state.
When modeling the power uncertainty of a PV cell, the historic data of the PV cell’s power are classified first to obtain different states. And then, the transfer probability matrix of the Markov chain is trained to obtain the uncertain Markov chain model for the target PV system.
However, in the case where multiple PV systems are connected into the distribution network in different nodes, the impact on the network from the PV cells is global and comprehensive, in other words, the node voltage of the distribution network is affected by all the grid-connected PV cells, to present the mutual coupling, which increases the difficulty of the relational analysis.
Therefore, how to intuitively and accurately characterize the effect caused by the grid-connected PV is one of the key aspects addressed in this paper.
Focusing on the mutual coupling of the node voltage and the multiple grid-tied PV, an uncertainty modeling and analysis method based on the Markov global sensitivity is proposed, in which the Markov chain is used to describe the uncertainty of PV power firstly, and then the Markov chain is combined with the node voltage distributed, to present the uncertainty between the PV power and the node voltage. Further, a sensitivity function is developed to quantitatively characterize the effect of the node voltage resulting from the multiple grid-tied PV cells.
The power flow of a traditional distribution network is in the form of a feeder line; the voltage of node i is related to the power and the line impedance, as in the following (Demazy et al., 2020; Wan, 2022; Yang et al., 2023):
where P is the active power; Q is the reactive power; R and X are the equivalent line impedance of the node i-1 and node i, respectively.
In traditional distribution networks, most of time, the load RL is connected into a node. However, with the development of new energy, more and more DGs are connected into distribution networks. The connected node is usually called PCC (point of common coupling). The modeling for the PCC voltage can be shown as the following:
where PPV and QPV are the active power and reactive power of the PV system into the PCC, respectively; QC is the reactive power of the local compensation.
It is assumed that the reactive power demand in PV systems and the load can be compensated completely by the local compensation device. Thus, the above formula can be simplified as the following:
where Q is the reactive power flow in the bus.
For the next node i+1, its active power can be obtained as the following:
The above discussion is about a distribution network connected a single PV. In cases where multiple PVs are connected into the distribution network, the modeling for node voltage is as follows:
where P01 and Q01 are the active power and reactive power of the initial node and its successive node, respectively; R01 and X01 are the equivalent line impedance between the initial node and its successive node, respectively.
Similarly, the voltage of node two and node three of the system is as follows:
And then, the voltage of node j can be obtained as the following:
If there are multiple PV cells connected into the node of a distribution network, the power between the node i and node j is as follows:
where P(i-1)i is the active power; Q(i-1)i is the reactive power; PLi, QLi, and QCi are the real power, reactive power, and the compensation reactive power of node i, respectively. PPVi is the real power of the PV cells in node i. Assuming that the reactive power of the node can be compensated completely and locally, the above, Formula (13), can be simplified as follows:
Taking Formula (14) and Formula (12) into Formula (11), the voltage model for node j is as follows:
As mentioned above, the output power of a PV can be seen as a discrete process. Therefore, the Markov chain can be used to describe the uncertainty in power transition. For the PV system in node i of a network, the PV power can be presented as a time series:
where n is the time number; PPVj is the output power in each time.
The output power PPVj can be converted to the power state as follows:
where k is the number of state; MPVj is the power state.
In this case, a T function can be defined to achieve the conversion between the PV power and the power state:
As mentioned above, the state transition processes of the PV power state can be represented as a state transition matrix A in Formula (3). Therefore, the PV power state conversion can be presented as follows:
And the PV power in the nth time can be obtained by the inverse transformation, as follows:
where σ is the correction factor. In the above process, the power error may be appear, therefore this correction factor is used to correct the PV power. While the Markov chain is constructed for a PV system, the transition error distribution can be extracted and it is used to generate the correction factor, namely, the correction factor can be obtained using the historical error statistics.
As can be seen from the above formulas, the Markov chain is used to describe the PV power uncertainty transfer process; the power uncertainty is represented as a probability function.
Taking Formula (20) into Formula (15), the voltage of node j can be obtained as follows:
The voltage error is as follows:
As can be seen from the above formulas, the PV power uncertainty is represented by the Markov chain, and then, Formula (22) shows the global voltage effect of the distribution network resulting from the PV power uncertainty.
Generally, In this paper, the Markov chain is used to present the uncertainty of PV power, in which the PV power in time t+1 can be obtained by the PV power in time t. Furthermore, the Markov model is combined with the above mentioned voltage model of distribution network, to describe influence of the voltage on the distribution network nodes resulted from the uncertainty of PV power.
A sensitivity function is usually used to describe the relationship among the variables quantificationally, as in the following (Xiong et al., 2021; Zhou and Zhang, 2021):
where y is dependent variable; x is the independent variable.
In this paper, in order to describe the relationship between the node voltage and the grid-tied PV power, the sensitivity function is developed as follows:
The above function is called the Markov global sensitivity, in which the power uncertainty of all the PV systems in a distribution network can be represented by the Markov chain.
As seen from the above mentioned, the proposed model is combined with the Markov chain, the voltage model of distribution network, and the sensitively function. By using the proposed model, the influence of the distribution network resulting from the PV power uncertainty can be characterized.
In order to verify the effectiveness of the proposed modeling method, an example is developed based on the IEEE 14-node model, in which three PV systems are grid-tied into the system, as 3 MW, 5 MW, and 10 MW. Several test cases are carried out as follows.
In order to test the feasibility of the proposed method, the voltage distribution of network is calculated by the proposed method and the traditional method, as shown in Figure 3.
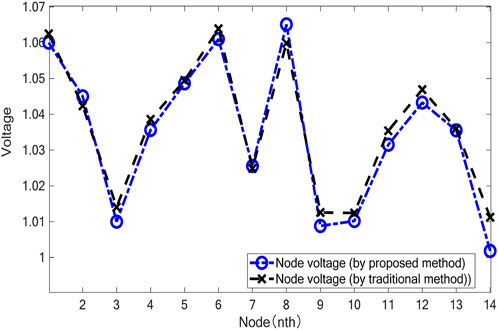
Figure 3. Voltage distribution.
It can be seen that the voltage distribution is basically consistent by using the proposed method and the traditional method, this verify the feasibility of the proposed method. Further, comparing with the traditional method, the proposed method combines the uncertainly analysis and the sensitivity analysis in the following test expediently.
The PV systems are connected into node nine of the distribution network. In this case, the power flow of the network will change, resulting in changing of the voltage distribution of the nodes; the voltage distribution and the voltage deviation are shown in Figure 4.
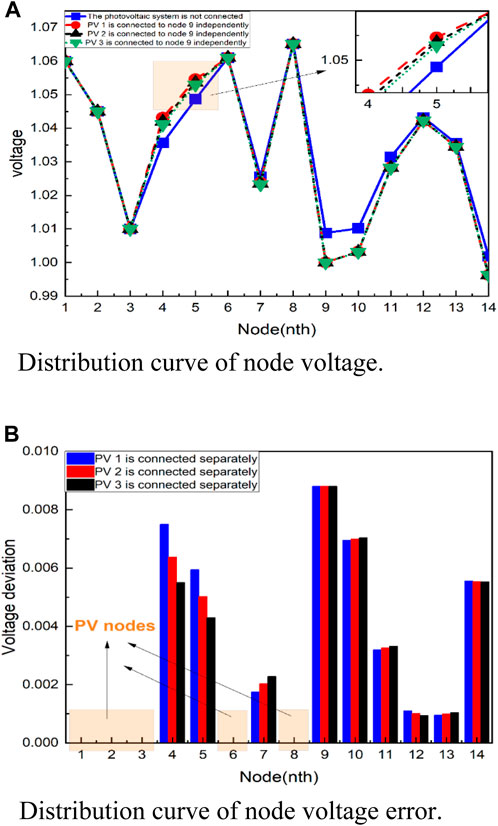
Figure 4. Voltage distribution for PV cell connected to a single node in distribution network. (A) Distribution curve of node voltage. (B) Distribution curve of node voltage error.
It can be seen that the effect on the voltage is finite because the capacity of a single PV system is not large compared with the distribution network. It can be seen that though the voltage of the grid-tied node is mainly affected, the voltage of the other nodes are also effected by a grid-tied PV system.
In this case, the three PVs are connected into the distribution network in node 4, node 7, and node 13, respectively. The voltage distribution of the nodes and the voltage deviation is shown in Figure 5.
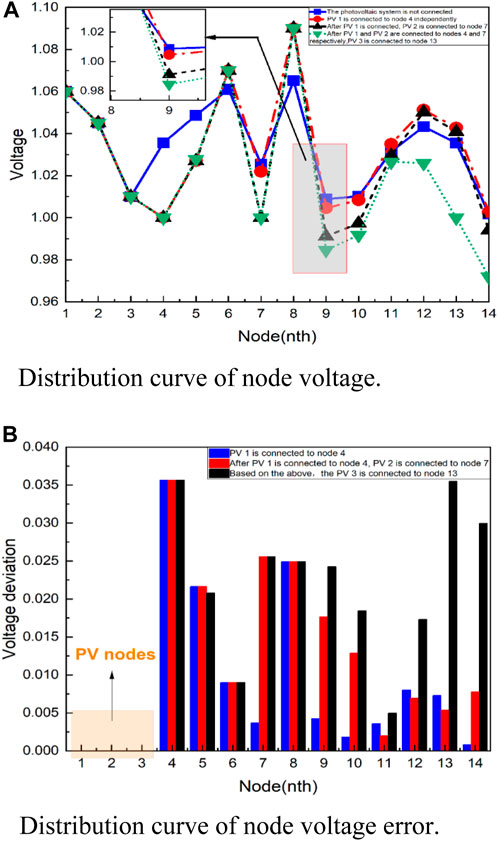
Figure 5. Voltage distribution for PV cells connected to multiple nodes in distribution network.
It can be seen that, in terms of the connection of the PV system, the power flow of system is changed, leading the voltage distribution changing. And the effect of the node voltage is increasing, especially for the nodes which are grid-tied in the PV system.
From the sensitivity analysis of the node voltage, it can be seen that the node voltage will be affected by the all grid-tied PV system; the degree of influence can be estimated by the proposed Markov global sensitivity in this paper. For example, the voltage of node five is effected by the grid-tied PV cells, though it is not a node that is connected to a PV.
In order to analyze the voltage of node 5, in the experiment, the grid-tied node of the PV cell is changed to observe the voltage change, as shown in Figure 6.
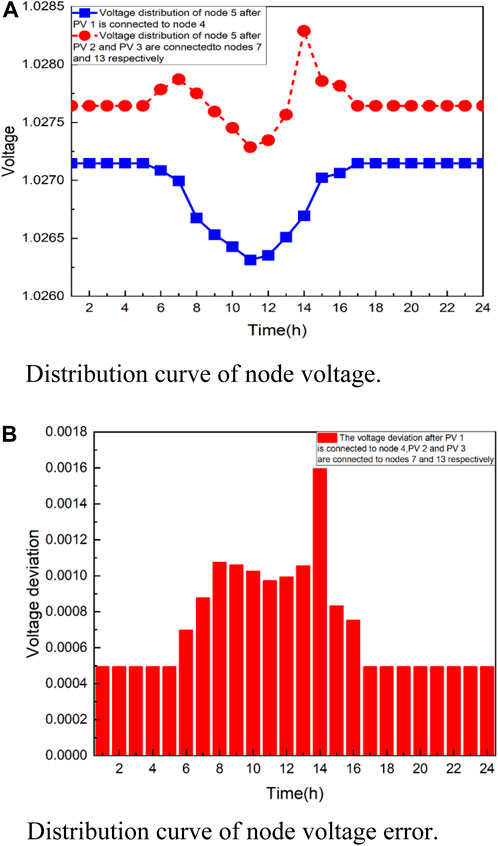
Figure 6. Voltage distribution of fifth node while PV cells are connected to multiple nodes in the distribution network.
As can be seen from the figures, the voltage distributed of node is different as the PV system are connected into the system. The changing trend of the node voltage is different, which can be described by the voltage sensitivity by using the proposed Markov global sensitivity, as shown in Figure 7 from the sensitivity analysis, it can be seen that the node voltage will effected by all the grid-tied PV cells, and the degree of influence is different.
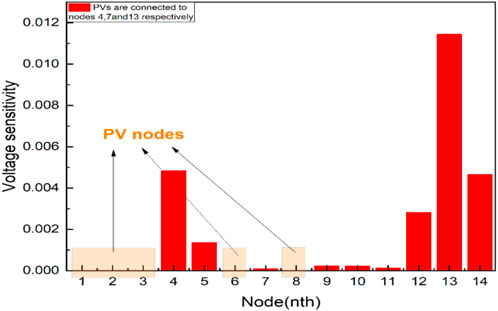
Figure 7. Voltage sensitivity analysis distribution network.
A modeling and analysis method for a distribution network with PV cells based on Markov global sensitivity is proposed in this paper. Comparing with the traditional method, the Markov chain and voltage modeling of the distribution network are combined to obtain the Markov global sensitivity function to describe the degree of the influence of the node voltage resulting from the grid-tied PV cells. The example has verified the effectiveness and plausibility of the proposed method. And the example results show that the node voltage is effected by all the grid-tied PV cells, and the degree of influence is different, due to the different grid-tied nodes. The analysis results can be used in the design and planning of distribution networks, the grid-tied node evaluation of PV cells, and the optimization control of distribution networks. The modeling method can be used to developed corresponding model for meshed network in the future work.
The raw data supporting the conclusion of this article will be made available by the authors, without undue reservation.
TH: Data curation, Investigation, Methodology, Validation, Writing–original draft, Writing–review and editing. BZ: Data curation, Formal Analysis, Software, Validation, Writing–review and editing, Writing–original draft. PL: Software, Validation, Writing–review and editing. XC: Data curation, Writing–review and editing.
The author(s) declare financial support was received for the research, authorship, and/or publication of this article. This research is funded by 2022 Innovation and Efficiency Projects: Research and Application of Low Voltage Distributed Photovoltaic Data Interaction Technology, grant number (JG29YX220038).
Authors TH and PL were employed by State Grid Ningxia Electric Power Company Marketing Service Center. Author XC was employed by Ningxia Longji Ningguang Instrument Co., Ltd.
The remaining author declares that the research was conducted in the absence of any commercial or financial relationships that could be construed as a potential conflict of interest.
All claims expressed in this article are solely those of the authors and do not necessarily represent those of their affiliated organizations, or those of the publisher, the editors and the reviewers. Any product that may be evaluated in this article, or claim that may be made by its manufacturer, is not guaranteed or endorsed by the publisher.
The Supplementary Material for this article can be found online at: https://www.frontiersin.org/articles/10.3389/fenrg.2024.1374467/full#supplementary-material
Baptista, J. E. R., Rodrigues, A. B., and da Guia da Silv, M. (2019). Probabilistic analysis of PV generation impacts on voltage sags in LV distribution networks considering failure rates dependent on feeder loading. IEEE Trans. Sustain. Energy 10 (3), 1342–1350. doi:10.1109/TSTE.2018.2866931
Chu, Zh., Sun, J., Zhao, L., and Sun, X. (2022). Optimal configuration of distributed power generation in active distribution network considering the characteristics of wind power and load time series. Electr. Power Constr. 43 (11), 53–62. (in Chinese). doi:10.12204/j.issn.1000-7229.2022.11.006
Constante-Flores, G. E., and Illindala, M. S. (2019). Data-driven probabilistic power flow analysis for a distribution system with renewable energy sources using Monte Carlo simulation. IEEE Trans. Indus. App. 55 (1), 174–181. doi:10.1109/TIA.2018.2867332
Demazy, A., Alpcan, T., and Mareels, I. (2020). A probabilistic reverse power flows scenario analysis framework. IEEE Open Access J. Power Energy 7, 524–532. doi:10.1109/OAJPE.2020.3032902
Goh, H. H., Luo, Q., Zhang, D., Liu, H., Dai, W., Lim, C. S., et al. (2023). Hybrid SDS and WPT-IBBO-DNM based model for ultra-short term photovoltaic prediction. CSEE J. Power Energy Syst. 9 (1), 66–76. doi:10.17775/CSEEJPES.2021.04560
Hong, Y.-Y., and Wu, M.-Y. (2019). Markov model-based energy storage system planning in power systems. IEEE Syst. J. 13 (4), 4313–4323. doi:10.1109/JSYST.2019.2900081
Hu, W., Hu, X., Wang, M., Zeng, S., Yang, Z., and Yi, H. (2021). Research on distributed photovoltaic multi-mode coordinated control algorithm for distribution network overvoltage suppression. Adv. Tech. Electr. Eng. Energy 40 (9), 18–28. (in Chinese). doi:10.12067/ATEEE2103033
Jafari, M. R., Parniani, M., and Ravanji, M. H. (2022). Decentralized control of OLTC and PV inverters for voltage regulation in radial distribution networks with high PV penetration. IEEE Trans. Power Del 37 (6), 4827–4837. doi:10.1109/TPWRD.2022.3160375
Li, Z., Cheng, Z., Si, J., and Xu, S. (2023). Distributed event-triggered hierarchical control of PV inverters to provide multi-time scale frequency response for AC microgrid. IEEE Trans. Power Syst. 38 (2), 1529–1542. doi:10.1109/TPWRS.2022.3177593
Liang, W., Liu, Y., and Shen, Y. (2023). Active power control integrated with reactive power compensation of battery energy stored quasi-Z source inverter PV power system operating in VSG mode. IEEE J. Emerg. Sel. Top. Power Electron 11, 339–350. doi:10.1109/JESTPE.2021.3137397
Liu, Y., Wang, Y., Wang, M., Xu, Z., Peng, Y., and Li, M. (2022). Coordinated VSG control of photovoltaic/battery system for maximum power output and grid supporting. IEEE J. Em. Sel. Top. C 12 (1), 301–309. doi:10.1109/JETCAS.2022.3143716
Meng, L., Yang, X., and Zhao, Z. (2022). An economic optimal dispatch strategy for active distribution networksconsidering photovoltaic-load uncertainty and rotating reserve constraints. Electr. Power Constr. 43 (11), 63–72. (in Chinese). doi:10.12204/j.issn.1000-7229.2022.11.007
Palahalli, H., Maffezzoni, P., and Gruosso, G. (2021). Gaussian copula methodology to model photovoltaic generation uncertainty correlation in power distribution networks. Energies 14, 2349. doi:10.3390/en14092349
Pan, Y., Chen, L., Lu, X., Wang, J., Liu, F., and Mei, S. (2019). Stability region of droop-controlled distributed generation in autonomous microgrids. IEEE Tran. Smart Grid 10 (2), 2288–2300. doi:10.1109/TSG.2018.2849084
Rayati, M., Bozorg, M., Cherkaoui, R., and Carpita, M. C. (2022). Distributionally robust chance constrained optimization for providing flexibility in an active distribution network. IEEE Trans. Smart Grid 13 (4), 2920–2934. doi:10.1109/TSG.2022.3154023
Reddy, Y., Jithendranath, J., Chakraborty, A. K., and Guerrero, J. M. (2023). Stability constrained optimal operation of standalone DC microgrids considering load and solar PV uncertainties. IEEE Trans. Power Del. 38 (4), 2673–2681. doi:10.1109/TPWRD.2023.3253623
Reshikeshan, S. S. M., Matthiesen, S. L., Illindala, M. S., Renjit, A. A., and Roychowdhury, R. (2021). Autonomous voltage regulation by distributed PV inverters with minimal inter-node interference. IEEE Trans. Indus. App. 57 (3), 2058–2066. doi:10.1109/TIA.2021.3064911
Tabone, M. D., and Callaway, D. S. (2015). Modeling variability and uncertainty of photovoltaic generation: a hidden state spatial statistical approach. IEEE Trans. Power Syst. 30 (6), 2965–2973. doi:10.1109/TPWRS.2014.2372751
Tang, C.-Y., Chen, P.-T., and Jheng, J.-H. (2021). Bidirectional power flow control and hybrid charging strategies for three-phase PV power and energy storage systems. IEEE Trans. Power Electron 36 (11), 12710–12720. doi:10.1109/TPEL.2021.3083366
Wan, J. (2022). Research on the influence of photovoltaic grid connection on voltage quality of distribution network. Shaanxi university of technology. (in Chinese).
Wang, F., Li, J., Zhao, Z., Wang, C., Ren, H., Ma, H., et al. (2022). Cloud feature extraction and fluctuation pattern recognition based ultrashort-term regional PV power forecasting. IEEE Trans. Indus. App. 58 (5), 6752–6767. doi:10.1109/TIA.2022.3186662
Wang, M., and Yang, S. (2017). New energy generation and grid-connected technology. China Electric Power Press. (in Chinese).
Widén, J., Shepero, M., and Munkhammar, J. (2017). Probabilistic load flow for power grids with high PV penetrations using copula-based modeling of spatially correlated solar irradiance. IEEE J. Photovolt. 7 (6), 1740–1745. doi:10.1109/JPHOTOV.2017.2749004
Xing, J., and Mu, L. (2023). A novel islanding detection method for distributed PV system based on μPMUs. IEEE Trans. Smart Grid 14 (5), 3696–3706. doi:10.1109/TSG.2023.3236790
Xiong, Z., Chen, T., Du, L., Dai, Z., Chen, J., and Xu, L. (2021). Optimal allocation of soft open point in active distribution network based on improved sensitivity analysis. Automation Electr. Power Syst. 45 (8), 129–137. (in Chinese). doi:10.7500/AEPS20191021004
Xuan, Z., Gao, X., Li, K., Wang, F., Ge, X., and Hou, Y. (2020). PV-load decoupling based demand response baseline load estimation approach for residential customer with distributed PV system. IEEE Trans. Indus. App. 56 (6), 6128–6137. doi:10.1109/TIA.2020.3014575
Yang, S., Li, Q., Ming, Z., Ma, Q., and Luo, Q. (2023). Multi-objective probabilistic reactive power optimization of distribution network considering the randomness of source and load. South. Power Syst. Technol. 17 (1), 125–135. (in Chinese). doi:10.13648/j.cnki.issn1674-0629.2023.01.013
Zhang, B., Ge, S., and Li, C. (2021). Markov chain wind speed prediction model based on copula function. Smart Power 49 (11), 24–30+37. (in Chinese).
Zhang, X., Zhen, Z., Sun, Y., Wang, F., Zhang, Y., Ren, H., et al. (2023). Prediction interval estimation and deterministic forecasting model using ground-based sky image. IEEE Trans. Indus. App. 59 (2), 2210–2224. doi:10.1109/TIA.2022.3218758
Keywords: distributed PV, grid connection, Markov chain, sensitivity, uncertainty
Citation: Hu T, Zhang B, Liu P and Chang X (2024) Modeling and analysis of distribution network with photovoltaic cells based on Markov global sensitivity. Front. Energy Res. 12:1374467. doi: 10.3389/fenrg.2024.1374467
Received: 22 January 2024; Accepted: 13 March 2024;
Published: 27 March 2024.
Edited by:
Liansong Xiong, Xi’an Jiaotong University, ChinaReviewed by:
Shun Sang, Nantong University, ChinaCopyright © 2024 Hu, Zhang, Liu and Chang. This is an open-access article distributed under the terms of the Creative Commons Attribution License (CC BY). The use, distribution or reproduction in other forums is permitted, provided the original author(s) and the copyright owner(s) are credited and that the original publication in this journal is cited, in accordance with accepted academic practice. No use, distribution or reproduction is permitted which does not comply with these terms.
*Correspondence: Bai Zhang, emhhbmdiYWkxOTgxMDMyMUAxNjMuY29t
Disclaimer: All claims expressed in this article are solely those of the authors and do not necessarily represent those of their affiliated organizations, or those of the publisher, the editors and the reviewers. Any product that may be evaluated in this article or claim that may be made by its manufacturer is not guaranteed or endorsed by the publisher.
Research integrity at Frontiers
Learn more about the work of our research integrity team to safeguard the quality of each article we publish.