 Y. Frischholz
 U. Schilt
 V. Sharma
 A. Kahl3
 D. Anderegg
- 1Laboratory of Cryospheric Sciences (CRYOS), School of Architecture, Civil and Environmental Engineering (ENAC), École Polytechnique Fédérale de Lausanne (EPFL), Lausanne, Switzerland
- 2Competence Centre for Thermal Energy Storage, School of Engineering and Architecture, Lucerne University of Applied Sciences, Horw, Switzerland
- 3SUNWELL SARL, Lausanne, Switzerland
- 4Institute of Natural Resource Sciences, ZHAW Zurich University of Applied Sciences, Wädenswil, Switzerland
Introduction: High Alpine regions show a great potential for solar photovoltaic electricity production in winter due to the reflective properties of snow and the larger number of sun hours compared to lower urban and peri-urban regions. In countries with a pronounced deficit in domestic electricity production such as Switzerland, utility-scale projects of Alpine-PV power plants are now flourishing. The harsh environmental conditions and the complexity of the high-Alpine topography however challenge the conventional design practices. In this context, the main question the article addresses is the representation of test-scale measurement in the performances of Alpine-PV, utility-scale power plants.
Methods: This article focuses on the comparison between long term tests and the first Alpine-PV utility-scale power plant in Switzerland.
Results: The results show that the main performance indicators such as the Alpine-to-Midlands final yield ratio or the winter fraction, do scale. However, absolute final yield values are consistently lower at the utility scale.
Discussion: The paper discusses the possible impacts of the complex Alpine topography as constraint for the design of the larger extent of utility-scale power plants as well as the influence of scale on the snow induced losses.
1 Introduction
In the temperate climate zone, angles of sun elevation in winter are low and the albedo of regions of high elevation is large due to the snow cover. In such places, the introduction of photovoltaic (PV) modules at an atypically steep tilt can improve the angle of incidence of both direct and reflected components of solar irradiation in the winter time and result in a shift of the peak of electricity production to winter (Kahl et al., 2019). In the case of Switzerland, this shift can be supported by an additional and important effect: high alpine regions have a larger amount of sun hours because of the high number of foggy and low stratus days, typical of the meteorology of autumn and winter in the Swiss midlands located below 1000 m amsl. (Scherrer and Appenzeller, 2014).
When compared to the typical PV systems of the country, mostly installed on households and industrial buildings in the midlands (Hugi et al., 2023), the annual potential production of Alpine-PV should show no deficit but much higher winter production (Kahl et al., 2019). On the other hand, optimizing PV-systems in the midlands for winter with steeper tilts would reduce the annual production (Ratnaweera et al., 2023). The reflective properties of snow play a significant role in this contrasting behaviour (von Rutte et al., 2021). Increased winter production is attractive for countries such as Switzerland, which have a pronounced production deficit in winter (Bartlett et al., 2018). However, the theoretical gain of high-elevation installations needs to be realized during actual operations in harsh environments and to be weighted against additional cost.
Haeberlin (2004) published the results of 10 years of operations of a test site at the Jungfraujoch (3454 m a.m.s.l.), Switzerland. The plant was made of monofacial modules vertically attached to the facade of a building oriented South-West (192°N-207°N). Between 1994 and 2003, a capacity factor (CF) of ca. 16%, a mean annual final yield of 1,398 kWh/kWp and a mean winter share of 642 kWh/kWp (46.2%) were measured. These numbers from the very first high Alpine-PV power plant contrast with the average yield of all Swiss PV systems estimated at 954 ± 36 kWh/kWp (Hostettler, 2022) between 2013 and 2022. Later, Egger et al. (2019) reported 2 years of measurement of a utility scale (1 MWp) installation located at around 3000 m amsl. near the Pitztaler Gletscher, Austria. From 2016 to 2017, a mean final yield of 1,400 kWh/kWp and a mean winter fraction of 43% were observed. Compared to a system in the nearby valley (Inzig (625 m amsl.), Austria), an average annual gain of 25% was measured.
In this article, early results from the first utility-scale, Alpine-PV power plant in Switzerland are reported and compared to a reference test site. The aim is to confirm the reported performances from a modern test-scale experiment on a utility-scale site. A joint analysis of test- and utility-scale Alpine-PV power plants did not exist in the literature before. It is the main novelty of this study. In particular, the Alpine power plant of the Muttsee is compared to a reference test site located in a similar Alpine environment, near the urban area of Davos, Switzerland, as reported in Anderegg et al. (2023). For winter comparison, a PV power plant of the Swiss midlands representative of the national PV portfolio is chosen. The primary data and comprehensive metadata are openly available on Envidat.ch at hourly resolution.
Section 2 describes the sites chosen for the analysis and contextualizes this choice in the current photovoltaic landscape of Switzerland. Section 2.2 introduces the data sets. Section 2.3 presents the comparison methods and metrics and provides some background. Finally, the comparison results are presented and discussed in Section 3 and Section 4 respectively.
2 Methodology
2.1 Selected sites
In this study, two PV systems located in high Alpine environments at approximately 2500 m amsl. are analysed. The first one is a test site near the urban area of Davos, referred to as “A1”. The second is a utility-scale power plant, the first of its kind in Switzerland, on the reservoir wall of Muttsee, referred to as “A2”.
A1 was installed at the end of 2017. It is oriented South and features six segments of three to four modules. Four are monofacial only and two are bifacial, ranging between 0.84 kWp and 1.12 kWp. While their orientation is the same, their tilts differ and were modified several times over the 5-year measurement period, between 2018 and 2022. The tilt was however always kept the same for two pairs of mono- and bifacial segments in order to measure the bifacial gains and to keep a reference. For the two monofacial segments left, the tilt was set independently. Some segments are equipped with framed panels and others are frame-less. This factor impacts the snow shedding rate (Riley et al., 2019), but is not considered in the present study, as losses attributable to snow presence on the panel are not analysed. The lower end of the segments are at approximately 4 m above ground and remains more than 2 m above the snow surface for all setups during winter.
At A2 the panels are attached to a reservoir dam, which constraints the orientation of the bifacial modules and results in multiple azimuth-tilt combinations comprised between South-East and South-West. Note that panels are installed close to the dam wall on a carrying structure. This installation does not allow for significant radiation input on the panel backside. The installed power is rated at 2.184 MWp and was fully commissioned in September 2022. The minimum vertical distance to the ground from the lowest panels is approximately 4 m.
For the comparison of winter electricity production, a third and last site is selected in the midlands to coincide with the region in which a higher number of foggy and low stratus days occur in the winter time (Scherrer and Appenzeller, 2014). It is referred to as “M1”. In fact, this last site is also representative of the entire Swiss PV portfolio which reached a total installed capacity of approximately 4GWp in 2022, mostly distributed over the midlands (Figure 1). As a consequence, the median elevation of the Swiss PV installed capacity is 503 m amsl. (Figure 2A). M1 is located at 450 m amsl. near the town of Payerne. It is a free-standing power plant of 6.033 MWp and was commissioned in 2015. It is made of monofacial modules, oriented South-West, which is also typical of the Swiss PV portfolio (Figure 2B).
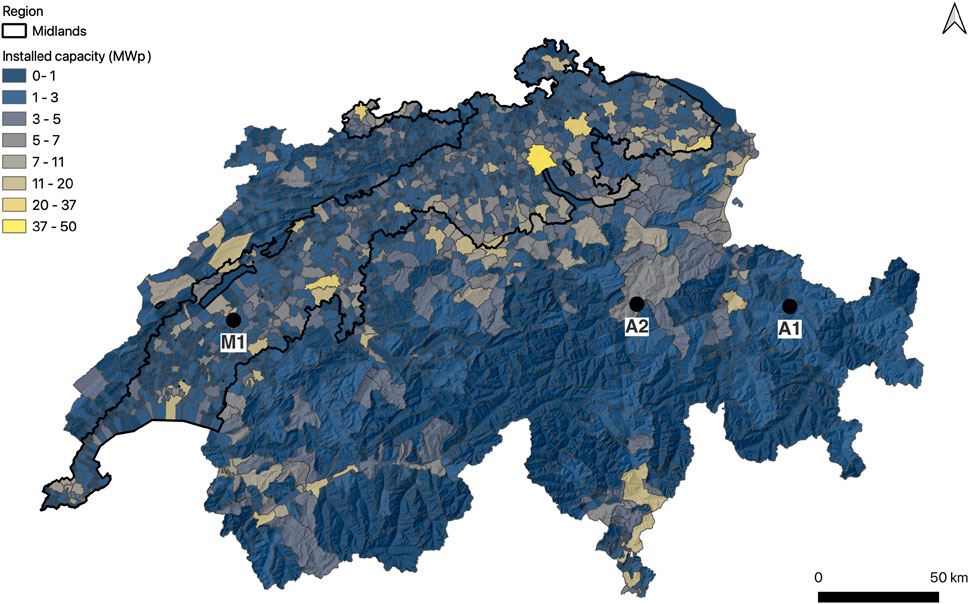
Figure 1. Map of the distribution of the Swiss PV portfolio at the community level and location of the selected sites. The region of the midlands is outlined in black. The two other regions, the Alps and the Jura, are located South and North of the midlands respectively. In this configuration, the midlands groups 61% of the total installed PV capacity (4.537 GWp), while the Alps and the Jura contain 32% and 7% respectively. The map is based on the Swiss registry of PV power plants that must provide a guarantee of origin due to their size (
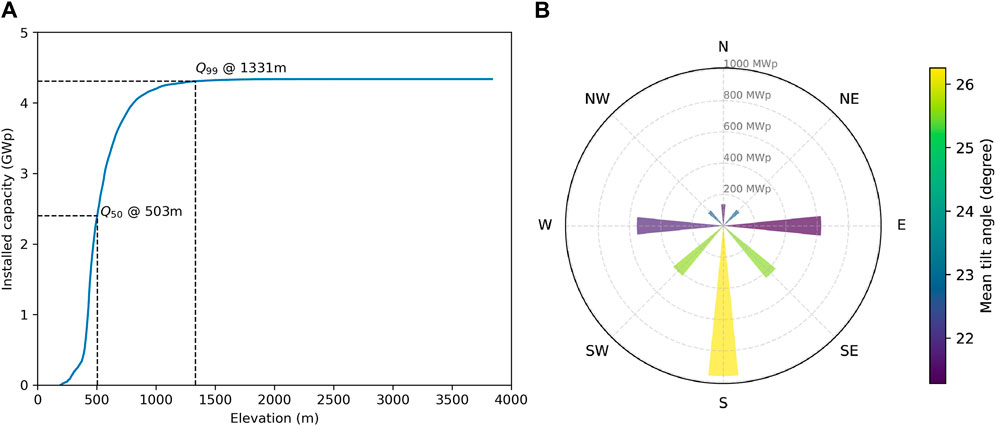
Figure 2. Installed PV capacity in Switzerland accumulated on increasing elevation (A) and orientation and mean tilt angle of installed solar PV systems in Switzerland (B). Both analyses are based on a subset of the original data set for which precise coordinates (≈93%) and orientation information (≈76%) are available.
The 3 sites are illustrated in Figure 3. Tables 1 and 2 gather the relevant system parameters for each site, the corresponding time period of measurement, as well as the specifications of the installed modules.
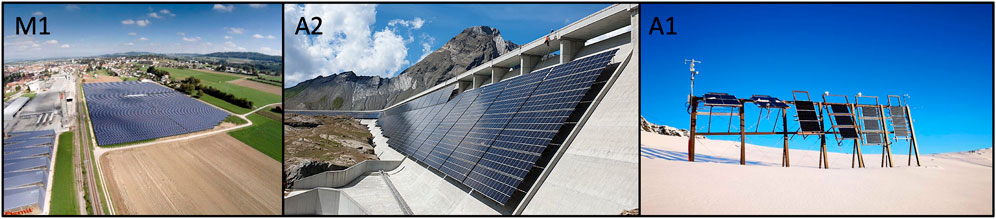
Figure 3. Pictures of the analysed sites. M1 is located between agricultural land and an industrial zone in the midlands. A2 is attached to a dam located in a high alpine region. A1 is located in a similar alpine environment as A2. It is a test site which implies a much smaller scale. (Photos: M1: Ureta, A2: AXPO, A1: Anderegg).
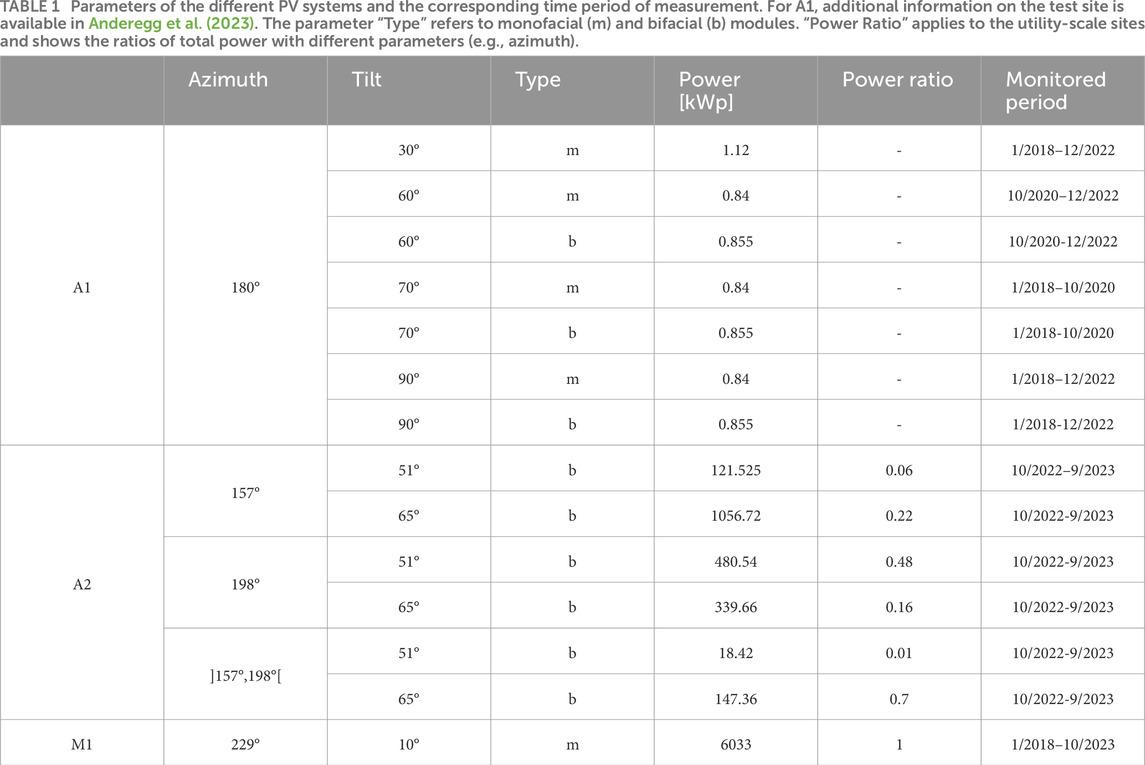
Table 1. Parameters of the different PV systems and the corresponding time period of measurement. For A1, additional information on the test site is available in Anderegg et al. (2023). The parameter “Type” refers to monofacial (m) and bifacial (b) modules. “Power Ratio” applies to the utility-scale sites and shows the ratios of total power with different parameters (e.g., azimuth).
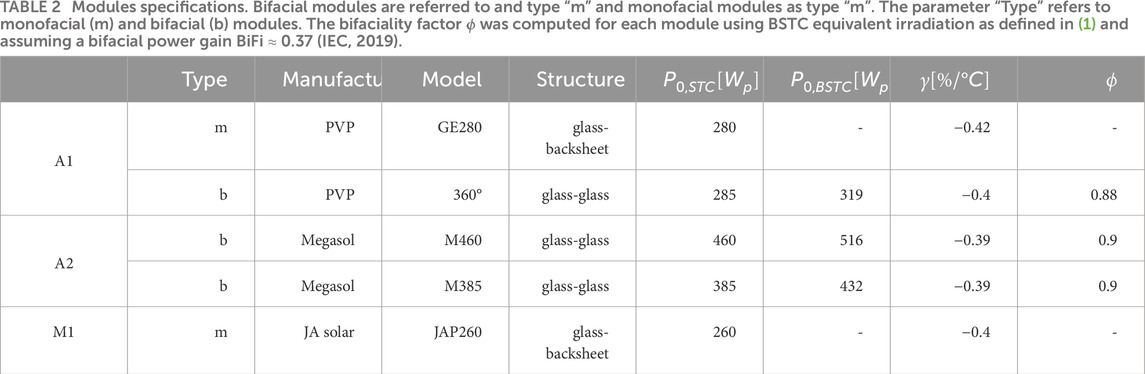
Table 2. Modules specifications. Bifacial modules are referred to and type “m” and monofacial modules as type “m”. The parameter “Type” refers to monofacial (m) and bifacial (b) modules. The bifaciality factor ϕ was computed for each module using BSTC equivalent irradiation as defined in (1) and assuming a bifacial power gain BiFi ≈ 0.37 (IEC, 2019).
2.2 Data sets
Both of the Alpine sites have DC-power measurements available at the inverter input level (PDC,inv). A2 also features DC-power measurements at the array level (PDC,arr). AC-power measurements (PAC) are available for all three sites. At A1, PAC is corrected for the wiring losses that range between 10% and 15%, and are due to a low DC-voltage and long DC-wiring typical of the test site. The same is applied at A2 for consistency.
At A2, standard cells provide front and rear plane-of-array (POA) irradiation measurements (GPOA), with an accuracy of
At A1, GPOA is measured by pyranometers (σ = 1%). Errors in the measurement of GPOA caused by snow coverage are common in snowy environments and are expected to be stronger for flat standard cells than for dome-shaped pyranometers (Øgaard et al., 2022). In the case of the standard cells at A2, no credible replacement measurement was available, so no modification in the data set is made. While this could have a strong impact on the computation of snow losses, the bias is smaller for the analysis of time aggregated performance indicators because the sensors were not permanently covered or buried in snow during the analysed period. This is especially the case here as all measurements are aggregated monthly at least. The module temperature measured on the rear side of the panel (Trear, σ = ±1K) is also available for both A-sites and is used to derive the cell temperature. At A2, irradiation and temperature measurements are taken with 4 pairs of sensors placed on the corresponding main azimuth-tilt combinations of the power plant. A weighted average, taking the installed power ratios (Table 1) as weights, is used to obtain a single value for the whole plant. At M1, neither temperature nor radiation measurements are available. Table 3 provides an overview of all the monitored variables.

Table 3. Overview of the monitoring variables available for each site.
2.2.1 Pre-processing
Due to their high resolution, data sets of the A-sites required multiple pre-processing steps to deal with missing data points and outliers mainly. Small gaps (
2.2.2 Time aggregation
Measurements are aggregated to monthly, seasonal and annual time resolutions. The adopted definition of the seasons is taken from the Swiss Energy Act (Energiegesetz, 2016) which splits the year in two semesters: summer from April 1 to September 30 and winter from October 1 to March 31. This choice is made to provide results that directly fit the legal framework of the analysed power plants. Only complete monitored seasons (i.e. 6 months long) are kept for the analysis. Note that monthly aggregates of additive variables are affected by the differences in day counts across months. For the purpose of the present analysis, normalisation was however not necessary. Further details on the data sets and their pre-processing are provided on the Envidat repository (Section 5).
2.3 Performance metrics
In order to compare different power plants, measurements are normalised by the reference values of standard testing conditions. In particular, the measured plane-of-array (POA) irradiation
While the Standard Testing Conditions (STC) are well established for monofacial modules (G0,POA =
where ϕ is the module’s bifacial ratio which measures the production efficiency of the panel’s rear side relative to its front side.
In this article, if not otherwise stated, STC reference values are used in order to keep the consistency, for instance, in the comparison between the sites of the midlands and of the Alps.
2.3.1 Energy yield
The conditions of plane-of-array irradiation are evaluated using the reference yield, Yr, which is the equivalent number of hours of test-condition irradiation (GPOA = G0,POA):
where HPOA [W/m2] is the time integrated irradiation in the plane-of-array. The final yield that normalises the available energy produced EAC is then:
Yf is the equivalent number of hours during which the PV system produced at the rated power P0.
2.3.2 Performance ratio
The performance ratio (PR) corresponds to the fraction the actual produced energy represents with respect to the energy an ideal PV cell would produce in the actual irradiation conditions. It is a popular ratio at the plant level as it aggregates in a single number all losses occurring between the available radiative resources (Yr) and the actual produced power (Yf). This includes losses due to wiring, temperature, mismatch, clipping, etc. The norm IEC 61724-1 defines PR for bifacial modules (IEC, 2021):
In the case of monofacial modules,
2.3.3 Capture thermal loss
To account for temperature conditions, Yr can be corrected for cell temperatures deviating from STC (Kratochvil et al., 2004):
where, γ is the tabulated power related temperature coefficient provided in %/°C, Tcell is the cell temperature and is derived from the backsheet module temperature using the Sandia model for an open-rack and glass-cell-glass module type (Kratochvil et al., 2004).
The capture thermal losses (LcT) can then be computed:
2.3.4 Bifacial gain
Bifacial modules are well adapted to high albedo environments (e.g., Gu et al., 2020; Ganesan et al., 2023). Reported system bifacial gains in such environments range from 20% to 30% (e.g., Wang et al., 2020; Hayibo et al., 2022). Optical and system bifacial gains are defined as follows:
The computation of BGsys requires concurrent mono- and bifacial measurements which is only available at A1.
3 Results
The analysis starts with the results at A1 to build a reference of expected performances for Alpine-PV. Then, the focus is on A2, and the corresponding available results are shown and compared to A1.
To simplify references to the different module setups, the following notation is applied in the entire analysis: bifacial is referred to as “b” and monofacial as “m”. The corresponding tilt is directly attached to the module type, such that a bifacial module tilted at 70° located at A1 is referred to as “A1-b70”.
3.1 Test site (A1)
3.1.1 Final yield
The primary interest is the comparison in seasonal production between Alpine-PV and PV installed in the midlands. Figure 4 shows the average and standard deviation of the annual final yields (Yf) measured between 2018 and 2022 at A1 and M1. The best performing module is A1-b60 with mean values of annual and winter yield reaching 1853 kWh/kWp and 889 kWh/kWp respectively. The best performing monofacial module is A1-m60 with mean values of 1547 kWh/kWp and 743 kWh/kWp respectively. Yf,M1 reached 1090 kWh/kWp and is coherent with the typical annual production of Swiss PV systems (Hostettler, 2022). The minimum and maximum annual ratios between regions (Yf,A/Yf,M, Table 4) are 1.21 and 1.70 for A1-m90 and A1-b60 respectively. In winter, this ratio strongly increases up to 3.14 for A1-b60. In summer, performances at M1 increase and the same inter-region ratios decrease to 1.19 and 0.74.
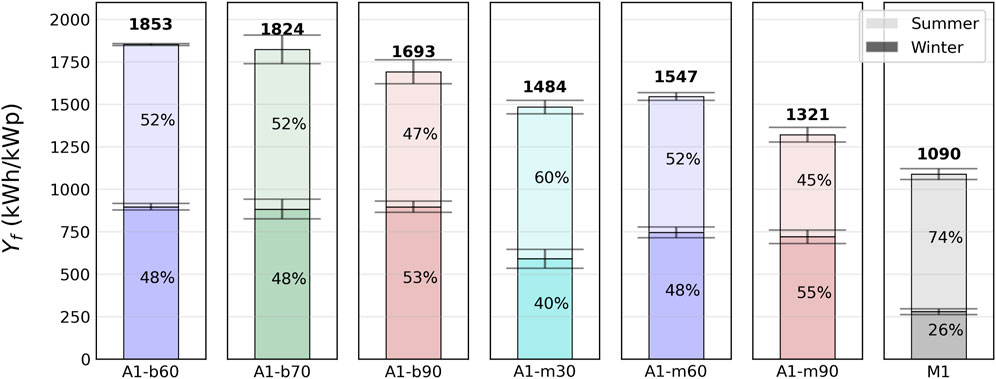
Figure 4. Mean annual and seasonal final yield at A1. Error bars represent the standard deviation. The annual yield is given in bold on top of the bar and the respective contributions of winter and summer season are given within the bar segments.
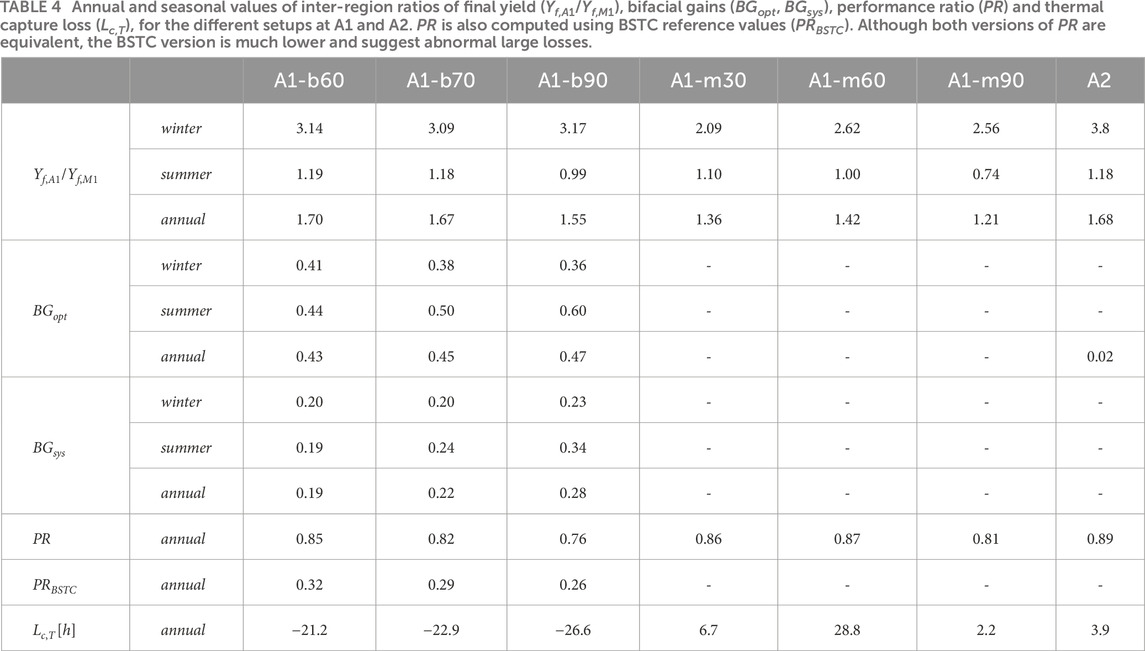
Table 4. Annual and seasonal values of inter-region ratios of final yield (Yf,A1/Yf,M1), bifacial gains (BGopt, BGsys), performance ratio (PR) and thermal capture loss (Lc,T), for the different setups at A1 and A2. PR is also computed using BSTC reference values (PRBSTC). Although both versions of PR are equivalent, the BSTC version is much lower and suggest abnormal large losses.
The winter energy fractions are all close to 50% except for A1-m30 (40%). The maximum is reached by A1-m90 with 55%. It is much lower at M1 with only 26% (165 kWh/kWp).
Overall, regardless of their type and tilt, all alpine setups have performed better both in terms of annual yield and winter fraction.
Comparing now the different setups at A1, bifacial modules show higher final yields than their monofacial counterparts. The system bifacial ratios (BGsys) are 0.19 and 0.28 for tilts of 60° and 90° respectively. Such higher yields are expected for bifacial modules with respect to monofacial ones, especially in high-albedo (
Figure 5 shows the mean monthly yields. It allows the identification of intra-seasonal patterns between winter (larger tilt angles) and summer (smaller tilt angles) optimized configurations, as well as between bifacial and monofacial modules.
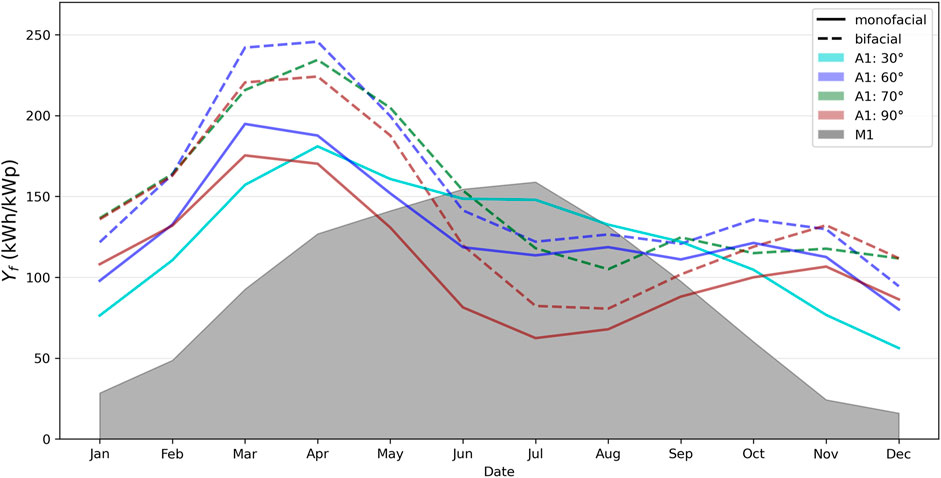
Figure 5. Mean monthly final yields at A1 and M1. The shift in peak of production is clear between Alpine-PV at A1 (curves) and the power plant in the midlands (background gray surface). The summer optimised setup at A1 (A1-m30) shows a final yield profile with much more benefit in winter than deficit in summer compared to M1, which indicates greater solar resources available for Alpine-PV.
The peak of production happens in March for winter optimized monofacial configurations and in April for the bifacial counterparts. Bifacial modules performances are well above the monofacial ones from November to June. This period corresponds to the presence of snow cover on the terrain at this elevation. This confirms the additional gain of bifacial modules in high-albedo environments.
The advantage of Alpine setups optimised for low sun elevation angles and a high-albedo environment, remains until May included. This explains the balance between the winter and summer fractions observed before (Figure 4). From June to August, both monofacial and bifacial configurations show a deficit with respect to M1.
The summer optimised setup at A1 (A1-m30) shows a flatter curve. The relative lower winter yields is compensated by higher ones in summer and leads to an annual yield that remains well above M1.
3.1.2 Bifacial gains
It has already been observed that bifacial modules showed significantly higher final yields than their monofacial counterpart. Using pairs of monofacial and bifacial modules with the same geometrical setup, the bifacial gains are evaluated. In the following, two assumptions are made: (i) The front side of the monofacial and bifacial modules pairs are considered identical. (ii) The irradiation point measurements are translated to the entire surface of the module, although partial shading due to structural elements and anisotropical reflections may modify the real irradiation of the modules on both sides.
Figure 6 presents the seasonal front-rear splits of reference yields (2) and final yields (3), for the three available pairs of monofacial and bifacial modules. The corresponding bifacial yields are provided in Table 4. Annually, the system bifacial gains range from 0.19 to 0.28 for A1-b60 and A1-b90 respectively. The annual optical gains are more than doubled, ranging from 0.43 to 0.47 for the same modules.
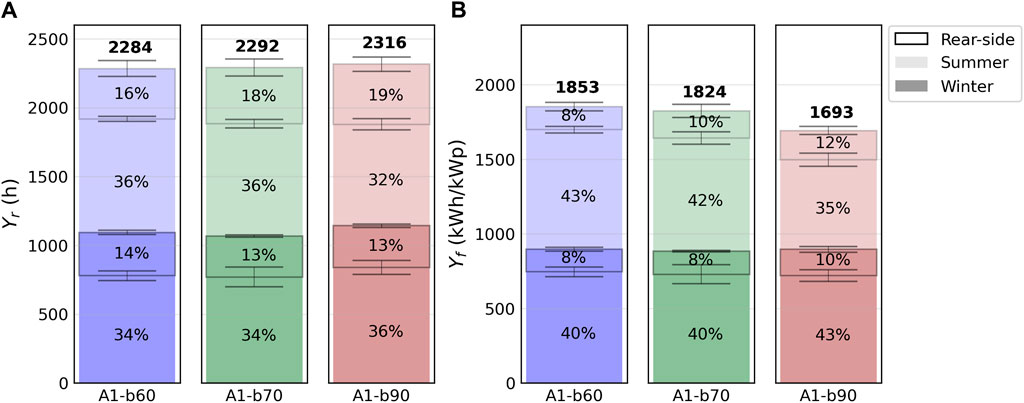
Figure 6. Mean annual and seasonal reference (A) and final (B) yields split into front and rear sides at A1. The annual relative percentage by side is given in each segment. Rounding may cause a 1% error. Note that the reference yield computed using STC reference values is equivalent to HPOA expressed in kWH/m2.
Annual reference yields (Figure 6A) are similar for all setups around 2300 h. The rear-side summer splits increase with tilt from 16% (A1-b60) to 19% (A1-b90). In winter the same splits all decrease to 13%–14%. Annually, approx. 30% of the total irradiation comes from the rear-side for all setups. The corresponding final yield splits (Figure 7B) show how much of the reference yields actually get converted into useable electricity. The ratio of the two yields is the performance ratio and is detailed further below.
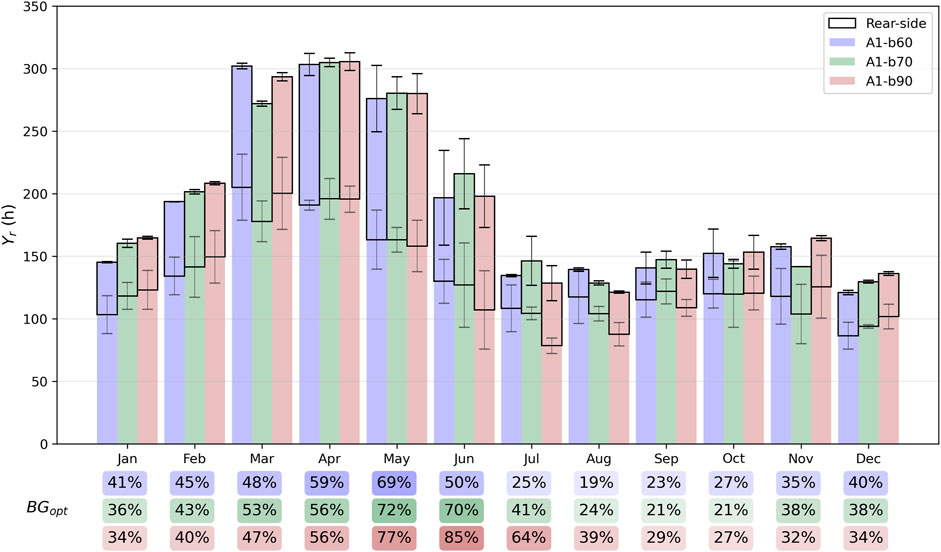
Figure 7. Mean monthly reference yield split into front and rear sides at A1. The corresponding optical final yield is shown by the solid lines.
It is here legitimate to question the difference in the final yields: although all setups have similar reference yields, the final yield significantly drops for A1-b90, in the summer. Low incident angles have a strong impact on PV modules efficiency (King et al., 2015) as compared to the pyranometers and may be the primary cause for this difference, in a season of high sun elevation angles. Rear-side splits show a stronger relative drop compared to the front-side. The losses on the rear-side are thus higher than for the front-side. For instance, the bifacial ratio was not accounted for in the computation of Yr and is thus one component of the apparent losses that apply. Its correction is rather simple and will be applied on the performance ratio below. In addition, it is expected that rear-sides of bifacial modules show a higher mismatch especially in snowy environments that lead to a stronger anisotropy of the reflected irradiation (Wang et al., 2020).
3.1.3 Performance ratio and thermal capture losses
The mean annual performance ratios are between 77% and 90%. Higher values (
In order to isolate losses, PR can be further corrected for temperature. In this article however, it is computed indirectly through the capture thermal losses Lc,T, also reported in Table 4. Mean annual gains of 1%–2% due to temperature are observed for bifacial modules. Monofacial modules show smaller gain and even a 1% loss for A1-m70. Note here that the point measurement provided by the temperature sensors (Tbs) is taken as the mean value for the whole module. In addition to the bias of the model used to derive Tcell (Kratochvil et al., 2004), the uncertainty sources in the computation of Lc,T are numerous. The obtained results however show some coherence with Haeberlin (2004) (1.5%).
3.2 Utility-scale power plant (A2)
Monthly and annual final yields of the first year of operation at A2 are shown in Figure 9. The comparison to M1 is made with concurrent measurements of this first year only. The results of a similarly tilted panel from A1, presented in Figure 5, are reported as reference. Conditions of irradiation during this particular year were close to the respective typical irradiation conditions, as shown in Figure 8 by the Typical Meteorological Year (TMY) in comparison to the measurements of the actual time period.
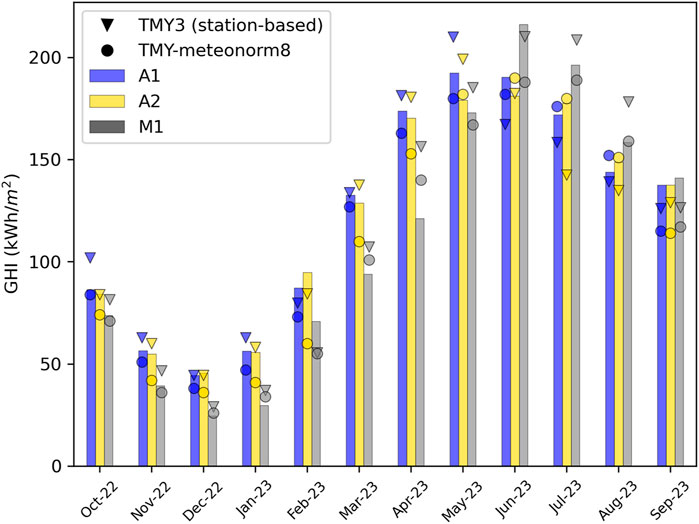
Figure 8. Typical Meteorological Year (TMY) and measurements of Global Horizontal Irradiation (GHI) for the A2 site. The TMY is presented in two versions for more robustness: (i) TMY3 (Wilcox and Marion, 2008), using 14 years (2008–2021) of measurement at nearby automatic meteorological stations and (ii) TMY-meteonorm8 (Remund et al., 2020) Accumulated over the measurement year, GHI at A1, A2, and M1 respectively reached 1473 kWh/m2, 1458 kWh/m2 and 1338 kWh/m2. This is equivalent to 100%, 101% and 94% of their respective TMY3 and 106%, 101%, 104% of their respective TMY-meteonorm8.
The annual final yield at A2 reaches 1434 kWh/kWp (CF ≈ 16%). This is 168% of the concurrent yield at M1. In the winter this percentage increases to 380%. The winter fraction of 0.43 (616 kWh/kWp) is 2.3 times larger than at M1. Because A2 is attached to a dam, the bifacial gains are low (annual BGopt,A2 = 1.5%). The annual performance ratio reaches 0.89 and the thermal capture losses 0.3% (Table 4).
In comparison to the test site at A1, monthly final yields mostly reach the lower end of A1-m60’s distribution. Clear exceptions are the months of March and April, during which the final yield at A2 is far below the lowest observations at A1. Over the summer, yields are similar to both A1-m60 and A1-b60, emphasizing the important role of snow.
Looking at the annual yield ratio to M1 given in percentages below the chart in Figure 9, both sites show similar results, approx. 1.7 (Table 4). However, the winter ratio is higher at A2 (3.8 vs 3.12), which can be explained by the strong deficit compared to the 5-year average (black error bars in Figure 9) of this particular year over the months of January to May.
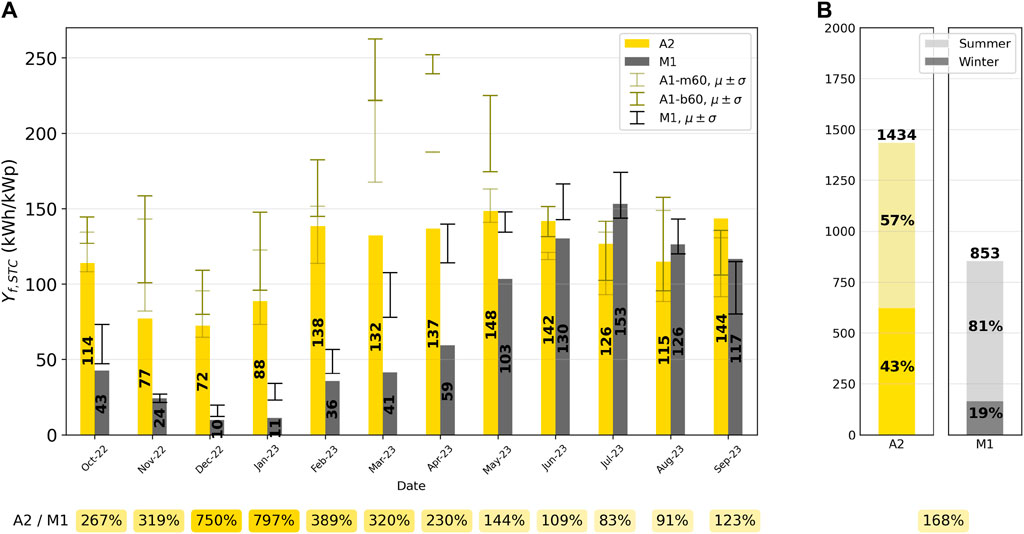
Figure 9. (A) Monthly and (B) seasonal and annual final yields at A2 and M1. Error bars show the standard deviation (σ) around the mean (μ) at A1 for A1-m60 and A1-b60 and M1 for the period 2018–2022. The ratio between A2 and M1 is given in percentages below the plots.
4 Discussion
As seen for A1, long term test site measurements, as well as numerical simulations, have established two main expectations for Alpine-PV, in contrast to the conventional sites located near urban centers at lower elevation: an annual electricity generation that is almost doubled in the best configurations, coupled to a much higher winter fraction of approximately 50% that mainly depends on the tilt angle.
In this inter-regional comparison, the expected annual and seasonal final yield ratios were met at the utility-scale at A2, close to the best observed at A1 (Table 4). However, for a similar tilt the annual energy yield was 8% (monofacial) to 30% (bifacial) lower at A2 than at A1. Related, the winter fraction showed a deficit of at least 5%. At the monthly resolution, yields were indeed relatively lower at the utility-scale plant during the high-albedo time period, mostly occurring over winter, than during the summer months.
Utility-scale power plants imply a large extent. The layout and system parameters are constrained by the terrain, potentially resulting in sub-optimal configurations in various regions of the plant. This limitation is amplified in the complex topography of the Alps, which A2 is a typical example of, although building-integrated. It has various sub-optimal azimuth and tilt configurations (Table 1) and surrounding steep slopes shadow a large part of the power plants at specific times. Topography thus stands out as a key parameter, simultaneously impacting the available solar resources and the system generation efficiency. Due to their defining smaller extent, test sites only partially capture these effects.
Although not analysed in the present work, snow is known to induce significant electricity production losses even for steep tilt configurations of PV systems placed in snowy environments (e.g., Townsend and Powers, 2011; Marion et al., 2013). Shedding snow causes an excess of snow accumulation on the ground at the bottom of the PV modules, which depending on the minimal height above ground of the structure, may lead to persistent burial. The total surface of the modules plays an evident role in the amount of snow available for shedding. In the present case, the specific layout of the power plants A2 offers a much larger amount of shedding snow than the test site A1. While some modules from the bottom rows at A2 got buried over this first winter, it never occurred at A1, although the minimal height above ground of both system are similar. Losses due to the partial persistent burial of some modules at A2 were conservatively estimated at 1% of the annual yield. Alone, however, it does not explain the observed deviation in final yields during high-albedo months (Figure 9). Whether losses induced by snow cover on the module also depend on the scale of the module or the group of modules involved is less intuitive and remains unclear.
5 Conclusion
Interested in PV electricity generation characteristics across system scale in the Alpine environment, this work reported on 5 years of measurements at a PV test site and compared it to the first year results of a utility-scale power plants, both located in a similar high-Alpine environment. The main characteristics of Alpine-PV observed at the test-scale, including an Alpine-to-Midlands annual ratio of approximately 1.5 and a winter fraction close to 50%, were also observed at the utility scale. Other key performance indicators such as the performance ratio and the capture thermal losses also matched annual and seasonal values. Observation from the bifacial modules at the test site confirmed their well known advantage in snowy environments as they produced, on average, between 16% and 22% more electricity than their monofacial counterparts, for respective tilts of 60° and 90°.
In comparison to the only other Alpine-PV utility-scale power plants (Table 5), the annual yield of 1434 kWh/kWp measured at A2 is very close to the 1400 kWh/kWp reported from the Pitztaler Gletscher, confirming a capacity factor of approximately 16%. However, compared to the test site A1, final yield statistics were lower at all time aggregations for comparable configurations. In the complex topography of the Alps, utility-scale power plants, due to their extent, have stronger design constraints which lead to sub-optimal configurations. The scale difference between test and utility power plants placed in the Alpine environment may thus impact both the available resources, through partial shadowing of surrounding steep slopes and the generation efficiency, through sub-optimal orientation of the modules. Together with snow soiling and persistent burial, these scale effects may explain the deviations in absolute final yields observed.
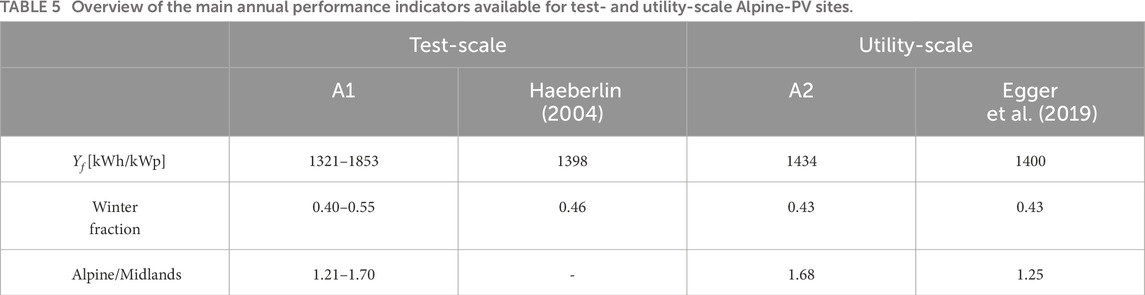
Table 5. Overview of the main annual performance indicators available for test- and utility-scale Alpine-PV sites.
Finally, the main limitation of this study is the building integrated design of A2. Because adapted built infrastructure is scarce in the high-Alpine environment, future standard Alpine-PV power plants are expected to be of free-standing type with a multi-row layout. The inter-row distance then becomes a key parameter, as it directly controls the shadowing of the modules of neighboring rows. Due to the lower sun elevation angles in winter, a free-standing, multi-row version of A2 may show not only a lower annual final yield, but also a smaller winter fraction, adding on previously mentioned negative scale effects for Alpine-PV power plants.
Data availability statement
The datasets presented in this study can be found in online repositories. The names of the repository/repositories and accession number(s) can be found below: DOI: 10.16904/envidat.469.
Author contributions
YF: Conceptualization, Data curation, Formal Analysis, Investigation, Methodology, Resources, Software, Validation, Visualization, Writing -original draft, Writing -review and editing. US: Data curation, Formal Analysis, Investigation, Methodology, Writing -original draft, Writing -review and editing. VS: Conceptualization, Funding acquisition, Project administration, Supervision, Writing -review and editing. AK: Conceptualization, Funding acquisition, Project administration, Supervision, Writing -review and editing. SS: Data curation, Methodology, Writing -review and editing. DA: Data curation, Methodology, Writing -review and editing. JR: Data curation, Methodology, Writing -review and editing. ML: Conceptualization, Funding acquisition, Project administration, Supervision, Writing -review and editing.
Funding
The author(s) declare financial support was received for the research, authorship, and/or publication of this article. The research presented in this article was supported by InnoSuisse (Grant: 47985.1) and by the Swiss Federal Office of Energy as part of the SWEET consortium EDGE. Open access funding by Swiss Federal Institute of Technology in Lausanne (EPFL). The authors bear sole responsibility for the conclusions and the results presented in this publication.
Acknowledgments
The authors acknowledge the data providers and thank them for the cooperation and the willingness to publish their data. Pronovo provided data used for Figures 1, 2. EKZ provided data for A1. AXPO and IWB Industrielle Werke Basel provided data for A2. Group-e provided data for M1.
Conflict of interest
Authors VS and AK were employed by SUNWELL SARL.
The remaining authors declare that the research was conducted in the absence of any commercial or financial relationships that could be construed as a potential conflict of interest.
Publisher’s note
All claims expressed in this article are solely those of the authors and do not necessarily represent those of their affiliated organizations, or those of the publisher, the editors and the reviewers. Any product that may be evaluated in this article, or claim that may be made by its manufacturer, is not guaranteed or endorsed by the publisher.
References
Anderegg, D., Strebel, S., and Rohrer, J. (2023). Alpine Photovoltaik Versuchsanlage Davos Totalp: Erkenntnisse aus 5 Jahren Betrieb. doi:10.21256/zhaw-2524
Bartlett, S., Dujardin, J., Kahl, A., Kruyt, B., Manso, P., and Lehning, M. (2018). Charting the course: a possible route to a fully renewable Swiss power system. Energy 163, 942–955. doi:10.1016/j.energy.2018.08.018
Burnham, L., Riley, D., Walker, B., and Pearce, J. M. (2019). “Performance of bifacial photovoltaic modules on a dual-Axis tracker in a high-latitude, high-albedo environment,” in 2019 IEEE 46th Photovoltaic Specialists Conference (PVSC), USA, 16-21 June 2019, (IEEE), 1320–1327.
Energiegesetz (2016) SR 730.0 - energiegesetz vom 30. https://www.fedlex.admin.ch/eli/oc/2017/762/de (accessed November 1, 2023).
fur Energie BFE, B. (2020). Leitfaden Stromkennzeichnung - Vollzugshilfe für Energieversorgungsunternehmen zu den Bestimmungen über die Kennzeichnung von Elektrizität gemäss EnG Artikel 9. Tech. Rep.
Ganesan, K., Winston, D. P., Sugumar, S., and Jegan, S. (2023). Performance analysis of n-type PERT bifacial solar PV module under diverse albedo conditions. Sol. Energy 252, 81–90. doi:10.1016/j.solener.2023.01.020
Gu, W., Ma, T., Ahmed, S., Zhang, Y., and Peng, J. (2020). A comprehensive review and outlook of bifacial photovoltaic (bPV) technology. Energy Convers. Manag. 223, 113283. doi:10.1016/j.enconman.2020.113283
Haeberlin, H. (2004) Grid connected PV plant Jungfraujoch (3454m) in the Swiss Alps: 10 Years of trouble-free operation with record energy yields.
Hayibo, K. S., Petsiuk, A., Mayville, P., Brown, L., and Pearce, J. (2022). Monofacial vs bifacial solar photovoltaic systems in snowy environments. SSRN Electron. J. doi:10.2139/ssrn.4056922
Herrmann, D. W., Schweiger, M., and Bonilla, J. (2017) Performance characteristics of bifacial PV modules and power labeling. In the 4th Bifi PV Workshop. Germany: Konstanz.
Hostettler, T. (2022) Statistik Sonnenenergie 2022. Tech. rep., Bundesamt für Energie. Bern, Switzerland: BFE.
Hügi, M., Wyrsch, N., Bucher, C., Hess, D., and Ballif, C. (2023). Potential for Pv Installations in Switzerland. preprint. SSRN. doi:10.2139/ssrn.4489415
IEC (2019). Photovoltaic devices - Part 1-2: measurement of current-voltage characteristics of bifacial photovoltaic (PV) devices (IEC TS 60904-1-2:2019). Tech. Rep.
Kahl, A., Dujardin, J., and Lehning, M. (2019). The bright side of PV production in snow-covered mountains. Proc. Natl. Acad. Sci. U. S. A. 116, 1162–1167. doi:10.1073/pnas.1720808116
King, B. H., Riley, D., Robinson, C. D., and Pratt, L. (2015). “Recent advancements in outdoor measurement techniques for angle of incidence effects,” in 2015 IEEE 42nd Photovoltaic Specialist Conference (PVSC) (New Orleans, LA: IEEE), USA, June 5-10, 2016 (IEEE), 1–6.
Kratochvil, J., Boyson, W., and King, D. (2004). Photovoltaic array performance model. Tech. Rep. SAND2004-3535, 919131. doi:10.2172/919131
Marion, B., Schaefer, R., Caine, H., and Sanchez, G. (2013). Measured and modeled photovoltaic system energy losses from snow for Colorado and Wisconsin locations. Sol. Energy 97, 112–121. doi:10.1016/j.solener.2013.07.029
Øgaard, M. B., Frimannslund, I., Riise, H. N., and Selj, J. (2022). Snow loss modeling for roof mounted photovoltaic systems: improving the marion snow loss model. IEEE J. Photovoltaics 12, 1005–1013. doi:10.1109/JPHOTOV.2022.3166909
Ratnaweera, N., Kahl, A., and Sharma, V. (2023). Geospatial segmentation of high-resolution photovoltaic production maps for Switzerland. Front. Energy Res. 11. doi:10.3389/fenrg.2023.1254932
Remund, J., and Schmutz, M. (2020) Meteonorm version 8. https://meteonorm.com (accessed January 1, 2024).
Riley, D., Burnham, L., Walker, B., and Pearce, J. M. (2019). “Differences in snow shedding in photovoltaic systems with framed and frameless modules,” in 2019 IEEE 46th Photovoltaic Specialists Conference (PVSC), China, 16-21 June 2019 (IEEE), 0558–0561.
Scherrer, S. C., and Appenzeller, C. (2014). Fog and low stratus over the Swiss Plateau, a climatological study. Int. J. Climatol. 34, 678–686. doi:10.1002/joc.3714
Stein, J., Reise, C., Castro, J., Friesen, G., Maugeri, G., Urrejola, E., et al. (2021). Bifacial photovoltaic modules and systems: experience and results from international research and pilot applications. Tech. Rep. SAND–2021-4835R, IEA–PVPS T13-14:2021, 1779379. doi:10.2172/1779379
Townsend, T., and Powers, L. (2011) Photovoltaics and snow: an update from two winters of measurements in the SIERRA. doi:10.1109/PVSC.2011.6186627
von Rütte, F., Kahl, A., Rohrer, J., and Lehning, M. (2021). How forward-scattering snow and terrain change the alpine radiation balance with application to solar panels. J. Geophys. Res. Atmos. 126. doi:10.1029/2020JD034333
Wang, L., Liu, F., Yu, S., Quan, P., and Zhang, Z. (2020). The study on micromismatch losses of the bifacial PV modules due to the irradiance nonuniformity on its backside surface. IEEE J. Photovoltaics 10, 135–143. doi:10.1109/JPHOTOV.2019.2945185
Keywords: alpine-PV, scaling, winter electricity, photovoltaics, renewable energy
Citation: Frischholz Y, Schilt U, Sharma V, Kahl A, Strebel S, Anderegg D, Rohrer J and Lehning M (2024) Confirmation of the power gain for solar photovoltaic systems in alpine areas and across scales. Front. Energy Res. 12:1372680. doi: 10.3389/fenrg.2024.1372680
Received: 18 January 2024; Accepted: 10 May 2024;
Published: 11 June 2024.
Edited by:
Leonardo Micheli, Sapienza University of Rome, ItalyReviewed by:
Prince Winston D., Kamaraj College of Engineering & Technology, IndiaQian Chen, Tsinghua University, China
Copyright © 2024 Frischholz, Schilt, Sharma, Kahl, Strebel, Anderegg, Rohrer and Lehning. This is an open-access article distributed under the terms of the Creative Commons Attribution License (CC BY). The use, distribution or reproduction in other forums is permitted, provided the original author(s) and the copyright owner(s) are credited and that the original publication in this journal is cited, in accordance with accepted academic practice. No use, distribution or reproduction is permitted which does not comply with these terms.
*Correspondence: Frischholz Y., eWFlbC5mcmlzY2hob2x6QGVwZmwuY2g=