 Sheng Wu1
 Wei Qiu
94% of researchers rate our articles as excellent or good
Learn more about the work of our research integrity team to safeguard the quality of each article we publish.
Find out more
ORIGINAL RESEARCH article
Front. Energy Res., 15 March 2024
Sec. Smart Grids
Volume 12 - 2024 | https://doi.org/10.3389/fenrg.2024.1372618
As an indispensable part of the power transmission system, insulators are of great importance to the safe and stable operation of power grids in terms of their healthy and reliable operation. To realize real-time monitoring of insulator defects under a complex environment, this paper proposes an insulator defect detection method based on the You Only Look Once version 7-tiny (YOLOv7-tiny) algorithm. Then an edge device-unmanned aerial vehicle (UAV) inspection system is developed to verify the real-time performance of the algorithm. By introducing the structure intersection over union (SIoU) loss function to the YOLOv7-tiny model, the regression speed of the anchor frame can be effectively accelerated on the basis of the miniature model, to accelerate the model operation. Thereafter, a smooth sigmoid linear unit (SiLU) activation function is used in the network neck to improve the nonlinear representation ability; After that, an edge computing device based on NVIDIA Jetson Xavier NX is established to verify the real-time performance of the method. Experimental results reveal mean average precision (mAP) of insulators and their missing series defects is as high as 98.31%. Besides, the detection speed of the designed model deployed to mobile edge devices can reach 35 frames per second (FPS), with real-time and accurate detection performance of insulators and their missing series defects.
Overhead power lines play a crucial role in power transmission at various voltage levels (Kiessling et al., 2014; Xiao et al., 2023b). As the energy lifeline of the power system, their reliable structure is essential for ensuring the safe and stable operation of the power system (Kumar et al., 2019; Kumar et al., 2022). The architecture of overhead power lines includes line towers, conductors, insulators, and other key facilities (Albert and Hallowell, 2013; Xiao et al., 2023a). However, due to the effects of climate, extreme weather, and other environmental factors, as well as human interference and foreign objects (Chen et al., 2020), overhead power line structures are susceptible to external intrusion, which can result in insulator defects and other faults (Kumar et al., 2020; Kumari et al., 2022). The leakage current caused by these factors can directly impact the safety of power operation and maintenance personnel, as well as the reliability of power transmission (Yu and Song, 2021; Sun et al., 2022).
Addressing the issue of detecting and locating faults in overhead power line insulators (Tao et al., 2018; Qiu et al., 2023), various common analytical methods have been employed, including manual inspection, infrared thermal imaging, and visual image analysis (Zhang et al., 2017; Xu et al., 2022). Among these, the utilization of unmanned aerial vehicle (UAV) for inspecting overhead transmission lines presents notable advantages such as high efficiency (Saxena et al., 2021; Yan et al., 2023), low cost, and operational simplicity. In recent years, this approach has gained widespread application in the inspection of transmission lines, particularly in challenging environments or post-disaster assessment scenarios (Chowdhury et al., 2021).
Numerous scholars domestically and internationally have conducted extensive research on the issue of insulator faults. The research is primarily categorized into classical feature extraction and artificial intelligence methods (Antwi-Bekoe et al., 2022; Pan et al., 2022). Classical feature extraction techniques include binarization, binary support vector machines (Zhou et al., 2020), edge detection algorithms based on Canny (Cao et al., 2020), and multiscale feature extraction (Zhang et al., 2020; Siu et al., 2022). After the feature extraction process, fault areas are identified using either a threshold method or classical machine learning approaches. However, these methods have limitations in terms of accuracy, sensitivity to background interference, and real-time analysis, especially when dealing with high-resolution images and complex background disturbances.
With the advancement of artificial intelligence technology and computing resources, various deep learning frameworks have been proposed for real-time identification of the location and types of insulator faults (Tao et al., 2018). Pioneered the use of convolutional neural network to analyze aerial images, providing a robust methodology for identifying power line insulator defects. Building on this foundation, (Guo et al., 2019), introduced YOLOv3, presenting an innovative real-time approach to insulator defect detection with improved efficiency and accuracy (Jiang et al., 2020). Presented YOLOv4-tiny which reduced the parameters and improved the real-time performance through innovative modifications compared to YOLOv3 (Bie et al., 2023). Proposed an improved YOLOv5 algorithm, named YOLOv5n-L, for lightweight. In a subsequent development, (Zhao et al., 2021), contributed a refined model based on the faster region convolutional neural network, specifically tailored for recognizing insulators in transmission lines and enhancing fault detection precision. A common limitation of these detection models is the neglect of hardware execution speed in real-world applications, thereby restricting the real-time capability of insulator fault detection.
To mitigate the aforementioned issues, (Wang et al., 2020), introduced an improved ResNeSt and region proposal network, emphasizing enhanced accuracy in insulator defect identification. Similarly, (Xu S. et al., 2022), contributed with an Improved MobilenetV1-YOLOv4, prioritizing lightweight models without compromising detection precision (Dian et al., 2022). Proposed the Faster R-Transformer, specifically tailored for efficient insulator detection in complex aerial environments, showcasing adaptability to diverse operational scenarios. Furthermore, (Ding et al., 2022), presented a high-accuracy real-time insulator string defect detection method based on Improved YOLOv5, highlighting precision and timely identification of potential issues. However, these methods have primarily been tested through server-side deployment, and the exploration of online detection using edge computing devices on unmanned UAV remains relatively unexplored.
To address the insufficient real-time performance in insulator defect detection for UAV inspections in power grid patrols, this paper proposes an online detection method for insulator defects based on YOLOv7-tiny. The model is trained using an insulator dataset publicly available from the State Grid Corporation of China. Comparative analyses are conducted between the improved model and commonly used classical algorithms to demonstrate the effectiveness of the proposed approach. To assess the real-time performance of the algorithm, an edge computing module based on the NVIDIA Graphics Processing Unit (GPU) is established. Experimental verification shows that the execution speed can reach 35 frames per second.
The structure of this paper is organized as below: Section 2 presents the principle of YOLOv7-tiny for insulator defect detection, and Section 3 develops the hardware platform for testing the real-time detection. Then, the experiments and conclusion are given in Sections 4, 5.
The analysis of UAV gimbal visual images in power grid inspections poses a challenge due to their high resolution. Constrained by complex background noise, classical signal analysis theories find it challenging to discriminate insulator fault regions effectively (Xia et al., 2022). To address this, this paper employs a YOLOv7-based object detection algorithm for insulator detection. Its notable advantages include strong noise resistance and excellent detection accuracy.
YOLOv7, a novel object detection algorithm proposed by scholars Chien-Yao Wang, Alexey Bochkovskiy, and others in 2022 (Wang et al., 2023), outperforms all known object detection network models in terms of both speed and accuracy. The algorithm achieves a frame-per-second transmission rate ranging from 5 frames per second (FPS) to 160 FPS.
YOLOv7 introduces an Extended Efficient Layer Aggregation Network (E-ELAN) as its main innovation. This efficient aggregation network enhances the learning and convergence processes of deep networks by controlling the shortest and longest gradient paths. Simultaneously, E-ELAN improves network feature extraction capabilities by extending, shuffling, and merging while maintaining the original gradient paths. The main network employs a Max-Pooling (MP) module for downsampling features, reducing detail loss in feature representation. The neck network integrates the feature pyramid network and path aggregation network from YOLOv5 for feature fusion. Spatial Pyramid Pooling (SPP) combined with Cross Stage Partial (CSP) structure is enhanced into SPPCSPC, integrating convolution operations and convolution branches before and after SPP to reduce computation while improving accuracy. The Receptive Field Enhanced Convolution (REPConv) module is employed in two structures during training and inference. During inference, reparameterization is applied without compromising accuracy, reducing parameters.
Compared to other object detection models, although YOLOv7 demonstrates significant improvements in both detection speed and accuracy, its computational complexity poses challenges for deployment on mobile computing platforms. Therefore, this paper proposes insulator defect detection based on a lightweight YOLOv7-tiny model.
YOLOv7-tiny is a lightweight model derived from YOLOv7 (Ma et al., 2023), as illustrated in Figure 1, with an input pixel size of 640 × 640 × 3. The basic convolutional module (Conv+BN+LeakyReLU, CBL) comprises convolution, batch normalization, and the Leaky Rectified Linear Unit activation function (LeakyReLU). To reduce model complexity, ELAN replaces E-ELAN, and in ELAN, features are branched with a single CBL module and concatenated with three CBL modules in series. The output of these four features is concatenated through a fusion layer (Concat), and finally, it passes through a CBL module to produce the output features. The MP downsampling module removes the convolutional branch, retaining only the pooling operation. In the neck network, the SPPCPSC module divides the input features into two parts. One part passes through the SPP module, while the other part passes through the CBL layer. The resulting features are then concatenated through the Concat layer, and the final features are output after passing through a CBL layer. Simultaneously, the REPConv module is removed from the neck network. The network head outputs detection results for three scales: 80 × 80 × (5+n) × 3, 40 × 40 × (5+n) × 3, and 20 × 20 × (5+n) × 3, where n represents the number of target detection categories.
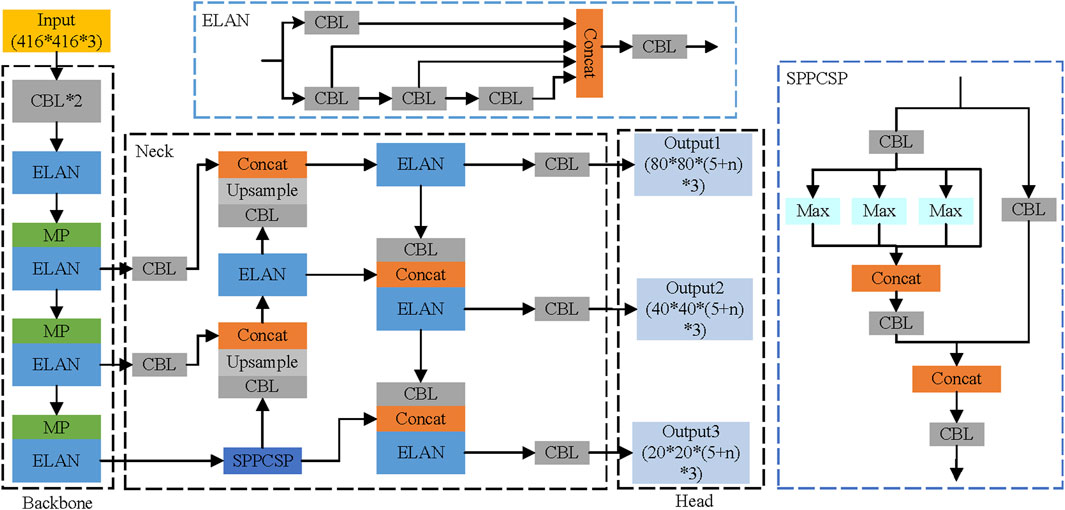
FIGURE 1. System structure diagram of designed YOLOv7-tiny model.
To enable the YOLOv7-tiny model to learn insulator information within images, the model incorporates three types of losses: confidence, classification, and bounding box regression losses. The classification loss is represented by the cross-entropy loss function, which calculates the error between the predicted and actual results for insulators. The confidence loss utilizes the logistic regression loss function to compute the discrepancy. The regression loss for the bounding box is computed using the Complete Intersection over Union (CIoU) loss function.
The bounding box loss function plays a crucial role in the execution speed of the model, and traditional CIoU loss functions are known to suffer from slow convergence. Therefore, this paper replaces CIoU with the structure intersection over union (SIoU) loss function to expedite anchor box regression speed and enhance the overall model training effectiveness. The definition of the CIoU loss function can be expressed as Eq. 1:
where b and bgt represent the predicted and ground truth bounding boxes, respectively. The term ρ denotes their Euclidean distance, representing the diagonal length of the minimum enclosing rectangle for the two boxes. IoU indicates the ratio of the intersection area to the union area between the predicted bounding box and the ground truth bounding box. c represents the diagonal distance of the minimum enclosing bounding box that can simultaneously contain the predicted box and the ground truth box. The variable ν is utilized to quantify the similarity in aspect ratios between the two boxes, and αc functions as a balancing coefficient in the computation.
The CIoU loss function attempts to approximate bounding boxes by considering three geometric metrics: intersection over union, center point distance, and aspect ratio. However, it does not account for the orientation factor between the predicted and ground truth bounding boxes. Consequently, this omission results in slow convergence of anchor boxes, leading to suboptimal training outcomes.
To address the aforementioned issues, this paper replaces the CIoU loss function with the SIoU loss function, as defined by Eq. 2.
where Δ represents the distance loss, defined as Eq. 3. In Eq. 3, γ = 2 − Λ, the term ρ denotes their Euclidean distance. And Ω is the shape loss, as shown in Eq. 4, where θ indicates level of concern about loss of shape. The distance loss includes an angle loss denoted as Λ. A schematic representation of the angle loss is illustrated in Figure 2, and its definition is given by Eq. 5.
where 5, x = sin(α) represents the angle between the two boxes as depicted in Figure 2. As angle x changes, the angle loss varies, as shown in Figure 2. It can be observed from Figure 2 that as angle α between the predicted and ground truth boxes approaches zero, angle loss Λ also tends towards zero. Therefore, when γ approaches 2, distance loss decreases, while when the angle approaches 45°, Λ approaches 1, increasing distance loss. The SIoU loss addresses the angle issues between the regression vectors of anchor boxes, allowing the predicted box to move towards the nearest X or Y-axis before regressing to the coordinates of the anchor box and the target box. This acceleration improves the regression speed of the anchor boxes.
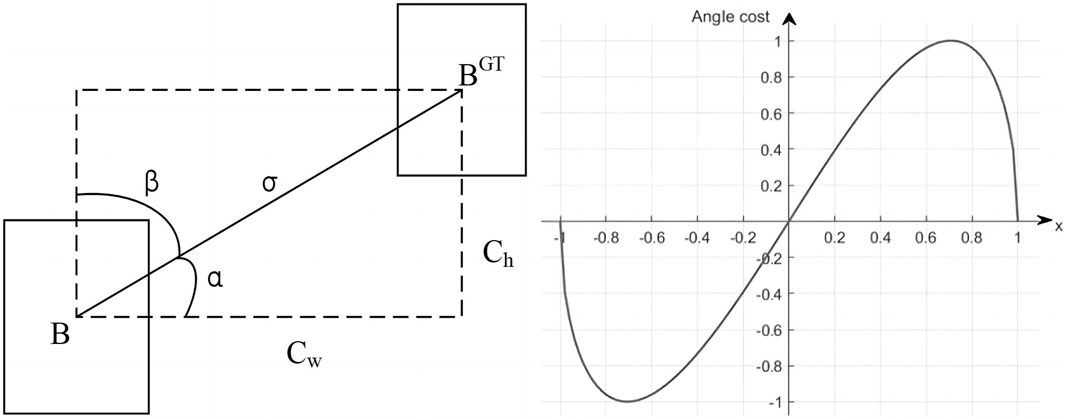
FIGURE 2. Direction between the predicted and the real frame and the angle loss change curve.
YOLOv7-tiny utilizes the LeakyReLU activation function, an extension of the rectified linear unit (ReLU). In this paper, the LeakyReLU function is replaced with the smooth sigmoid linear unit (SiLU), which effectively mitigates the issue of neurons consistently outputting zero during training, preventing weight updates. The computational formula for SiLU is expressed in Eq. 6.
where σ(x) represents the sigmoid function. The SiLU function, with its simple derivative, accelerates the training process of neural networks. Its output is positive across all input ranges, aiding in avoiding the issue of gradient vanishing and improving training effectiveness. Compared to LeakyReLU, SiLU has a minimum value at zero and is smoother, providing better stability in gradient computation during backpropagation. This enhances the model’s representational capacity. The curves of the LeakyReLU and SiLU functions are depicted in Figure 3.

FIGURE 3. Comparison of LeakyReLU and SiLU curves.
The structural complexity of the power distribution system necessitates the use of small, long-endurance UAV for inspection tasks. The DJI M300 industrial-grade UAV is well-suited for such applications, featuring a compact size and extended flight duration. With the capability to support a transmission distance of up to 15 km, this UAV is equipped for capturing infrared images to detect anomalies in the temperature of power transmission lines and insulators. This makes it particularly suitable for the efficient execution of power grid inspection tasks.
To achieve real-time discrimination of insulator dropout defects during power grid inspections, this paper designs a system based on the NVIDIA Jetson Xavier NX edge computing device and establishes communication between the edge computing device and the UAV (Liu et al., 2022), as illustrated in Figure 4. The Jetson Xavier NX edge computing device, equipped with 384 CUDA cores, 48 Tensor cores, and 2 NVDLA engines, provides parallel processing capabilities. This configuration is well-suited for concurrently handling high-resolution image data and processing data from multiple sensor sources during power grid inspections.
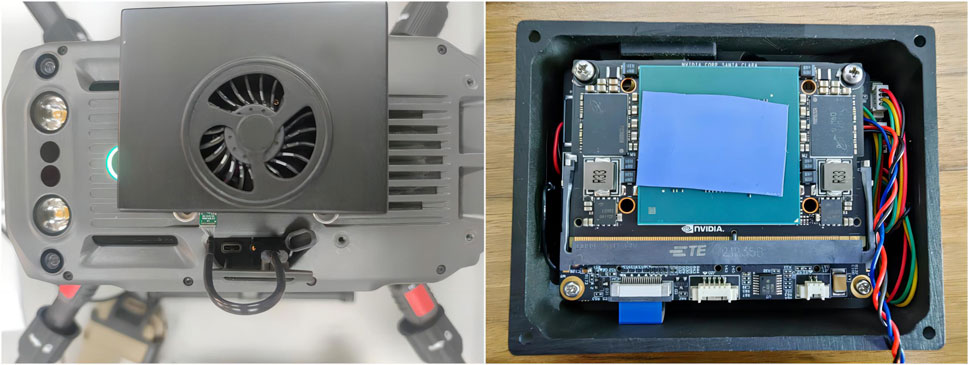
FIGURE 4. Connection between UAV and edge device.
The DJI M300 drone enables interaction with external systems through the Onboard Software Development Kit (OSDK). OSDK is a software toolkit developed by DJI for upper-level applications on UAV. It can be easily ported to mobile edge devices or onboard computers. By leveraging various predefined interface functions within OSDK, real-time interaction and acquisition of image data from the UAV can be established. Furthermore, developers can customize and embed algorithms and logical frameworks into this toolkit, enabling real-time control of the UAV for functionalities such as automated cruise flight, control of onboard equipment, and visual target detection and analysis. To achieve this, the OSDK interface on the DJI drone must be connected to the edge computing device, as illustrated in Figure 4. The DJI OSDK interface comprises 24 pins, primarily requiring the connection of power supply, serial port, and USB modules to the edge computing device. It operates at a rated voltage of 24V with a current limit of 4A, resulting in a total power output of 96W from the drone. The M300 is configured as a USB slave device by default, and the USB_ID pin must be left floating. The ON_DET pin serves as the detection pin for external OSDK devices connected to the M300, and the counterpart connected to the ON_DET pin must be connected to GND.
After configuring the necessary environment on the edge device running a Linux system, development is conducted in the OSDK environment. The application program accesses DJI OSDK functionalities by utilizing the Vehicle class within OSDK. To develop applications using OSDK, the detailed steps are illustrated in Figure 5.
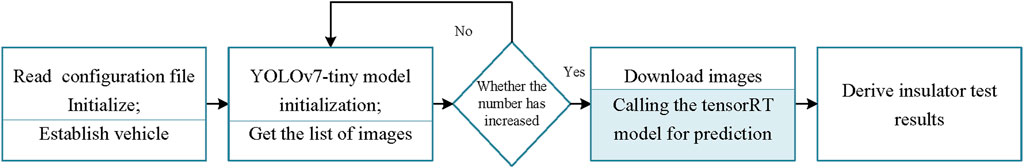
FIGURE 5. Communication program between edge device and drone.
The experimental environment configuration for this study is presented in Table 1. Python was selected as the programming language, and TensorFlow, a deep learning framework, was used to construct and improve the model. The experimental operating system used was Ubuntu 18.04. The model parameters underwent optimization through a search process. The initial settings consisted of a learning rate of 0.001, a training input batch size of 16, and freeze training epochs and iterations set to 50 and 350, respectively.
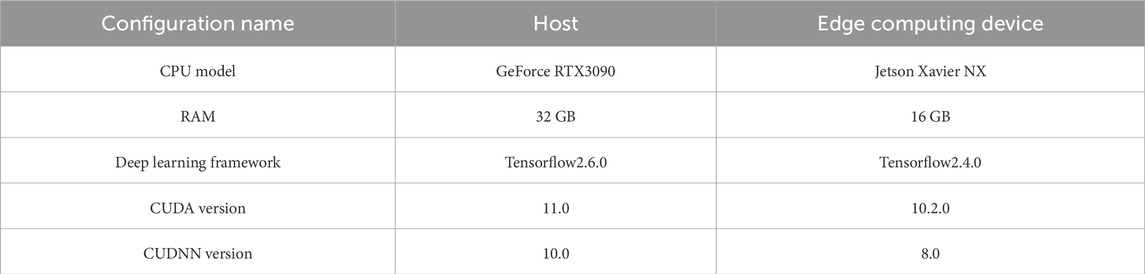
TABLE 1. Experimental environment configuration table.
The YOLOv7-tiny model was trained according to the specified parameters. To maintain consistency in results, the YOLOv4-tiny, YOLOv5s, YOLOv5n and SSD networks were also trained with the same hyperparameter settings and optimal parameters for each network. The resulting average precision values were saved for comparison.
The dataset used in this study is derived from the publicly available Insulator Data Set provided by the State Grid Corporation of China (https://github.com/InsulatorData/InsulatorDataSet). This dataset comprises images of both normal insulators and insulators with defects. The insulator and defective insulator images are categorized and localized using the VOC2007 label format. The normal label encompasses both normal insulator data and synthetically generated defective data, with 600 and 248 samples, respectively.
To address the limited sample size and imbalance between positive and negative samples in the open-source dataset, we employed various data augmentation techniques, such as rotation, brightness variations, and occlusion. This resulted in an expanded dataset, which included 4880 images of normal insulators and 1980 images of defective insulators.
To comprehensively and objectively evaluate the detection accuracy of the proposed algorithm for insulator dropout defects, various metrics were employed, including mean average precision (mAP), average precision, Recall (R), Precision (P), computational complexity (Floating point Operations Per Second, FLOPs), and the number of parameters. The specific calculation formulas for these metrics are as follows:
where N represents the total number of detection categories as Eq. 7. AP is defined as shown in Eq. 8; In Eq. 9, TP represents the number of positive samples correctly identified as positive; FP represents the number of negative samples incorrectly identified as positive. Positive samples are defined as images containing the specified target, while negative samples are those without the target. In Eq. 10, TN is the number of negative samples correctly identified as negative; FN is the number of positive samples incorrectly identified as negative. FLOPs are floating point operations, which represent computational complexity and are commonly used to measure the complexity of the object detection model. Recall is the ratio of correctly identified target instances in images to the total number of targets in the dataset, primarily used to evaluate the recall rate of object detection models.
To compare the detection speed of various models, this paper introduces FPS as an evaluation metric, representing the number of frames processed per second as shown in Eq. 11. The parameter represents the time it takes for a model to detect a single image, serving as a measure of the time required for image detection.
During the model training process, the results for the training and validation sets are shown in Figure 6 as the number of iterations increases. Figure 6 shows that the loss function decreases rapidly within the first 100 iterations and gradually converges to 0 as the number of iterations increases. At the same time, both category accuracy and recall approach 1 as the number of iterations increases. The improved model has smaller initial and final loss values compared to the original model. In summary, the convergence of the model parameters is ideal and no overfitting is observed. Table 2 compares the performance metrics before and after the model improvement. The proposed algorithm shows an improvement in average detection accuracy compared to the YOLOv7-tiny baseline model, with a slight reduction in computational complexity.
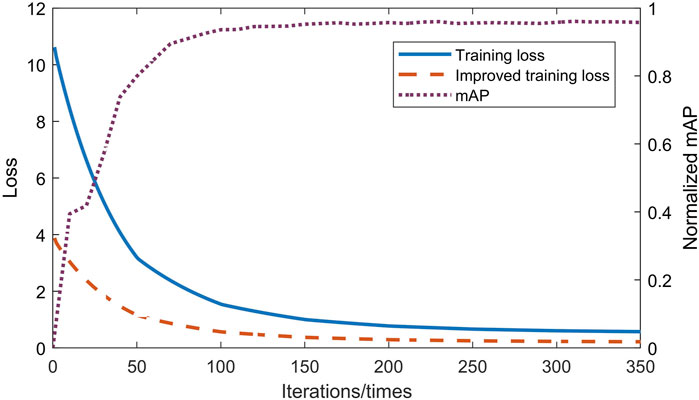
FIGURE 6. Loss function and precision result of the proposed algorithm.

TABLE 2. Performance comparison before and after model improvement.
As shown in Figure 7, replacing the original activation function with SiLU leads to an improvement in convergence speed. Building upon this improvement, our algorithm utilizes the SIoU loss function, resulting in a further enhancement of convergence speed.
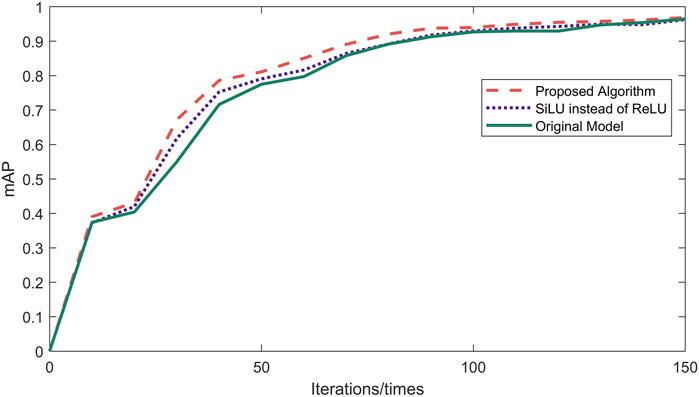
FIGURE 7. Comparison of ablation experiment results.
As depicted in Figure 8A, it is evident that the proposed algorithm in this study exhibits faster convergence compared to YOLOv4-tiny. After 100 iterations, our algorithm has already converged to a relatively high accuracy. In Figure 8B, it can be observed that our algorithm achieves a convergence accuracy almost identical to YOLOv5n. However, when deploying the algorithm to edge devices, our algorithm demonstrates higher detection speed than YOLOv5n, as elaborated in the Section 4.4.2.
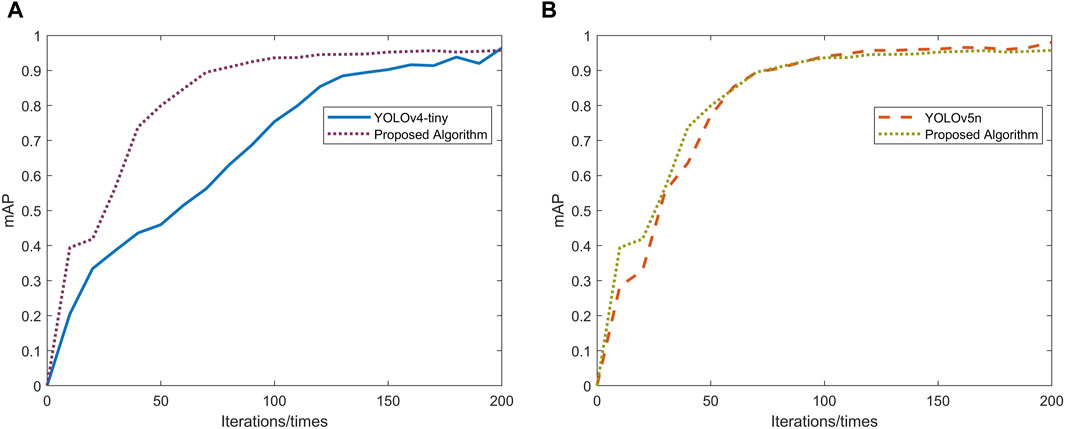
FIGURE 8. Comparison of the accuracy of the proposed algorithm and other models. (A) Comparison of the accuracy of the proposed algorithm and YOLOv4-tiny. (B) Comparison of the accuracy of the proposed algorithm and YOLOv4-tiny.
Figure 9 shows the predicted insulation detection images after training on a mixed dataset using the proposed algorithm. The dataset includes various insulation sizes, including large and small insulation dimensions, complex insulation backgrounds, and scenes where insulation defects are occluded.
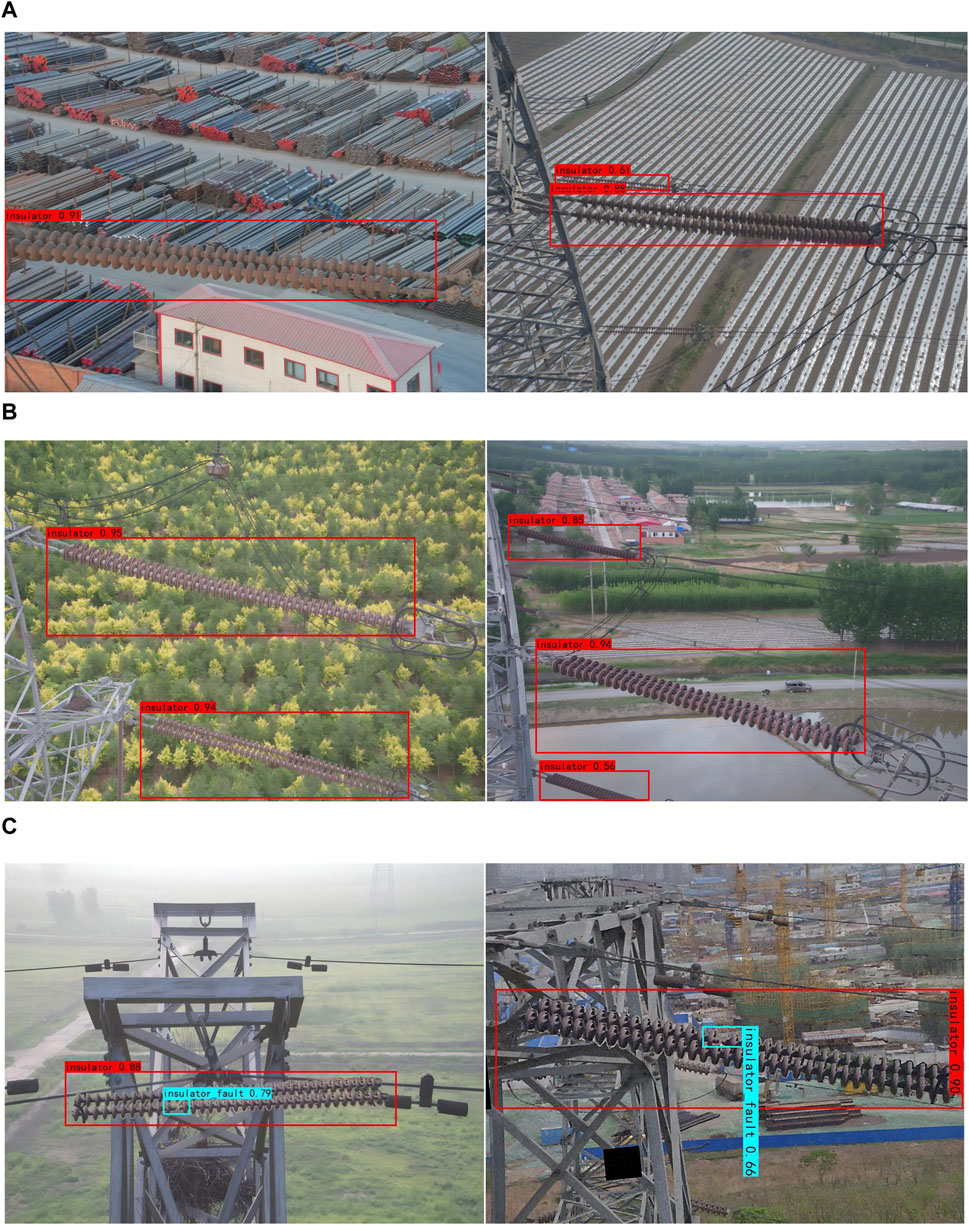
FIGURE 9. Detection performance of the proposed algorithm. (A) Insulator recognition with similar color backgrounds. (B) Insulator defect recognition. (C) Insulator recognition in complex backgrounds.
From Figures 9A, B, it can be observed that for larger insulators, the confidence of the detected insulator ranges from 0.9 to 1.0, while images with smaller insulators in the background have relatively lower confidence. In addition, in Figure 9B, the insulator detection confidence remains high, above 0.94, even in scenes with complex backgrounds.
The detection of small target defects, such as insulator damage and dislocation, is shown in Figure 9C, with high confidence levels. The results indicate that the proposed algorithm accurately identifies insulator defects in the images and precisely locates the insulators, effectively avoiding the problems of false positives and false negatives in insulator defect detection.
The detection performance of different models is shown in Figure 10. Compared to the detection result in Figure 8B of our proposed algorithm, YOLOv4-tiny detects one less insulator, indicating inferior multi-target detection performance compared to our algorithm. Although the confidence level of YOLOv5n is slightly higher than our algorithm, its actual deployment detection speed is inferior to our algorithm and it requires higher computational resources.
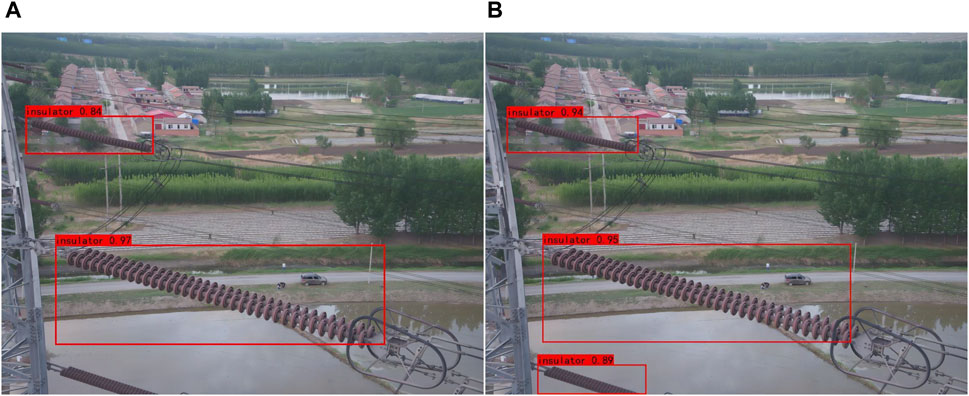
FIGURE 10. Detection performance of different models. (A) Detection performance of YOLOv4-tiny. (B) Detection performance of YOLOv5n.
To demonstrate the effectiveness of the proposed method, this study compares it with representative insulator defect detection methods, including SSD, YOLOv4-tiny, YOLOv5s and YOLOv5n. The experimental results are presented in Tables 2, 3. Table 3 provides detailed results for the recognition of the mixed dataset on the three networks.
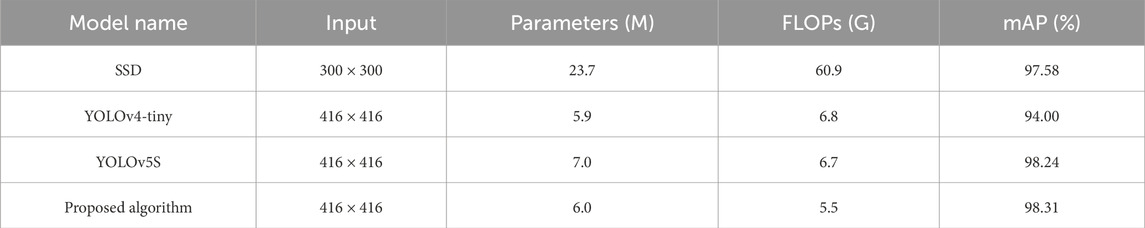
TABLE 3. Performance comparison of different insulator identification models.
Table 3 presents the performance comparison results of different insulator recognition models for power grid inspections. From Table 3, it can be observed that the SSD model has the highest number of parameters, indicating its relatively complex nature, with FLOPs reaching 60.9. In contrast, the YOLOv4-tiny model has significantly fewer parameters than SSD, and its FLOPs are only 1/10 of SSD. Although its mAP is slightly lower at 94%, it demonstrates good performance. YOLOv5s, based on its minimal parameters and FLOPs, achieves the highest detection accuracy at 98.24%. Finally, the proposed algorithm has parameters and FLOPs of 6.0 and 5.5, respectively. Despite having a slightly higher mAP compared to YOLOv5s, the proposed algorithm exhibits the lowest FLOPs, indicating the fastest detection speed, making it more suitable for online detection of insulators in power grid inspections.
To comprehensively validate the proposed method against other models in the detection of normal and defective insulators, Table 4 presents a detailed comparison of the input, parameter count, FLOPs, and mAP for each model.
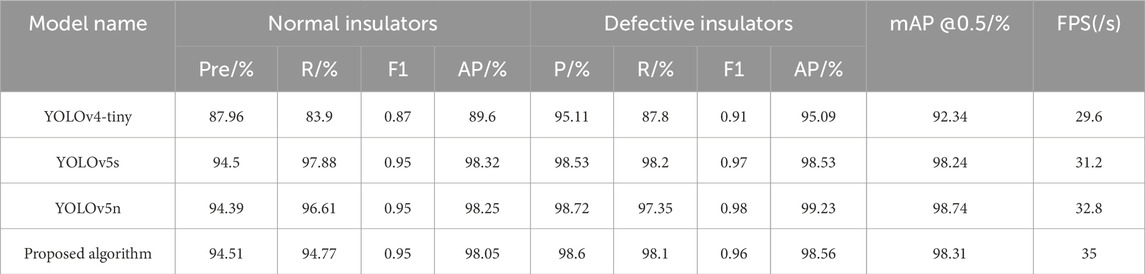
TABLE 4. Comparison of detection results of different network models.
For the YOLOv4-tiny model, it exhibits lower detection accuracy, recall rate, F1, and AP performance. This is primarily attributed to the challenge of accurately detecting multiple small insulators when they overlap with each other. YOLOv5s achieves an average mAP of 98.38%, but its FLOPs are too high, reaching 116% of the proposed algorithm. Consequently, it faces challenges in terms of deployment and execution on mobile computing platforms.
Concerning YOLOv5n, its detection accuracy for normal insulators is 94.39%, which is slightly lower than the proposed algorithm. Although its detection performance for defective insulators is slightly higher compared to the proposed method and the YOLOv4-tiny model, it relies on non-maximum suppression for selecting insulator prediction boxes. This design can lead to suboptimal performance when dealing with multiple target objects within a single grid. Utilizing the designed GPU edge computing device, the proposed method achieves the highest FPS, with a detection speed of 28 ms per image (1/35). Additionally, its detection accuracy is only 0.12% lower than the highest recognition accuracy for defective insulators.
In summary, the proposed algorithm effectively balances parameters, FLOPs, and mAP. It maintains a lower computational load while achieving higher mAP accuracy for both normal and defective insulator scenarios. This makes it suitable for the online detection of insulators in power grid applications.
To achieve real-time detection of insulator defects during power grid inspections, this paper proposes an improved YOLOv7-tiny-based method for detecting insulator stringing defects. Additionally, a GPU-based edge computing device was constructed to verify the feasibility of real-time detection in power grid inspection systems. By introducing the SIoU loss function to the YOLOv7-tiny model, the regression speed of anchor boxes can be effectively accelerated on the basis of the miniature model, thereby accelerating model computation. Additionally, a smooth SiLU activation function is employed in the network bottleneck to enhance the nonlinear representation capability. The detection results based on the insulator dataset demonstrate that the proposed method accurately identifies insulator targets and their positions. It achieves precise recognition of insulator defects even in complex and noisy backgrounds. Comparative analysis with the YOLOv7-tiny algorithm indicates that the model achieves a detection accuracy of 98.60% for defective insulators, with a mean average precision of 98.31%. The model can accurately identify multiple insulator targets within the same power grid inspection image. Furthermore, the experimental results based on the UAV and NVIDIA Jetson Xavier NX edge computing device platform demonstrate that the detection speed for images with a resolution of 416 × 416 can reach 28 ms per image, effectively enabling online identification of insulator defects in transmission lines. Compared to state-of-the-art algorithms, the parameters of our algorithm have also been reduced in space.
Publicly available datasets were analyzed in this study. This data can be found here: https://github.com/InsulatorData/InsulatorDataSet.
SW: Conceptualization, Writing–original draft, Investigation, Methodology, Resources, Validation. XG: Methodology, Supervision, Visualization, Writing–original draft. JX: Software, Supervision, Visualization, Writing–original draft. CM: Writing–review and editing. TD: Software, Writing–review and editing. ZD: Data curation, Writing–original draft. WQ: Data curation, Formal Analysis, Validation, Writing–review and editing.
The author(s) declare financial support was received for the research, authorship, and/or publication of this article. This study was funded by the project of Research and Development of Key Technologies and Devices for On-line Detection of Abnormal Heat in Power Distribution Equipment, Project No. XDKY-2022-07.
Authors SW and JX were employed by Electric Power Research Institute of State Grid Hunan Electric Power Co., Ltd. Author XG was employed by Hunan Xiangdian Experimental Research Institute Co., Ltd.
The remaining authors declare that the research was conducted in the absence of any commercial or financial relationships that could be construed as a potential conflict of interest.
All claims expressed in this article are solely those of the authors and do not necessarily represent those of their affiliated organizations, or those of the publisher, the editors and the reviewers. Any product that may be evaluated in this article, or claim that may be made by its manufacturer, is not guaranteed or endorsed by the publisher.
Albert, A., and Hallowell, M. R. (2013). Safety risk management for electrical transmission and distribution line construction. Saf. Sci. 51, 118–126. doi:10.1016/j.ssci.2012.06.011
Antwi-Bekoe, E., Liu, G., Ainam, J.-P., Sun, G., and Xie, X. (2022). A deep learning approach for insulator instance segmentation and defect detection. Neural Comput. Appl. 34, 7253–7269. doi:10.1007/s00521-021-06792-z
Bie, M., Liu, Y., Li, G., Hong, J., and Li, J. (2023). Real-time vehicle detection algorithm based on a lightweight you-only-look-once (yolov5n-l) approach. Expert Syst. Appl. 213, 119108. doi:10.1016/j.eswa.2022.119108
Cao, Y., Wu, D., and Duan, Y. (2020). A new image edge detection algorithm based on improved canny. J. Comput. Methods Sci. Eng. 20, 629–642. doi:10.3233/jcm-193963
Chen, W., Li, Y., and Li, C. (2020). A visual detection method for foreign objects in power lines based on mask r-cnn. Int. J. Ambient Comput. Intell. (IJACI) 11, 34–47. doi:10.4018/ijaci.2020010102
Chowdhury, S., Shahvari, O., Marufuzzaman, M., Li, X., and Bian, L. (2021). Drone routing and optimization for post-disaster inspection. Comput. Industrial Eng. 159, 107495. doi:10.1016/j.cie.2021.107495
Dian, S., Zhong, X., and Zhong, Y. (2022). Faster r-transformer: an efficient method for insulator detection in complex aerial environments. Measurement 199, 111238. doi:10.1016/j.measurement.2022.111238
Ding, J., Cao, H., Ding, X., and An, C. (2022). High accuracy real-time insulator string defect detection method based on improved yolov5. Front. Energy Res. 10, 928164. doi:10.3389/fenrg.2022.928164
Guo, F., Hao, K., Xia, M., Zhao, L., Wang, L., and Liu, Q. (2019). “Detection of insulator defects based on YOLO V3,” in Artificial intelligence for communications and networks. AICON 2019. Lecture notes of the institute for computer sciences, social informatics and telecommunications engineering. Editors S. Han, and L. Ye (Springer, Cham), 287. doi:10.1007/978-3-030-22971-9_25
Jiang, Z., Zhao, L., Li, S., and Jia, Y. (2020). Real-time object detection method based on improved yolov4-tiny. arXiv preprint arXiv:2011.04244
Kiessling, F., Nefzger, P., Nolasco, J. F., and Kaintzyk, U. (2014). Overhead power lines: planning, design, construction. Springer.
Kumar, N., Singh, B., and Panigrahi, B. K. (2019). Grid synchronisation framework for partially shaded solar pv-based microgrid using intelligent control strategy. IET Generation, Transm. Distribution 13, 829–837. doi:10.1049/iet-gtd.2018.6079
Kumar, N., Singh, B., and Panigrahi, B. K. (2022). Voltage sensorless based model predictive control with battery management system: for solar pv powered on-board ev charging. IEEE Trans. Transp. Electrification 9, 2583–2592. doi:10.1109/tte.2022.3213253
Kumar, N., Singh, B., Wang, J., and Panigrahi, B. K. (2020). A framework of l-hc and am-mkf for accurate harmonic supportive control schemes. IEEE Trans. Circuits Syst. I Regul. Pap. 67, 5246–5256. doi:10.1109/tcsi.2020.2996775
Kumari, P., Kumar, N., and Panigrahi, B. K. (2022). A framework of reduced sensor rooftop spv system using parabolic curve fitting mppt technology for household consumers. IEEE Trans. Consumer Electron. 69, 29–37. doi:10.1109/tce.2022.3209974
Liu, M., Li, Z., Li, Y., and Liu, Y. (2022). A fast and accurate method of power line intelligent inspection based on edge computing. IEEE Trans. Instrum. Meas. 71, 1–12. doi:10.1109/tim.2022.3152855
Ma, L., Zhao, L., Wang, Z., Zhang, J., and Chen, G. (2023). Detection and counting of small target apples under complicated environments by using improved yolov7-tiny. Agronomy 13, 1419. doi:10.3390/agronomy13051419
Pan, L., Chen, L., Zhu, S., Tong, W., and Guo, L. (2022). Research on small sample data-driven inspection technology of uav for transmission line insulator defect detection. Information 13, 276. doi:10.3390/info13060276
Qiu, W., Yadav, A., You, S., Dong, J., Kuruganti, T., Liu, Y., et al. (2023). Neural networks-based inverter control: modeling and adaptive optimization for smart distribution networks. IEEE Trans. Sustain. Energy, 1–11. doi:10.1109/tste.2023.3324219
Saxena, V., Kumar, N., Singh, B., and Panigrahi, B. K. (2021). An mpc based algorithm for a multipurpose grid integrated solar pv system with enhanced power quality and pcc voltage assist. IEEE Trans. Energy Convers. 36, 1469–1478. doi:10.1109/tec.2021.3059754
Siu, J. Y., Kumar, N., and Panda, S. K. (2022). Command authentication using multiagent system for attacks on the economic dispatch problem. IEEE Trans. Industry Appl. 58, 4381–4393. doi:10.1109/tia.2022.3172240
Sun, K., Qiu, W., Dong, Y., Zhang, C., Yin, H., Yao, W., et al. (2022). Wams-based hvdc damping control for cyber attack defense. IEEE Trans. Power Syst. 38, 702–713. doi:10.1109/tpwrs.2022.3168078
Tao, X., Zhang, D., Wang, Z., Liu, X., Zhang, H., and Xu, D. (2018). Detection of power line insulator defects using aerial images analyzed with convolutional neural networks. IEEE Trans. Syst. man, Cybern. Syst. 50, 1486–1498. doi:10.1109/tsmc.2018.2871750
Wang, C.-Y., Bochkovskiy, A., and Liao, H.-Y. M. (2023). Yolov7: trainable bag-of-freebies sets new state-of-the-art for real-time object detectors. Proc. IEEE/CVF Conf. Comput. Vis. Pattern Recognit., 7464–7475. doi:10.1109/CVPR52729.2023.00721
Wang, S., Liu, Y., Qing, Y., Wang, C., Lan, T., and Yao, R. (2020). Detection of insulator defects with improved resnest and region proposal network. IEEE Access 8, 184841–184850. doi:10.1109/access.2020.3029857
Xia, H., Yang, B., Li, Y., and Wang, B. (2022). An improved centernet model for insulator defect detection using aerial imagery. Sensors 22, 2850. doi:10.3390/s22082850
Xiao, H., Gan, H., Yang, P., Li, L., Li, D., Hao, Q., et al. (2023a). Robust submodule fault management in modular multilevel converters with nearest level modulation for uninterrupted power transmission. IEEE Trans. Power Deliv., 1–16. doi:10.1109/tpwrd.2023.3343693
Xiao, H., He, H., Zhang, L., and Liu, T. (2023b). Adaptive grid-synchronization based grid-forming control for voltage source converters. IEEE Trans. Power Syst. 39, 4763–4766. doi:10.1109/tpwrs.2023.3338967
Xu, C., Li, Q., Zhou, Q., Zhang, S., Yu, D., and Ma, Y. (2022a). Power line-guided automatic electric transmission line inspection system. IEEE Trans. Instrum. Meas. 71, 1–18. doi:10.1109/tim.2022.3169555
Xu, S., Deng, J., Huang, Y., Ling, L., and Han, T. (2022b). Research on insulator defect detection based on an improved mobilenetv1-yolov4. Entropy 24, 1588. doi:10.3390/e24111588
Yan, J., Zhang, X., Shen, S., He, X., Xia, X., Li, N., et al. (2023). A real-time strand breakage detection method for power line inspection with uavs. Drones 7, 574. doi:10.3390/drones7090574
Yu, D., and Song, K. (2021). Power line insulator detection. ICMLCA 2021; 2nd Int. Conf. Mach. Learn. Comput. Appl. (VDE), 1–5.
Zhang, P., Zhang, Z., Hao, Y., Zhou, Z., Luo, B., and Wang, T. (2020). Multi-scale feature enhanced domain adaptive object detection for power transmission line inspection. Ieee Access 8, 182105–182116. doi:10.1109/access.2020.3027850
Zhang, Y., Yuan, X., Li, W., and Chen, S. (2017). Automatic power line inspection using uav images. Remote Sens. 9, 824. doi:10.3390/rs9080824
Zhao, W., Xu, M., Cheng, X., and Zhao, Z. (2021). An insulator in transmission lines recognition and fault detection model based on improved faster rcnn. IEEE Trans. Instrum. Meas. 70, 1–8. doi:10.1109/tim.2021.3112227
Keywords: insulator defect, YOLOv7-tiny model, edge computing module, online detection, drone inspection
Citation: Wu S, Gan X, Xiao J, Ma C, Deng T, Du Z and Qiu W (2024) Online insulator defects detection and application based on YOLOv7-tiny algorithm. Front. Energy Res. 12:1372618. doi: 10.3389/fenrg.2024.1372618
Received: 18 January 2024; Accepted: 29 February 2024;
Published: 15 March 2024.
Edited by:
Zijun Zhang, City University of Hong Kong, Hong Kong SAR, ChinaReviewed by:
Linfei Yin, Guangxi University, ChinaCopyright © 2024 Wu, Gan, Xiao, Ma, Deng, Du and Qiu. This is an open-access article distributed under the terms of the Creative Commons Attribution License (CC BY). The use, distribution or reproduction in other forums is permitted, provided the original author(s) and the copyright owner(s) are credited and that the original publication in this journal is cited, in accordance with accepted academic practice. No use, distribution or reproduction is permitted which does not comply with these terms.
*Correspondence: Wei Qiu, cWl1d2VpQGhudS5lZHUuY24=
Disclaimer: All claims expressed in this article are solely those of the authors and do not necessarily represent those of their affiliated organizations, or those of the publisher, the editors and the reviewers. Any product that may be evaluated in this article or claim that may be made by its manufacturer is not guaranteed or endorsed by the publisher.
Research integrity at Frontiers
Learn more about the work of our research integrity team to safeguard the quality of each article we publish.