 Shuo Liu
 Yun Teng
 SongQing Cheng
 NingWei Xu
 Peng Sun
 Kun Zhang
 Zhe Chen
95% of researchers rate our articles as excellent or good
Learn more about the work of our research integrity team to safeguard the quality of each article we publish.
Find out more
ORIGINAL RESEARCH article
Front. Energy Res. , 28 March 2024
Sec. Process and Energy Systems Engineering
Volume 12 - 2024 | https://doi.org/10.3389/fenrg.2024.1372612
This article is part of the Research Topic Digital Technologies by Empowered Sustainable Electrical Energy Development View all 10 articles
In the process of multi-energy system optimal scheduling, due to the high data processing requirements of the multi-energy devices and loads and the complexity of the operating states of the multi-energy devices, the scheduling optimization of the system is to some extent more difficult. To address this problem, this paper proposes a regional multi-energy system optimal scheduling model based on the theory of cloud-edge collaboration. First, based on intelligent data sensors, a cloud-edge cooperative scheduling framework of the regional multi-energy system is constructed. Then, the physical model of operating state data of multi-energy system equipment and the allocation mechanism of system scheduling tasks are studied. With the cloud service application layer and the edge computing layer as the upper and lower optimization scheduling layers, the double-layer optimization scheduling model of the regional multi-energy system is established. The objectives of the model are optimal scheduling cost and minimum delay of scheduling data transmission. The multi-objective whale optimization algorithm is used to solve the model. Finally, a simulation model is built for verification. The simulation results show that the scheduling model established in this paper can effectively improve the scheduling data processing capability and improve the economy of regional multi-energy system scheduling.
The development and operation of power grids are now focused on constructing an intelligent, informatized, and diversified new power system with new energy as the primary source, with the goal of achieving “Carbon peak and Carbon neutralization” (Teng et al., 2018). This requires higher standards for the operation, scheduling, and control of power grids, especially with the integration of a high proportion of new energy power generation resources (Teng et al., 2020). A regional multi-energy system is a complex system involving the input, conversion, and supply of electricity, heat, and gas energy. It contains various energy supply equipment. It can flexibly and reliably meet the consumption demands of users through the conversion and coordination between multiple types of energy (Zhang et al., 2017; Li et al., 2019). However, traditional centralized operation and control methods have difficulty meeting the requirements of large-scale, high-capacity data and information processing of regional multi-energy systems (Lo and Ansari, 2013; Zhang et al., 2018). The rapid development of new intelligent control technologies, such as edge computing (Sulieman et al., 2022; Raeisi-Varzaneh et al., 2023) and IoT technologies (Abir et al., 2021; Gao et al., 2023), provides favorable conditions for promoting the coordinated and integrated development of regional multi-energy system data and information networks. This development forms new application scenarios of energy-information interaction and integration, including cloud-edge synergy, information-physical synergy, digital twins, and other new application technologies (Ren et al., 2019; Su et al., 2019). As a result, there is an urgent need to study optimized operation methods for regional multi-energy systems that can achieve flexibility, reliability and high data and information computation efficiency.
In view of the development and application prospects, some scholars have begun to research the optimization methods of intelligent and informative operation and control of regional multi-energy systems. In (Wang and Li, 2022), it focuses on the problem of short-term load forecasting of power grids. The study proposes a short-term forecasting method of power grid loads based on cloud edge collaboration. The model is trained with a large amount of historical data to provide accurate predictions. In (Luo et al., 2022), aiming at the scheduling deviation of distribution network in a long-time scale and considering the distribution characteristics of transformer equipment in the distribution network, a collaborative scheduling method of the distribution network based on cloud edge cooperation is proposed. The distribution network cooperative optimal scheduling is carried out by taking transformer equipment in different power supply areas of the distribution network as an edge layer, and the optimal scheduling cost of each transformer power supply area is targeted. This results in an improved dispatch economy for the distribution network. In (Xia et al., 2022), a hybrid model for power grid data recognition based on distributed compressed sensing and bidirectional long-short memory network is proposed to address the problem of low power quality data recognition accuracy in power grid. It optimizes the recognition parameters in the model by establishing a cloud-edge cooperative framework and using distributed compressed perception as the edge algorithm, and using a large amount of data to train the model. The improvement of grid power quality data recognition accuracy and anti-interference performance is realized. In (Liu et al., 2018), it analyzed the information architecture and optimization effect of edge computing technology when applied to the optimal scheduling of electric vehicles. The study focused on data processing and information security and proved the effectiveness of edge computing technology in meeting the real-time communication and arithmetic demands of the electric power network. In (Gooi et al., 2023), the advantages of edge computing technology in optimizing, allocating, and scheduling of smart grid resources are analyzed. Then, it explores the relationship between smart grid and artificial intelligence and proposes an optimization method for power grid cloud computing by applying edge intelligence technology. This reduces the pressure on cloud computing and improves the computing efficiency of power grid operation optimization tasks. As for the information and data security problems faced in the process of adopting intelligent technology for the optimal scheduling of power grids or energy systems, some scholars have also carried out research and discussion. In (Li et al., 2022; Li et al., 2023), it studied the collaborative energy management method of multi-energy system under DoS attack for the problems of cyber-attack faced during the energy optimization and scheduling process of multi-energy system. The information security capability for network optimization and energy management processes is enhanced, and its cyber defense resistance capability is improved. In (Huang et al., 2022), it focuses on the problem of the multi-energy system scheduling economy. The study employs a distributed robust optimization algorithm to develop a method for achieving this goal. Meanwhile, a data privacy protection protocol has been researched and designed to address network security issues encountered during the distributed optimal scheduling of the system. This protocol improves the reliability of information transmission during system scheduling and promotes the system’s scheduling economy.
However, there is a lack of detailed modeling analysis and research on the integration of edge computing technology and cloud-edge collaboration technology into the optimization modeling of regional multi-energy system operation and scheduling. There is a lack of relevant research on how to better improve the efficiency of regional multi-energy system scheduling.
Based on the above analysis, this paper studies a cloud-edge cooperative optimal scheduling model of the regional multi-energy system based on edge computing. By utilizing sensors and controllers distributed at different nodes of the regional multi-energy system for collecting and sending energy equipment data and equipment operation control, a regional multi-energy system scheduling framework is established. A multi-node cloud-edge cooperative scheduling model of the regional multi-energy system is established by coordinating different edge computing scheduling layer base stations and by allocating scheduling tasks to multiple base stations. On this basis, a double-layer scheduling optimization model of the regional multi-energy system is established for optimization, and a scheduling model solution process based on multi-objective whale optimization algorithm is given. Thus, there are three main contributions to this research.
(1) A cloud-side coordinated scheduling framework of multi-node energy data information interaction for regional multi-energy systems is established in this paper. The scheduling process of the regional multi-energy system is optimized by dividing it into five service layers and configuring the corresponding computing servers in different scheduling service layers. This improves the data information processing capability of the scheduling calculation and optimization process of the system.
(2) The physical model of the regional multi-energy system is established. The operating parameters of the energy supply equipment have been preliminarily clarified, and a method for sensing the operating state data of the equipment of the multi-energy system has been studied. Further, the multi-node scheduling task allocation model of the regional multi-energy systems has been established to optimize scheduling results among the systems in the coverage area of different regional edge computing layer base stations.
(3) A double-layer optimization scheduling model of the regional multi-energy system is established, which aims at optimal operational scheduling costs and scheduling task transmission delays. The model is solved using the multi-objective whale optimization algorithm.
Finally, the feasibility and validity of the scheduling model established in this paper are analyzed and verified by obtaining the historical data of power grid operation in a region of Northeast China and building a simulation model.
For the regional multi-energy system, the use of a centralized optimization scheduling method may result in increased energy consumption, scheduling costs, and network latency due to the centralized transmission, processing, computation, and distribution of distributed new energy power supply operation information and load demand information. To mitigate these issues, alternative scheduling methods should be considered. Edge computing technology makes use of various data sensors, data routing and other devices configured in the regional multi-energy system to analyze and process the collected operation information data on the side of each distributed power generation equipment. The calculation results are then transmitted to the cloud service data computing center for centralized coordination and scheduling. Based on this, this paper establishes a cloud-side coordinated scheduling framework of multi-node energy data information interaction for regional multi-energy systems, as shown in Figure 1.
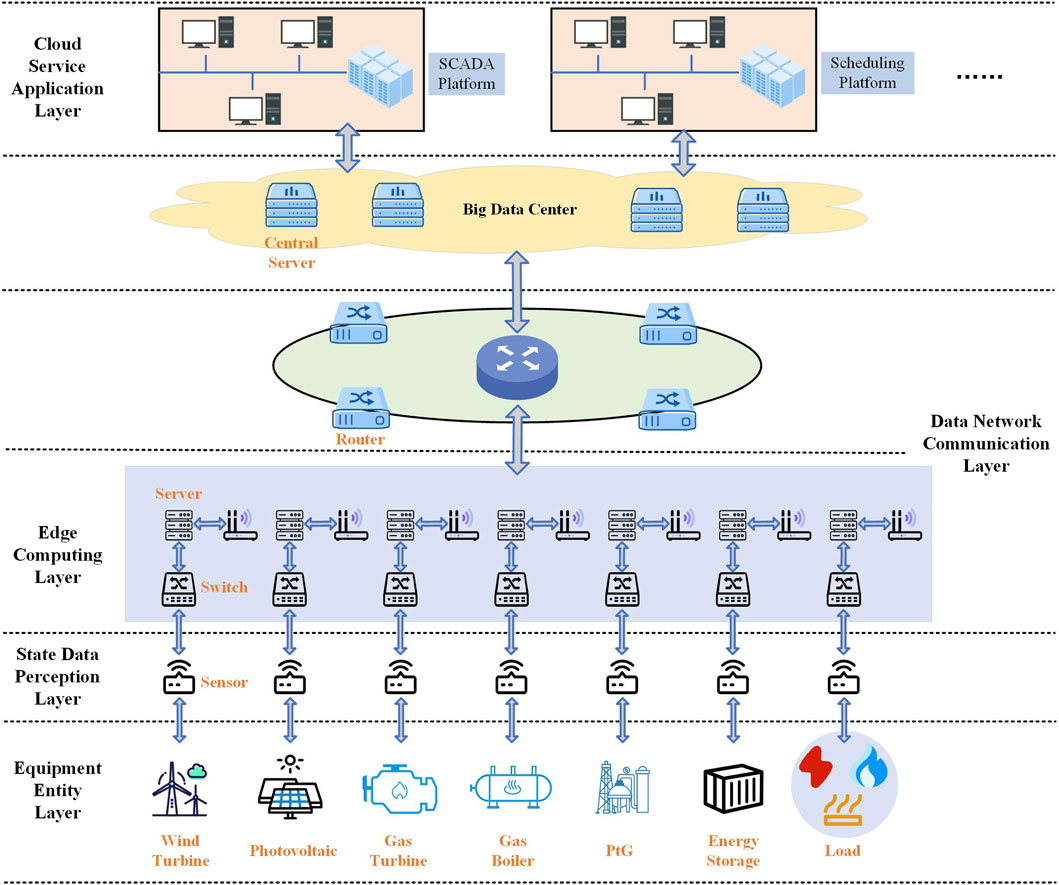
Figure 1. Scheduling framework of the regional multi-energy system.
The scheduling framework shown in Figure 1 is mainly composed of five scheduling service layers: equipment entity layer, state data perception layer, edge computing layer, data network communication layer, and cloud service application layer (Ilic et al., 2010; Si et al., 2020). Computing servers are configured in the corresponding service layers to facilitate data processing, analysis, and storage.
(1) The equipment entity layer is composed of various energy equipment and equipment operation control module. The main task is to use each energy equipment to generate electricity, heat, gas and other energy supply to the consumer. Through the equipment operation control module, it controls and adjusts the operation status of energy equipment.
(2) The state data perception layer is composed of various intelligent energy data collection and measurement modules. Its main task is to assist the edge computing layer and cloud service application layer in perceiving the operating state of each energy equipment in the system.
(3) The edge computing layer is composed of edge computing modules and data storage. Its main task is to calculate the optimal operation scheme for each energy equipment in the regional energy system. This includes determining the optimal output of energy equipment, energy supply, and transaction prices.
(4) The data network communication layer is composed of data routing, wireless modules, etc., Its main task is to facilitate the communication and transmission of energy data, scheduling data, and control commands between the state data perception layer, edge computing layer, cloud service application layer, and other layers. Its goal is to ensure quick and lossless data transmission.
(5) The cloud service application layer serves as the energy management center for power generation, transmission, and supply in the regional multi-energy system. It is composed of servers and centralized scheduling centers, and its main task is to provide data storage, reading, computation, analysis, and dynamic display services for the centralized regulation and control of the regional multi-energy system. Through computation and analysis, the optimal supply scheme for a regional multi-energy system is calculated to realize the optimal scheduling of regional multi-energy system.
As shown in Figure 1, the construction of the physical entity model of each energy supply equipment within the system is the basis for the optimal scheduling of the regional multi-energy system. To carry out this study, the network topology of the regional multi-energy system is established, as shown in Figure 2. The system is composed of photovoltaic cells, wind turbines, gas turbines, gas boilers, PtG equipment, and energy storage equipment. It provides electricity and heat energy to the system energy users by purchasing natural gas from the superior gas network. Part of the natural gas is directly supplied to the users through the gas network. The gas turbine and gas boiler are used to provide electricity and heat energy to the system energy users, respectively. The wind turbine and photovoltaic are used to provide electricity to users. The system is connected to the main power grid to compensate for any electricity shortages. The PtG equipment is used to output the gas energy to the energy users. The energy storage equipment is mainly used to regulate the input and output of various energy sources of the regional multi-energy system by charging and discharging energy.
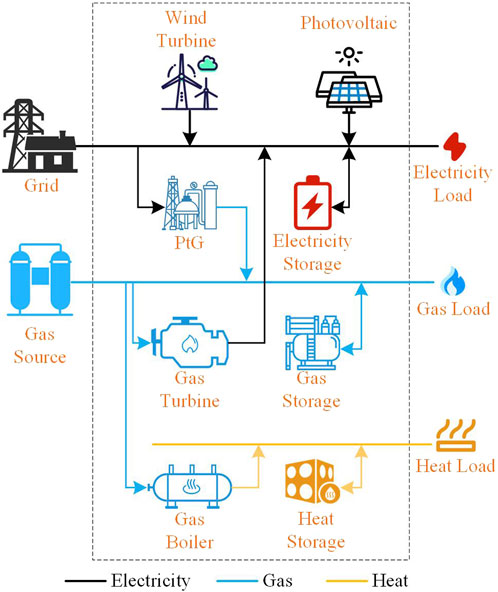
Figure 2. Topology of the multi-energy system.
Taking doubly-fed wind turbine as an example, the physical model of the wind turbine can be described by Eq. 1:
where Pw,t is the output of the wind turbine at time t; Qw,r is the torque corresponding to the force of the wind turbine blade in the rotation process; Qw,m and Qw,e are the input mechanical torque and the output electromagnetic torque of the unit, respectively; Jw is the rotational equivalent inertia of the blade; Jw,g is the rotational equivalent inertia of the wind turbine; ωw,t and ωw,g are fan speed and wind turbine speed, respectively; Km is the stiffness coefficient of the low-speed rotating shaft of the unit; Bd is the damping factor of the wind turbine; θw,t and θw,g are the angular velocity displacement of the wind wheel rotor and the rotational velocity displacement of the wind turbine rotor, respectively; Nw,g is the gearbox ratio;
Therefore, there are 14 operational parameters needed to be sensed by the wind turbine, which can be expressed by Eq. 2:
The physical model of the photovoltaic cell can be described by Eq. 3:
where PPV,t is the output of the photovoltaic cells at time t; UPV and IPV are the voltage and current at both ends of the photovoltaic cells, respectively; Ubr is the diode reverse breakdown voltage in the equivalent schematic diagram; Rs and Rsh are the equivalent series resistance and parallel resistance at both ends of the battery in the equivalent schematic diagram; Iph is the photogenerated current of the photovoltaic cells when the illumination is QPV and the temperature is TPV; I0 is the diode equivalent reverse saturation current in the equivalent schematic diagram; k = 1.38 e−23 J/K; β is the fitting factor of the output characteristics of the diode inside the photovoltaic cell, which reflects the similarity between the output characteristics of the diode inside the photovoltaic cell and the output characteristics of the ideal diode.
Therefore, there are 10 physical parameters of the photovoltaic cell, which can be described by Eq. 4:
The operating status of the gas turbine is mainly limited by its operating efficiency and intake volume. The physical model of the gas turbine can be described by Eq. 5:
where PMGT,t is the output of the gas turbine at time t; PMGT,g, PMGT,pa, and PMGT,gc are the turbine output, compressed air consumption power, and compressed natural gas consumption power, respectively; f is the ratio coefficient of natural gas to air when natural gas is fed into the gas turbine; Vgas and Vpa are the gas intake and air volume of the gas turbine, respectively;
The physical parameters of the gas turbine can be described by Eq. 6:
The relationship between energy input-output of a gas boiler is described by Eq. 7:
where PGB,t is the heat output of the gas boiler at time t; VGB,t is the amount of natural gas intake at time t; ηGB is the heat production rate of the equipment; HCVNG is the low calorific value of natural gas.
The physical parameters of the gas boiler can be described by Eq. 8:
The relationship between electrical energy consumption and natural gas output in the PtG equipment can be described by Eq. 9:
where PPtG,t is the natural gas output power of the PtG equipment at time t; PPtH,t, PH2,t, and PHtG,t are the electric-hydrogen conversion output power, hydrogen storage power and hydrogen-gas conversion output power inside the PtG equipment at time t, respectively; ηPtH,t, ηH2,t, and ηHtG,t are the hydrogen methanation efficiency, hydrogen storage efficiency and hydrogen discharge efficiency of the PtG equipment at time t, respectively; QH2,t is the hydrogen storage capacity in the PtG equipment at time t, and QminH2 and QmaxH2 are its minimum and maximum values, respectively.
The physical parameters of the gas turbine can be described by Eq. 10:
The regional multi-energy system utilizes electricity storage batteries, gas storage equipment, and heat storage equipment for charging and discharging, which serve to regulate the output of the regional multi-energy system. Therefore, it can be described by Eqs 11–13.
where Pce,t and Pde,t are the charging and discharging power of the electricity storage battery at time t, respectively, and
where Qg,t is the storage volume of gas storage equipment at time t; ηg is the storage efficiency; Qg,t0 is the storage volume of natural gas at time t0; Ping,t and Poutg,t are the charging and discharging power of the gas storage equipment at time t, respectively.
where Qh,t is the heat energy storage of the equipment at time t; ηh is the heat efficiency; Qh,t0 is the heat energy storage of the equipment at time t0; Pinh,t and Pouth,t are the heat storage and heat release power of the heat storage equipment at time t, respectively.
Assuming that the regional multi-energy system being studied includes m edge computing layer base stations (which handle the main tasks of the edge computing layer and the data network communication layer) and n energy-consuming users. These can be denoted as edge computing layer base station set M = {
The edge computing layer base station provides data support and scheduling calculation services to energy consumption users and the cloud service layer. This is achieved according to the edge computing module, data storage and communication module, data routing and other equipment deployed in the system. At the same time, the base station can transmit the calculated data and collected data to the neighboring base station. Then, by allocating the computation tasks to be completed by its own base station, it realizes the cooperative computation of multiple edge computing base stations to better complete the edge node scheduling optimization in the regional multi-energy system. If the edge computing layer base station is responsible for a small amount of computation tasks, the current base station can be used to complete the scheduling tasks.
If all energy equipment and energy consumption users in the scheduling process of the regional multi-energy system perform system scheduling optimization at the same time, all the computation tasks of the edge computing layer base station are allocated according to Eq. 15.
where X is the system scheduling task allocation decision set; xn,i,m is the corresponding values taken in the set.
Meanwhile, at least one base station in the edge computing layer must perform all computational tasks while satisfying the constraint of Eq. 16.
where the first term is the constraint on the computational tasks to be completed by the edge computing layer base station; the second and third terms are the constraints on the response of the computational and data storage capacity of the edge computing layer base station m; EculX,m and EstoX,m are the amount of the response of the computational and data storage capacity of the edge computing layer base station m, and Emaxculm and
When performing optimized scheduling computation tasks for the regional multi-energy system, each task requires energy for computation and data communication, as well as incurs transmission delays. Therefore, the cost and transmission delay consumed by the edge computing layer and the cloud service application layer can be expressed by Eq. 17:
where Ccoop,t is the consumption cost of the optimized scheduling computation task performed by the regional multi-energy system; NumM is the number of edge computing layer base stations executing the computation task at time t; Ccul,m is the operation cost of the mth edge computing layer base station; Tcoop,i is the transmission delay of the optimized scheduling computation task performed by the regional multi-energy system at time t, and
In the actual optimization scheduling process, the computing process of multi-node cloud-edge cooperative scheduling in the regional multi-energy system is shown in Figure 3.
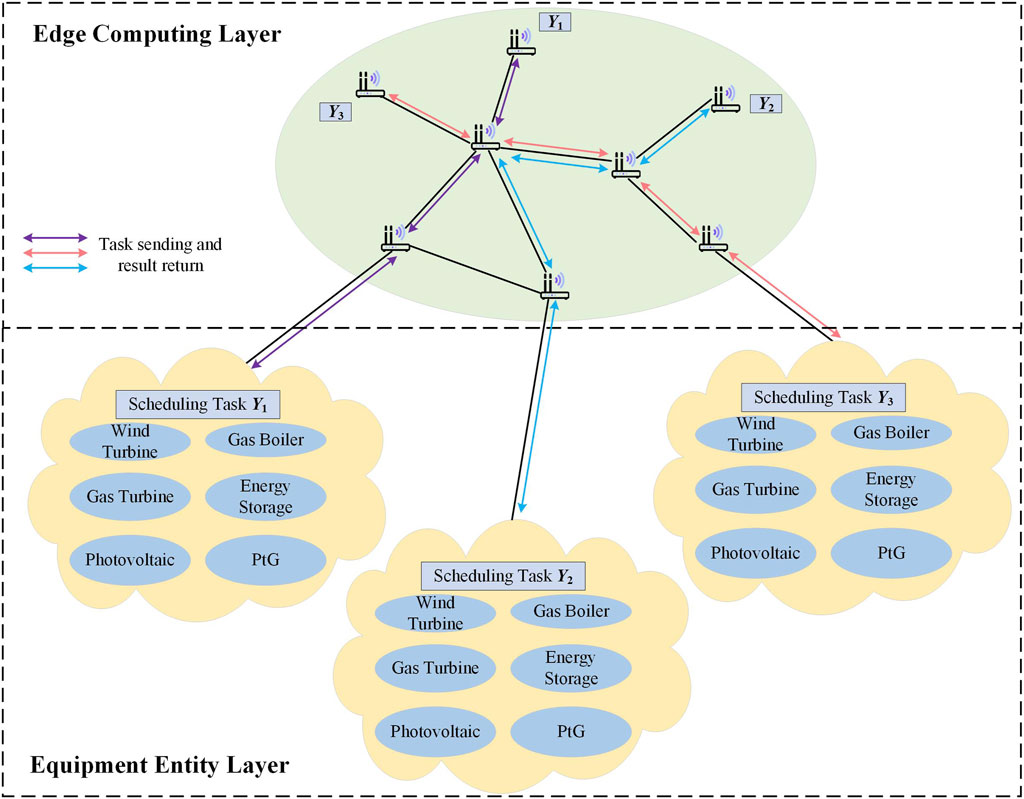
Figure 3. Multi-node cloud-edge collaborative scheduling computing process.
The state data sensing layer collects the operating state data and ledger data of each energy equipment in the equipment entity layer and stores them in the databases of the edge computing layer and the cloud service application layer. Then, the optimization scheduling task begins at each energy equipment and energy consumption user. It is then uploaded to the edge computing layer, where the computing task is allocated based on Eq. 15. The corresponding optimization computation is executed, and the operation scheduling commands are sent to the equipment entity layer based on the computational results to regulate the operation state of the energy equipment. At the same time, the computation results are summarized, merged, and sent to the cloud service application layer. Finally, the cloud service application layer performs the scheduling of region multi-energy systems covered by the edge computing layer base stations based on the received scheduling optimization data and the energy equipment operation data. The scheduling optimization calculation is unified and coordinated for the whole multi-energy system. The calculation results are also sent to the edge computing layer through the data network communication layer.
To fully utilize the multi-node cloud-edge collaborative scheduling capability in the optimization and scheduling process of the regional multi-energy system, the double-layer optimization scheduling model of the regional multi-energy system is established as shown in Figure 4. The upper-layer optimization model in the cloud service application layer adopts an intelligent optimization algorithm to minimize the overall operation and scheduling cost of the regional multi-energy system. It completes the scheduling optimization of the systems in the coverage area of the different regional edge computing layer base stations in the regional multi-energy system and obtains the optimal energy supply scheduling scheme, based on the received scheduling optimization data and energy equipment operation data. The lower-layer optimization model is that the edge computing layer calculates the optimal energy supply scheduling scheme based on the optimal energy supply scheduling scheme and control commands calculated by the cloud service application layer.
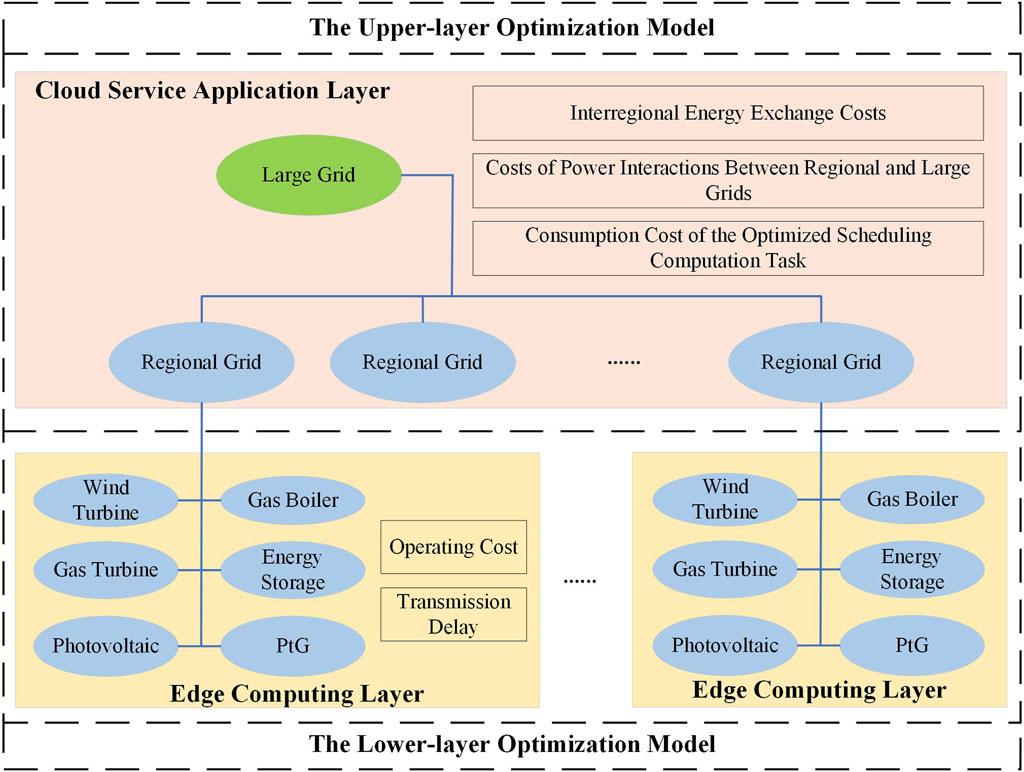
Figure 4. Double-layer optimization scheduling model of the regional multi-energy system.
The objective function of the upper-layer scheduling optimization model for the cloud service application layer can be described by Eq. 18:
where F1 is the overall operation and scheduling cost of the regional multi-energy system; Ce is the unit electric energy interaction price between the regional multi-energy system covered by different regional edge computing layer base stations and the large power grid; Pi,t is the interactive electric power between the regional multi-energy system covered by different regional edge computing layer base stations and the large power grid; Ceexchange, Cgexchange, and Chexchange are the unit exchange cost of electricity, natural gas, and heat energy in the area covered by the ith and jth regional edge computing layer base stations, respectively;
The objective function of the lower-layer scheduling optimization model for the edge computing layer can be described by Eq. 19:
where Ci,I,t is the operating cost of the Ith energy equipment in the area covered by the ith regional edge computing layer base station at time t; Pi,I,t is the electricity, heat energy or gas energy supply of the Ith energy equipment at time t.
In addition to the consideration of system operating costs, the regional multi-energy system to perform scheduling calculations is also required to consider the scheduling task transmission delay under the multi-node cloud-edge collaborative scheduling strategy, and minimize the data transmission delay of the scheduling optimization calculation process, which can be expressed by Eq. 20:
The supply balance constraints for electricity, gas, and heat in the regional multi-energy system can be described by Eq. 21
where Pi,Le,t, Pi,Lg,t, and Pi,Lh,t are the electricity, heat and gas loads in the area covered by the ith regional edge computing layer base station, respectively; I1 is the set of electricity energy equipment in the area covered by the ith regional edge computing layer base station, and I1 = {wind turbine, photovoltaic, and PtG equipment}; I2 is the set of natural gas energy equipment in the area covered by the ith regional edge computing layer base station, and I2 = {gas turbine, PtG equipment, and gas boiler}; Pei,j,t, Pgi,j,t, and Phi,j,t are the exchange power of electricity, natural gas, and heat energy between the areas covered by the ith and jth edge computing layer base station, respectively; Pci,e,t and Pdi,e,t, Pini,g,t and Pouti,g,t, Pini,h,t and Pout i,h,t are the charging and discharging power of the battery storage equipment, gas storage equipment and heat storage equipment at time t, respectively.
The operation constraints of multiple energy equipment in the regional multi-energy system can be described by Eq. 22
where
Data transmission constraints in the multi-node cloud-edge cooperative scheduling framework. The relevant equations can be found in Eqs 15–17.
The regional grid operations flow constraints can be described by Eq. 23
where
To achieve optimal computation and control of regional multi-energy system scheduling under the framework of edge computing and cloud-edge collaborative scheduling, this paper proposes a multi-objective whale optimization algorithm, which is used to solve the optimal scheduling scheme of the regional multi-energy system.
The whale optimization algorithm is a heuristic, single-objective optimization algorithm that simulates the feeding behavior of whale groups (Mirjalili and Lewis, 2016). It has the advantages of a simple algorithm structure, easy implementation, and high convergence speed and optimization accuracy. proposes a multi-objective whale optimization algorithm for solving regional multi-energy system scheduling schemes, based on a multi-objective algorithm framework with non-dominated as well as congestion ranking. The algorithm is divided into three phases: encircling prey, bubble net attack, and searching prey.
In the first phase, the whale gradually approaches the prey through an encirclement approach. Assuming that the current optimal solution is the target prey, the positions of other individuals in the group are moved to the position of the optimal solution, and updated as Eq. 24:
where X*(t) = {X1*,X2*,
where Rand is a random number between [0,1]; a is the convergence factor, which decreases linearly from 2 to 0 as the number of iterations increases, and is denoted as Eq. 26:
where Tmax is the maximum number of iterations.
There are two ways to describe the feeding behavior of whales: the shrinking encirclement mechanism and the spiral updating position.
a) Shrinking encirclement mechanism: It is realized by constantly encircling the prey by the value of the convergence factor a.
b) Spiral updating position: The algorithm first calculates the distance between the current individual and the optimal solution position. Then, it approaches the optimal solution position in a spiral manner. The mathematical model can be expressed as Eq. 27:
where W* is the distance between the current individual and the current optimal position; k is a constant coefficient to qualify the logarithmic spiral form; l is a random number between [0,1].
Both above methods have a certain probability to appear in the actual whale hunting process. Therefore, the algorithm sets the selection probability coefficient p for performing the shrink-wrap mechanism and the spiral position update, denoted as Eq. 28:
When |A|≥1, the whale searches away from the reference target to find a superior prey, denoted as Eq. 29:
where Xrand is the randomly selected position vector of the next prey.
In a multi-objective optimization problem with n objective functions Fi(x), i = 1, 2,
This paper proposes the idea of multi-objective particle swarm algorithm, which takes the global optimal solution as the target of bubble net attack, and the local optimal solution as the target of prey search. To achieve a local optimal solution, select the individual that dominates the current local optimal solution after moving positions. If the individual after moving position and the current local optimal solution do not dominate each other, randomly select both as the local optimal solution to ensure solution distribution and non-domination. The process of whale moving position fully uses the information obtained in the process of whale moving position, and the global optimal solution is selected according to the hierarchical analysis method, which ensures the effectiveness and objectivity of the global optimal solution selection process.
The distribution of the solution set of the algorithm uses the results of the crowding degree ranking in this paper as the standard for updating the solution set in the iterative process. The crowding degree is calculated using Eq. 31.
where Fmax and Fmin are the maximum and minimum values of the objective function, respectively; Fi-1 and Fi+1 are the values of the objective function of the previous individual and the next individual after the descending order ranking, respectively.
The algorithm uses the crowding degree, which can visualize the distribution of solutions. A larger crowding degree indicates a better distribution of solutions, while a smaller crowding degree indicates a worse distribution. Therefore, during the iteration process of updating the solution set, larger solutions can be filtered based on the size of the crowding degree, and smaller solutions can be eliminated to maintain diversity and distribution of solutions.
Figure 5 shows the solution process, and the specific steps are as follows:
(1) Initialize parameters, such as the output population size and iteration number, for each equipment in the regional multi-energy system. Randomly initializing the position of each individual in the output population, and initializing the local optimal value of each equipment in the regional multi-energy system.
(2) Calculate the objective function value for each individual in the initial population, which represents the output power of each device in the regional multi-energy system.
(3) Use the hierarchical analysis method to select the global optimal solution from the entire output population of equipment and guide the position of the equipment power output population in the desired direction.
(4) To update the position of each individual of the output population of each equipment in the multi-energy system, use Eqs 27, 28 based on the values of |A|, p and the judgment conditions.
(5) Update the local optimal solution in the power output population of each equipment in the multi-energy system using the optimal solution domination principle of Eqs 30, 31.
(6) Check if each individual in the equipment output population has been traversed. If not, go back to Step (4).
(7) Check if the maximum number of iterations has been reached or if the algorithm iteration has met the end condition. If yes, output the optimal scheduling result of the regional multi-energy system and end the algorithm. Otherwise, go back to Step (3).

Figure 5. Solving algorithm.
Using the model established in this paper, the historical operation data of new energy units and the historical load data of a regional power grid in Northeast China on a typical operation day are selected. The topology shown in Figure 2 is used to build a regional multi-energy system multi-node cloud-edge cooperative scheduling simulation model to optimize the scheduling.
The parameters of the electricity/heat/gas multi-energy system are shown in Table 1. Figures 6, 7 show the PV and wind power output and load data during the simulation.
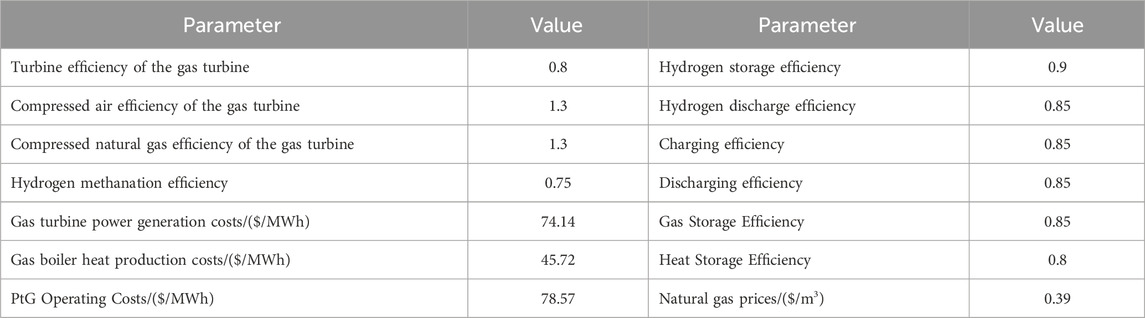
Table 1. Simulation parameters
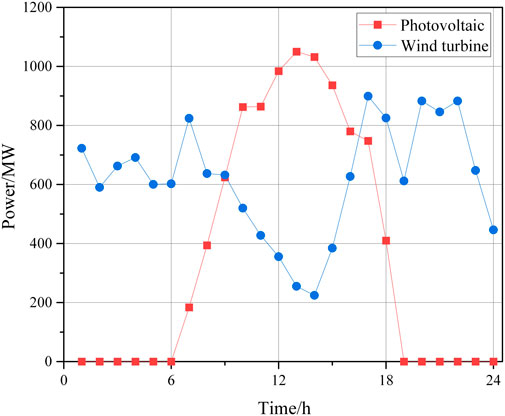
Figure 6. Photovoltaic and wind power output data.
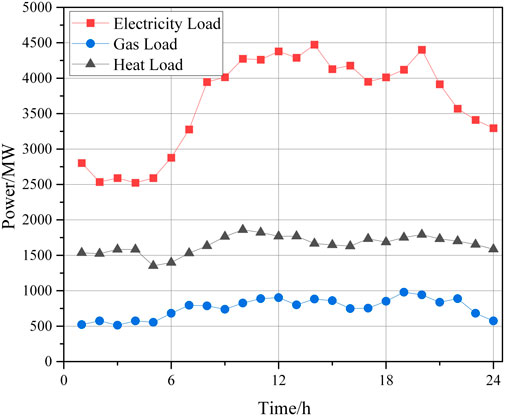
Figure 7. Load data.
The regional power grid is divided into NumM regions, and the equipment entity layer, state data perception layer, edge computing layer, data network communication layer, and cloud service application layer are set up according to the established multi-node cloud-edge collaborative scheduling model, respectively. In this paper, NumM is set to 4. An AMD R7 5800H, 16 GB computer is used for scheduling optimization of the regional multi-energy system.
The scheduling optimization result of the edge computing layer of the region 2 multi-energy system are given in Figures 8–10.
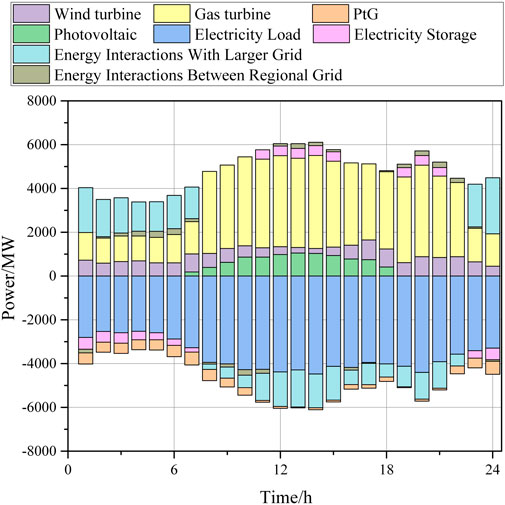
Figure 8. Electricity energy optimized scheduling results of Region 2.
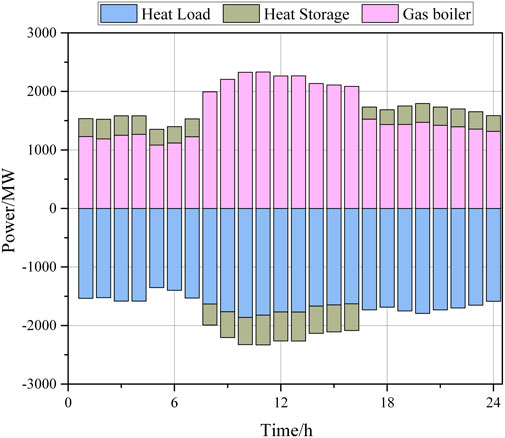
Figure 9. Heat energy optimized scheduling results of Region 2.
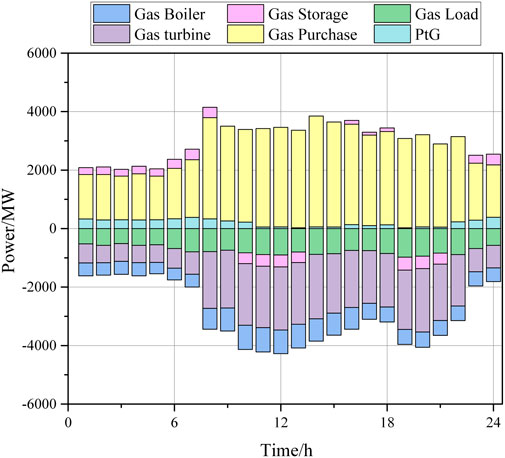
Figure 10. Gas energy optimized scheduling results of Region 2.
According to Figures, the wind turbine and photovoltaic equipment output is consistently high throughout each time, resulting in a higher utilization of new energy in the region. Other power generation equipment is adjusted based on changes in load demand to better meet load requirements. During nighttime hours, electricity prices are low. As a result, the regional grid chooses to purchase electricity from the grid more frequently. Battery storage equipment is charged during these hours to discharge energy during times of high demand. This reduces the operation and dispatching costs of the regional multi-energy system. When demand is high, battery storage equipment will be charged and used to discharge energy when the load is high. This will reduce the operation and scheduling costs of the regional multi-energy system. To meet the heat and gas load demand in the regional multi-energy system, the edge computing layer calculates the optimal heat and gas energy supply arrangement scheme based on the acquired equipment data and load demand data. It then adjusts the operation status of the corresponding energy equipment to meet the heat and gas load demand of users in the region when the load demand is high. Table 2 shows the results of the 24-h operation cost comparison for the regional multi-energy system.
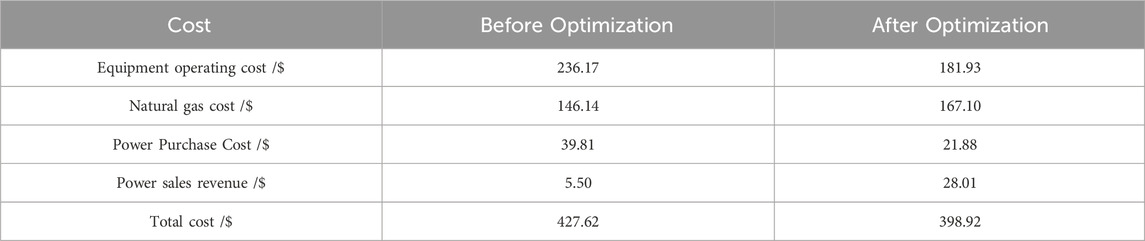
Table 2. Operating costs
Figure 11 gives the results of the electricity interaction between the region 2 multi-energy system and the other three regional multi-energy systems. The interaction of electric energy is mainly affected by changes in the output of new energy units and customer load demand.
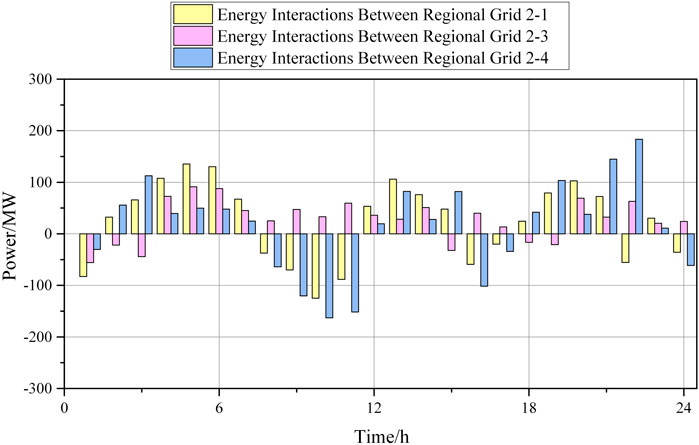
Figure 11. Optimized scheduling results of the electricity interaction.
This paper also explores the effectiveness of regional multi-energy system scheduling solution under two approaches: multi-node cloud-edge cooperative scheduling and centralized scheduling, and the results are shown in Table 3, Figure 12.
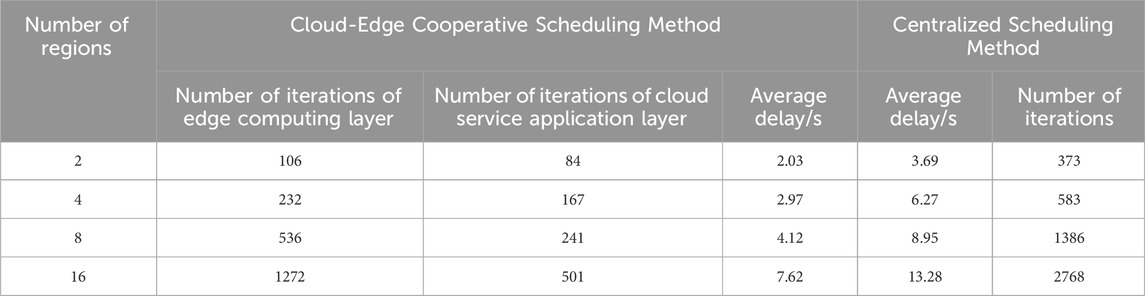
Table 3. Operating Costs Solution comparison of scheduling optimization task
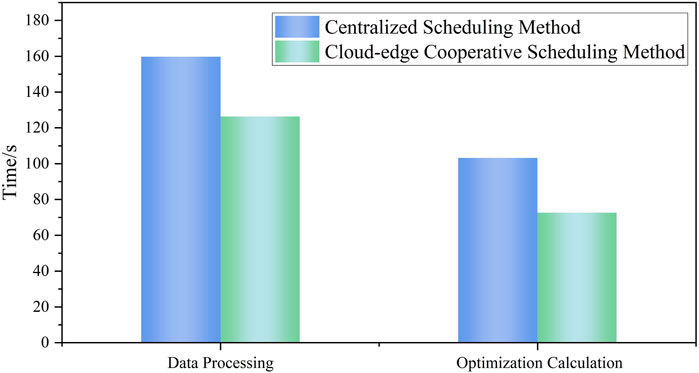
Figure 12. Comparison of data information processing and calculation time before and after optimization.
When the edge computing layer has not received the latest inter-regional energy interaction commands from the cloud service application layer, the edge computing layer can perform optimization calculations of energy equipment outputs within the regional multi-energy system by directly utilizing the operating state data and ledger data of each energy equipment in the equipment entity layer collected by the state data perception layer. At the same time, the amount of energy data and equipment operation data that need to be processed is smaller when each edge computing layer performs scheduling optimization calculation compared to centralized scheduling optimization. This reduction in data results in a decrease in the number of iterative calculations required for scheduling optimization solving using the multi-objective whale optimization algorithm. The corresponding results are shown in Table 3. Table 3 also shows the results of the number of iterations and average delay of scheduling optimization among regional multi-energy systems performed by the cloud service application layer. The number of iterations and delay are significantly lower than that of the centralized scheduling method.
The results of system operation data information processing and calculation time are shown in Figure 12. Compared to centralized scheduling method, cloud-edge cooperative scheduling technology improves the rate of data processing and calculation of the regional multi-energy system. The data processing time is reduced by 20.94%, and the optimization calculation time is reduced by 29.64%. This finding suggests that cloud-edge cooperative scheduling technology is a more efficient option for the regional multi-energy system.
Based on edge computing technology and cloud-edge cooperative control framework, this paper proposes a multi-node cloud-edge cooperative optimal scheduling strategy of the regional multi-energy system coordinated with multiple edge service layer base stations. The paper establishes a two-layer optimal scheduling model for regional multi-energy systems. The method is simulated and verified through analysis, and the conclusions are presented as follows:
(1) The use of the cloud edge cooperative scheduling technology for the perception, monitoring, and optimization of the regional multi-energy system can effectively improve the ability of data information processing and calculation of the multi-energy system. The time of data information processing is reduced by 20.94%, and the time of optimization calculation is reduced by 29.64%.
(2) The efficiency of scheduling and optimization of the regional multi-energy system has been improved by allocating the scheduling and optimization tasks of the whole system to the edge computing service layer, and then performing cooperative computation among the multiple edge service layer base stations to reduce the amount of data computation and processing for the execution of the optimization and scheduling tasks of the regional multi-energy system;
(3) Through the analysis of the scheduling optimization results of the regional multi-energy system, the double-layer optimal scheduling model of the regional multi-energy system established in this paper can increase the flexible adjustment ability of the system, and realize the economic operation of the multi-energy system.
The original contributions presented in the study are included in the article/Supplementary material, further inquiries can be directed to the corresponding author.
SL: Writing–original draft, Validation, Writing–review and editing. YT: Writing–original draft, Writing–review and editing. SC: Writing–original draft. NX: Writing–original draft. PS: Validation, Writing–original draft. KZ: Writing–review and editing. ZC: Writing–original draft, Writing–review and editing.
The author(s) declare that financial support was received for the research, authorship, and/or publication of this article. This work was supported by the National Key Research and Development Plan (No. 2017YFB0902100).
The authors declare that the research was conducted in the absence of any commercial or financial relationships that could be construed as a potential conflict of interest.
All claims expressed in this article are solely those of the authors and do not necessarily represent those of their affiliated organizations, or those of the publisher, the editors and the reviewers. Any product that may be evaluated in this article, or claim that may be made by its manufacturer, is not guaranteed or endorsed by the publisher.
Abir, S. M. A., Anwar, A., Choi, J. H., and Kayes, A. S. M. (2021). IoT-enabled smart energy grid: applications and challenges. IEEE ACCESS 9, 50961–50981. doi:10.1109/ACCESS.2021.3067331
Gao, J., Chang, R., Yang, Z., Huang, Q., Zhao, Y., and Wu, Y. (2023). A task offloading algorithm for cloud-edge collaborative system based on Lyapunov optimization. Clust. Computing-the J. Netw. Softw. Tools Appl. 26 (1), 337–348. doi:10.1007/s10586-022-03563-w
Gooi, H., Wang, T., and Tang, Y. (2023). Edge intelligence for smart grid: a survey on application potentials. CSEE J. Power Energy Syst. 9 (5), 1623–1640. doi:10.17775/CSEEJPES.2022.02210
Huang, B., Li, Y., Zhan, F., Sun, Q., and Zhang, H. (2022). A distributed robust economic dispatch strategy for integrated energy system considering cyber-attacks. IEEE Trans. Industrial Inf. 18 (2), 880–890. doi:10.1109/TII.2021.3077509
Ilic, M. D., Xie, L., Khan, U. A., and Moura, J. M. F. (2010). Modeling of future cyber-physical energy systems for distributed sensing and control. IEEE Trans. Syst. Man Cybern. - Part A Syst. Humans 40 (4), 825–838. doi:10.1109/TSMCA.2010.2048026
Li, Y., Li, T., Zhang, H., Xie, X., and Sun, Q. (2022). Distributed resilient double-gradient-descent based energy management strategy for multi-energy system under DoS attacks. IEEE Trans. Netw. Sci. Eng. 9 (4), 2301–2316. doi:10.1109/TNSE.2022.3162669
Li, Y., Ren, R., Wang, R., Sun, Q., Gao, D. W., et al. (2023). Distributed hybrid-triggering-based secure dispatch approach for smart grid against DoS attacks. IEEE Trans. Syst. Man, Cybern. Syst. 53 (6), 3574–3587. doi:10.1109/TSMC.2022.3228780
Li, Y., Zhang, H., Liang, X., and Huang, B. (2019). Event-triggered based distributed cooperative energy management for multienergy systems. IEEE Trans. Industrial Inf. 15 (14), 2008–2022. doi:10.1109/TII.2018.2862436
Liu, H., Zhang, Y., and Yang, T. (2018). Blockchain-enabled security in electric vehicles cloud and edge computing. IEEE Netw. 32 (3), 78–83. doi:10.1109/MNET.2018.1700344
Lo, C. H., and Ansari, N. (2013). Decentralized controls and communications for autonomous distribution networks in smart grid. IEEE Trans. Smart Grid 4 (1), 66–77. doi:10.1109/TSG.2012.2228282
Luo, P., Liang, J., Fan, H., Zeng, S., Yang, G., and Lin, J. (2022). Real-time distributed dispatch strategy for distribution transformer supply zone cluster based on cloud-edge collaboration architecture. Front. Energy Res. 10, 1019349. doi:10.3389/fenrg.2022.1019349
Mirjalili, S., and Lewis, A. (2016). The whale optimization algorithm. Adv. Eng. Softw. 95, 51–67. doi:10.1016/j.advengsoft.2016.01.008
Raeisi-Varzaneh, M., Dakkak, O., Habbal, A., and Kim, B. S. (2023). Resource scheduling in edge computing: architecture, taxonomy, open issues and future research directions. IEEE ACCESS 11, 25329–25350. doi:10.1109/ACCESS.2023.3256522
Ren, J., Wang, H., Hou, T., Zheng, S., and Tang, C. (2019). Federated learning-based computation offloading optimization in edge computing-supported internet of things. IEEE ACCESS 7, 69194–69201. doi:10.1109/ACCESS.2019.2919736
Si, Y., Tan, Y., and Wang, F. (2020). Cloud-edge collaborative structure model for power internet of things. Proc. Chin. Soc. Electr. Eng. 40 (24), 7973–7979. doi:10.13334/j.0258-8013.pcsee.191532
Su, X., Sperlì, G., Moscato, V., Picariello, A., Esposito, C., and Choi, C. (2019). An edge intelligence empowered recommender system enabling cultural heritage applications. IEEE Trans. Industrial Inf. 15 (7), 4266–4275. doi:10.1109/TII.2019.2908056
Sulieman, N. A., Celsi, L. R., Li, W., Zomaya, A., and Villari, M. (2022). Edge-oriented computing: a survey on research and use cases. ENERGIES 15 (2), 452. doi:10.3390/en15020452
Teng, Y., Liu, S., and Hui, Q. (2020). Integrated demand side response model considering collaborative optimization of regional multi-energy system clusters. Proc. Chin. Soc. Electr. Eng. 40 (22), 7282–7295. doi:10.13334/j.0258-8013.pcsee.191715
Teng, Y., Zhang, T., and Chen, Z. (2018). Review of operation optimization and control of multi-energy interconnection system based on microgrid. Renew. Energy 36 (03), 467–474. doi:10.13941/j.cnki.21-1469/tk.2018.03.022
Wang, A., and Li, J. (2022). A novel cloud-edge collaboration based short-term load forecasting method for smart grid. Front. Energy Res. 10, 977026. doi:10.3389/fenrg.2022.977026
Xia, X., He, C., Lv, Y., Zhang, B., Wang, S., Chen, C., et al. (2022). Power quality data compression and disturbances recognition based on deep CS-BiLSTM algorithm with cloud-edge collaboration. Front. Energy Res. 10. doi:10.3389/fenrg.2022.874351
Zhang, H., Li, Y., Gao, D. W., and Zhou, J. (2017). Distributed optimal energy management for energy internet. IEEE Trans. Industrial Inf. 13 (6), 3081–3097. doi:10.1109/TII.2017.2714199
Keywords: regional multi-energy system, edge computing, cloud-edge collaboration, physical perception, optimized scheduling
Citation: Liu S, Teng Y, Cheng S, Xu N, Sun P, Zhang K and Chen Z (2024) A cloud-edge cooperative scheduling model and its optimization method for regional multi-energy systems. Front. Energy Res. 12:1372612. doi: 10.3389/fenrg.2024.1372612
Received: 18 January 2024; Accepted: 28 February 2024;
Published: 28 March 2024.
Edited by:
Bonan Huang, Northeastern University, ChinaReviewed by:
Yuyang Zhou, Edinburgh Napier University, United KingdomCopyright © 2024 Liu, Teng, Cheng, Xu, Sun, Zhang and Chen. This is an open-access article distributed under the terms of the Creative Commons Attribution License (CC BY). The use, distribution or reproduction in other forums is permitted, provided the original author(s) and the copyright owner(s) are credited and that the original publication in this journal is cited, in accordance with accepted academic practice. No use, distribution or reproduction is permitted which does not comply with these terms.
*Correspondence: Yun Teng, dGVuZ3l1bkBzdXQuZWR1LmNu
Disclaimer: All claims expressed in this article are solely those of the authors and do not necessarily represent those of their affiliated organizations, or those of the publisher, the editors and the reviewers. Any product that may be evaluated in this article or claim that may be made by its manufacturer is not guaranteed or endorsed by the publisher.
Research integrity at Frontiers
Learn more about the work of our research integrity team to safeguard the quality of each article we publish.