 Xi Wang1,2
 Haocong Xie
 Siyang Liao
95% of researchers rate our articles as excellent or good
Learn more about the work of our research integrity team to safeguard the quality of each article we publish.
Find out more
ORIGINAL RESEARCH article
Front. Energy Res. , 15 March 2024
Sec. Sustainable Energy Systems
Volume 12 - 2024 | https://doi.org/10.3389/fenrg.2024.1370301
This article is part of the Research Topic Smart Energy System for Carbon Reduction and Energy Saving: Planning, Operation and Equipments View all 42 articles
With the introduction of a high proportion of new energy sources, the power system needs new means to enhance its regulating flexibility. High-energy-consuming industrial loads on the demand side have significant potential to improve the grid’s regulating flexibility. Unplanned power adjustments can affect normal load production. This paper proposes a power control strategy that considers the normal production order of loads, aiming to balance load response capacity requirements and safe production order. Taking copper electrolysis load as an example, based on the load process flow and the power characteristics of production equipment, factors affecting load production order and methods for calculating impact weights are analyzed, and a strategy to reduce the demand response to production order caused by power control is proposed. The effectiveness of the power control strategy is verified through simulation examples, providing a feasible solution for industrial loads to participate in demand-side response.
The intensification of the greenhouse effect has led to a series of global climate change issues. To effectively address the greenhouse effect and climate change, the use of renewable energy and the development of low-carbon technologies are considered effective approaches. Among them, the construction of a new power system with a high proportion of renewable energy is an effective way to accommodate renewable energy (Li et al., 2008). However, renewable energy sources have fluctuations and intermittency (Gwec, 2014; Poncelet et al., 2016; Shu et al., 2017), which can affect the frequency stability, safety, and power quality of the power system. Therefore, the introduction of a high proportion of renewable energy poses new requirements for the regulation flexibility of the power system. Enhancing the regulation flexibility of the power system can be approached from the power generation side, grid side, and demand side. On the power generation side, deep flexibility retrofitting of thermal power units can be carried out to enhance the regulation flexibility of the power system. However, during the deep peak shaving operation of thermal power units, the operating costs can significantly increase, and it can also lead to increased energy consumption and fuel pollution (Lin et al., 2017). On the grid side, deploying energy storage devices can enhance grid regulation flexibility. However, energy storage devices are limited by geographical conditions, cost considerations, safety issues, and technological aspects (Yang et al., 2014). Currently, they are still in the small-scale experimental stage and have not been widely applied on a large scale. On the demand side, balancing the electricity supply and demand can be achieved by reducing user loads. Currently, there are several challenges in the demand side, including small individual load capacities, difficulties in aggregation due to distributed nature, and insufficient willingness to participate in demand-side response for residential and commercial loads (Liu et al., 2015; Muhammad and Yan, 2018). However, high-energy-consuming industrial loads on the demand side have several advantages, such as larger individual load capacities, strong power controllability, and fast power response speed (Ding et al., 2014). In particular, energy-intensive loads like electrolysis loads possess characteristics like thermal energy storage, which offers significant potential for enhancing grid regulation flexibility (Samad and Kiliccote, 2012; Shoreh et al., 2016). In some regions, policies such as detailed guidelines for auxiliary service transactions aimed at encouraging load participation in demand-side response have been introduced. However, the current level of participation of high-energy-consuming industrial loads in demand-side response to enhance grid regulation flexibility is not high. The reasons for this are as follows: high-energy-consuming industrial loads lack effective means to control their own power, and they often have complex physical and chemical characteristics in their process flows. Unplanned control can disrupt the normal production sequence of loads and even affect load production safety. Under the support of demand-side response-related policies, there is a lack of load power control strategies to maximize the participation benefits of demand-side response.
Industrial load power control technology is crucial for the participation of high-energy-consuming industrial loads in demand-side response. In regards to power regulation of high-energy loads, a study mentioned in reference (US Department of Energy, 2012) proposes an orderly electricity consumption scheme. In situations where the grid’s power supply capacity is insufficient or during other emergency conditions, the study suggests temporarily shutting down some interruptible loads to alleviate the power supply constraints in the grid. Reference (Tu, 2018; Tu et al., 2018) focus on high-energy-consuming industrial loads in mineral smelting furnaces. They analyze the process flow and identify the main controllable electrical equipment. An electrical equivalent circuit model is established, and a voltage-impedance coordinated active power regulation method is proposed for the mineral smelting furnace. In another reference (Chen, 2018), the research focuses on high-energy-consuming industrial loads in polysilicon production. The study establishes the process characteristics and equivalent models of critical production stages. It utilizes the least squares method for online identification of polysilicon production parameters, and provides the active power regulation range and response time. In the direct load control using fuzzy logic proposed in reference (Bhattacharyya and Crow, 1996), user preferences are treated as variables to flexibly control load power (Liu and Pei, 2015). focuses on the main electrical production equipment in aluminum electrolysis industrial loads. Based on the thyristor-controlled current stabilization system and the wide-range power regulation characteristics of thyristors, a power grading control scheme is designed. Reference (Wang and Zhang, 2021) explores the coupling relationship between the production process stages and production resources in the steel industry load. It plans the production operations for different stages and proposes a scheduling model for participating in demand-side response to facilitate the integration of renewable energy. Reference (Jiang et al., 2014) proposes a power control method for grid impact considering industrial load characteristics under high penetration of renewable energy.
Electrolytic copper load is a typical high-energy-consuming industrial load with multiple complex process flows involving intricate physical and chemical reactions. The power control strategies for participating in demand-side response considering the production process still require further research. Addressing the aforementioned issues, this paper takes electrolytic copper load as an example of a high-energy-consuming industrial load with multiple process flows and proposes power control methods that consider its production process. The aim is to reduce the impact of its participation in demand-side response on its production sequence, incentivize its involvement in demand-side response, and enhance grid regulation flexibility. The main contributions of this paper are as follows:
1) Based on the process flow of electrolytic copper load, the characteristics of different stages in the process flow are analyzed. Power control methods are proposed according to the power characteristics of production equipment in different stages. This provides a model foundation for power control strategies that take into account the production sequence of the load.
2) Analyzing the key factors that influence the impact of power control on the normal production sequence of the load, quantifying the weights between different factors and the factors relative to the adjustable production equipment. This paper proposes a method for selecting the mode of participation in power control production equipment, with the aim of minimizing the impact on the production sequence while considering the factors mentioned above.
3) Based on the power control model of load-adjustable production equipment and the method for selecting production equipment to participate in power control, this paper considers the impact of power control on load production. It proposes a power control strategy that minimizes the impact on the production sequence of the load by considering the power control’s effect on load production.
The rest is organized as fellows: The second section introduces the process flow and power control model of electrolytic copper load. The third section discusses the impact of power control on the production sequence of the load. The fourth section presents power control strategies that consider the production sequence of the load. The fifth section provides a simulation case study.
This chapter mainly introduces the process flow of electrolytic copper load and the power control model of adjustable production equipment in the process stages.
Electrolytic copper load is a typical high-energy-consuming industrial load with multiple process flow stages. There are variations in the physical, chemical, and corresponding power characteristics of the main electrical production equipment across different process flow stages. Systematically describing the process flow characteristics of electrolytic copper load plays a crucial role in minimizing the impact of power control on the normal production sequence of the load.
The electrolytic copper process design involves complex physical and chemical reactions. The main production stages of the electrolytic copper industry load process can be divided into: raw material preparation, pyrometallurgical copper smelting, oxygen production, intensified smelting, electrolytic refining, and acid production. Other production stages are not considered at the moment. In the electrolytic copper load process, the raw material preparation stage provides raw materials, namely, copper ore and solvents, for subsequent production stages. The pyrometallurgical copper smelting stage consists of processes such as flash smelting, top-blown smelting, and anode furnace smelting. Flash smelting melts copper ore and solvents into blister copper, while top-blown smelting refines blister copper into crude copper. Anode furnace smelting refines crude copper into anode copper, which is then cast and sent to subsequent stages. The essence of the pyrometallurgical copper smelting process is to gradually oxidize copper ore and remove other impurities. The oxygen production stage provides oxygen for the pyrometallurgical copper smelting stage, while the intensified smelting stage accelerates the oxidation reaction of copper by providing air for the pyrometallurgical copper smelting stage. Both stages provide a certain proportion of oxygen-rich air to assist in the oxidation of copper ore in the pyrometallurgical copper smelting stage. The acid production stage absorbs the sulfur dioxide gas generated in the pyrometallurgical copper smelting stage and sends it to the acid production tower for sulfuric acid production. In the electrolytic refining stage, anode copper is electrolyzed in a certain temperature sulfuric copper solution to obtain cathode copper, and some precious metals can also be obtained in this stage.
The overall schematic diagram of the electrolytic copper load process flow is shown in Figure 1.
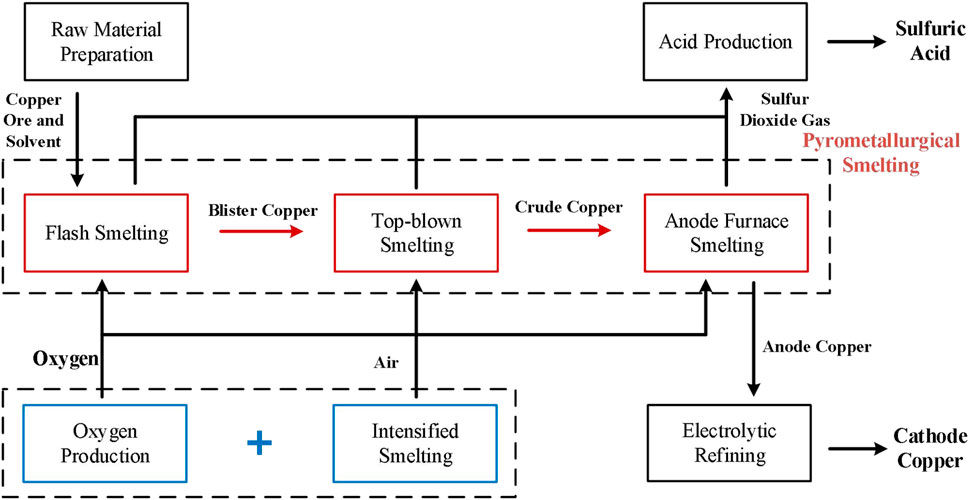
FIGURE 1. Electrolytic copper load process.
There are differences in characteristics between different process stages in electrolytic copper load. Power control in certain key production process stages may have a significant impact on the normal production sequence of the load. Therefore, it is necessary to analyze the feasibility of power control in different process stages.
For the raw material preparation stage: The main electrical production equipment in this stage is the conveyor belt driven by a variable frequency motor. Based on the power characteristics of the variable frequency motor, it can be determined that the active power consumed by the motor is directly proportional to its frequency. The specific relationship is illustrated in Eq. 1.
Where
From the above characteristics, it can be inferred that power control can be achieved by changing the frequency of the variable frequency motor in this stage. Additionally, reducing the power in this stage moderately for a short period of time will have a minimal impact on subsequent process stages. Therefore, it is considered feasible to adjust the power in this stage. However, when there is a significant change in the frequency of this stage, it may affect the material supply in subsequent process stages. Hence, there are control boundaries and constraints on the frequency of this stage, which can be illustrated as Eq. 2:
Where
For the pyrometallurgical smelting stage: This stage gradually oxidizes the copper ore into anode copper through three smelting processes. These stages have high temperature requirements inside the smelting furnace. Power adjustments have a significant impact on the normal production sequence of the load, and restoring the furnace temperature requires a large amount of coal consumption, which is not conducive to low-carbon production in industrial load operations.
Furthermore, considering the complex power characteristics of the three smelting processes, it is considered that the pyrometallurgical smelting stage does not have feasibility for power control.
For the oxygen production, intensified smelting, and acid production stages: The oxygen production stage separates oxygen from the air using an air compressor. The intensified smelting stage introduces air into the smelting furnace using a blower. The acid production stage uses a fan to draw the generated sulfur dioxide from the pyrometallurgical smelting stage into the acid tower for sulfuric acid production.
The common characteristic of these stages is that their active power consumption is related to the volume of gas. The effective cross-sectional area of the ventilation duct can be changed by adjusting the inlet vane angle, thereby altering the active power consumption in these stages. From the perspective of the effective cross-sectional area, rotating all the inlet vanes around the axis by a certain angle is equivalent to a single vane with an area equal to the cross-sectional area of the ventilation duct rotating around the axis. Therefore, the principle schematic diagram for calculating the effective cross-sectional area is illustrated in Figure 2.
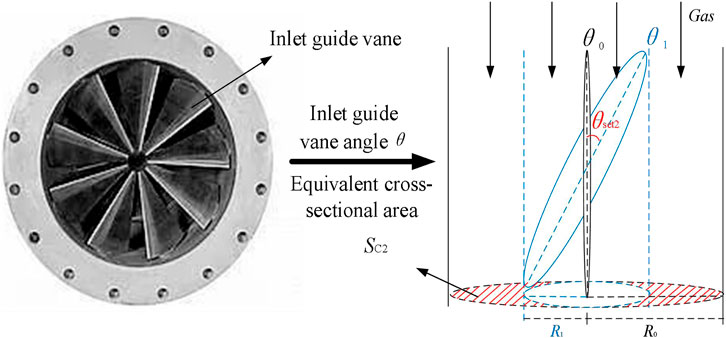
FIGURE 2. Schematic diagram of the effective cross-sectional area.
Based on the above characteristics of active power consumption in the aforementioned stages, it can be illustrated in Eqs 3–5.
Where
It can be concluded that adjusting the angle of the inlet vane can achieve power control in the aforementioned production stages. Therefore, it is considered feasible to adjust the power in these production stages. However, to avoid excessive adjustment of the inlet vane angle, which may result in insufficient oxygen concentration in the pyrometallurgical smelting stage or inadequate absorption of sulfur dioxide, there are control boundaries on the angle of rotation of the inlet vane. The constraints on the angle of rotation can be expressed as Eq. 6.
Where
The above is the power control model for the production equipment and the constraint conditions for key production parameters in the oxygen production, intensified smelting, and acid production stages. It should be noted that the model parameters and constraint conditions may vary for different production stages.
For the electrolytic refining stage: This stage involves the electrolytic refining of anode copper in a sulfuric acid copper solution at a certain temperature to obtain cathode copper at the cathode electrode. The electrolytic refining stage utilizes an electrolytic cell for the electrolysis of anode copper, and its equivalent circuit model is shown in Figure 3.
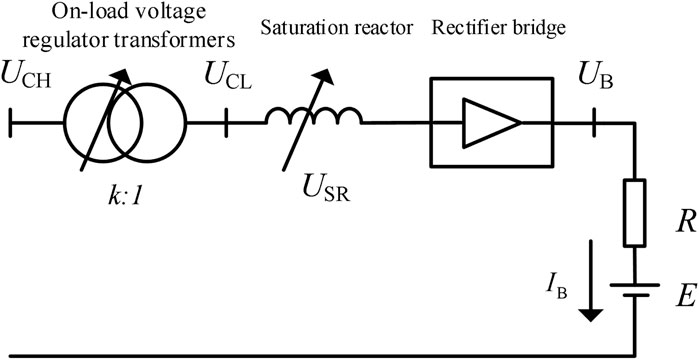
FIGURE 3. Equivalent circuit model of the electrolytic refining stage.
Where
Based on the equivalent circuit diagram, the active power consumption of the electrolytic refining stage can be expressed as Eqs 7, 8 (Jiang et al., 2014):
Where
From the above characteristics, it can be inferred that the active power consumption of the electrolytic refining stage can be changed by altering the voltage drop across the saturable reactor, thereby modifying the DC current in the process. The copper sulfate solution in the electrolytic cell has a significant thermal inertia, so short-term power control has minimal impact on the electrolytic environment. Therefore, it can be considered that the electrolytic refining stage has feasibility for power regulation. To avoid excessively low voltage drop across the saturable reactor, which may result in the loss of current stabilization or excessively high voltage drop leading to a low temperature of the electrolytic cell solution, there are control boundaries on the voltage drop across the saturable reactor. The constraints on the voltage drop can be expressed as Eq. 9:
Where
It is worth noting that the power control rates of the adjustable production equipment mentioned above are in the order of seconds, which can meet the requirements for industrial load participation in demand-side response.
When the electrolytic copper load participates in demand response on the power grid, it is necessary to decide which production stages will participate in power regulation. However, due to the differences in characteristics among production stages, the impact of power regulation on load production order may vary across different stages. To minimize the impact of power regulation on load production order, it is necessary to rank the impact of power regulation on production stages and calculate the weights of the influence on production. A higher weight indicates a greater impact of power regulation on production for that stage.
The impact of power regulation on the production of electrolytic copper load primarily depends on the following aspects:
A. Process flow correlation: The more production equipment is associated with the process flow, the more important it is for the load process flow. Therefore, the impact of power regulation on production order is greater. To assess the correlation level of production stages more accurately, the importance of the corresponding materials to the process flow should also be considered.
B. Production equipment capacity: If the capacity of the production equipment is larger, it will require more human resources to be invested in power regulation. Consequently, the impact on the normal production order of the load will be greater.
C. Power regulation cost: The additional cost incurred by production equipment during power regulation needs to be taken into account. If the cost of power regulation for the production equipment is too high, it can also affect the normal production of the load.
Generally speaking, the process flow correlation is relatively more important than the other two factors. The weight relationship for power regulation of electrolytic copper load is illustrated in Figure 4.
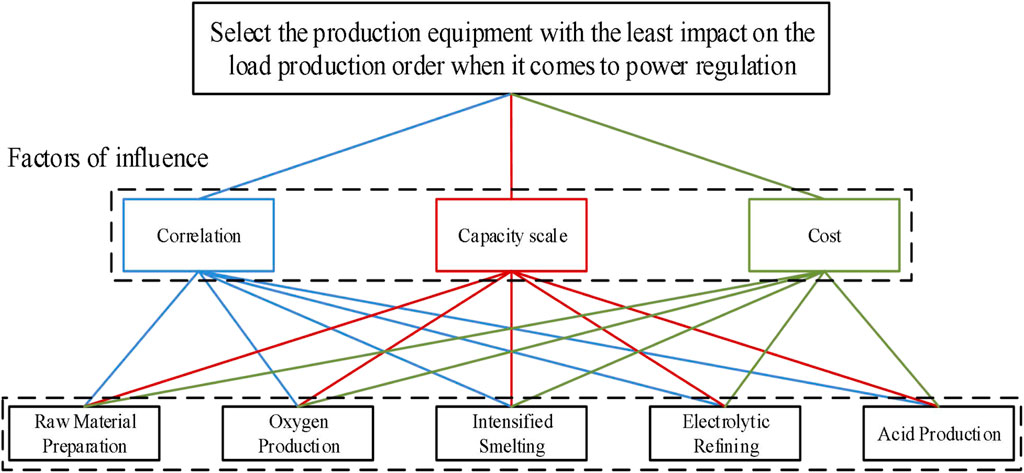
FIGURE 4. Power regulation weight calculation model.
It should be noted that there is a weight relationship among the three factors affecting the production of electrolytic copper load. Additionally, the impact of these factors on load production may vary among different electrolytic copper loads. This variation is due to the influence of the production characteristics of the electrolytic copper load itself. In other words, the weight of the aforementioned three influencing factors may differ on an individual basis for different electrolytic copper loads.
It should be noted that the above-considered factors apply to all production equipment for loads. The reason for considering these factors in this study is that actual industrial loads consider the impact of power control on load production order from the perspective of these factors when participating in demand response. However, it is still feasible to analyze the impact of power control on normal load production from other reasonable factors.
Assume that the weight matrix
There are differences in weights among the factors that affect the production of electrolytic copper load for different production equipment in various stages. To calculate the impact weight of the production equipment, a weight matrix needs to be constructed. The construction process is illustrated in Eqs 11–13
For degree of correlation:
For capacity scale:
For cost implications:
Where
Based on the above approach, the weight matrix of production equipment under different influencing factors can be calculated, denoted as matrix
Therefore, the overall weight matrix representing the influence of production equipment on load production can be expressed in Eq. 14.
Where the values represent the power regulation weight of each adjustable production equipment. A lower weight value indicates a lower impact on load production when performing power regulation in the corresponding production stage. Therefore, a higher priority is given to power regulation with lower weight values.
When electrolytic copper load participates in demand response on the power grid, it is necessary to decide which equipment will participate in power regulation based on the capacity requirements of the grid response and the characteristics of the load’s own production process stages. The objective is to meet the demand response requirements of the power grid while minimizing the impact of power regulation on the load’s production order. Therefore, the objective function can be illustrated in Eq. 15.
Where I represents the degree of impact of power regulation on normal load production,
When electrolytic copper load participates in demand response on the power grid, the power of the electrolytic copper load can be expressed in Eq. 17.
Where
When electrolytic copper load participates in demand response, if power regulation does not consider the power regulation boundaries of different production equipment, it can impact the normal production order of the load. Based on the aforementioned power control model for production equipment and the control boundaries of key production parameters, the constraint conditions for the power control strategy considering the production order of electrolytic copper load are as follows:
Considering that the key production parameters of different production equipment have control boundaries and that long-term load switching can affect the normal production order, it is limited to only one load switching within any adjacent four time periods. The constraint condition can be expressed in Eqs 18, 19
Where
Load participation in demand response is typically achieved by reducing its own load power during peak electricity consumption periods to alleviate the strain on electricity supply and demand. Therefore, the calculation method for the response capacity of load participation in demand response can be expressed in Eq. 20.
Where
Load participation in demand response generally has constraints on the contracted response capacity. If the response capacity of the load during the demand response period fails to meet the contracted response capacity requirement, response penalty costs will be incurred. In order to minimize response penalty costs, the load’s response capacity should meet the contracted response capacity requirement. The constraint conditions for load participation in demand response to satisfy the contracted response capacity requirement can be expressed in Eq. 21.
Where
Based on the aforementioned power control strategy considering the reference production order, the following section takes the participation of a specific electrolytic copper load in demand response as an example to verify the effectiveness of the proposed power control strategy.
The power and weight of the process stages in the simulation case study are shown in Table 1.
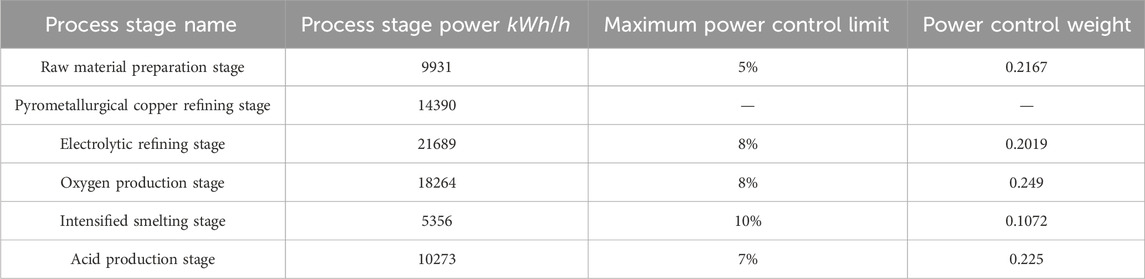
TABLE 1. The power and weight of the process stages in the case study.
The time period for the electrolytic copper load’s participation in demand response is from 3:00 p.m. to 8:00 p.m., and the contracted response capacities for each time period are as follows: 9840, 10160, 10210, 9920, and 9760
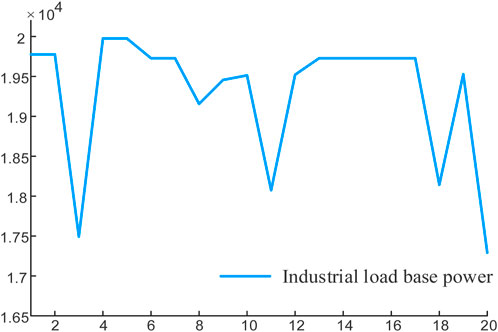
FIGURE 5. Industrial load base power.
It is worth noting that, due to the collaborative coordination of different production equipment in the normal production process of copper electrolysis, there are differences in the working states of different equipment at different times. Therefore, the baseline load still exhibits certain fluctuations.
When the aforementioned electrolytic copper load participates in demand response on the power grid using the proposed power control strategy that considers normal production order, the load power curve and response effect during the demand response period of the electrolytic copper load are shown in Figure 6.
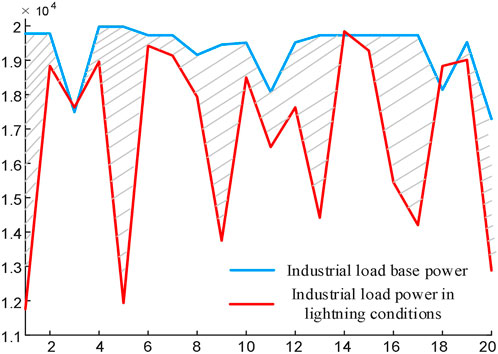
FIGURE 6. The load power curve during the response period.
The response effect of the load in different response periods is shown in Table 2.
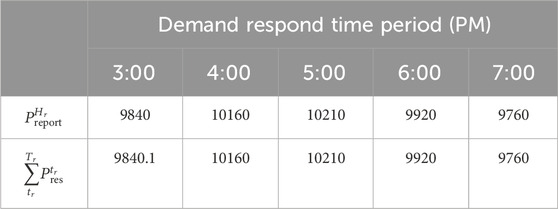
TABLE 2. Response effect.
From the above table, it can be seen that in different time periods when the electrolytic copper load participates in demand response, based on the power control strategy proposed in this paper, the load has responded according to the contracted response capacity of the power grid during the response period. This has met the demand for the contracted response capacity of the power grid, thereby avoiding the generation of response penalty costs.
During the demand response period in which the electrolytic copper load participates, the power curves and power control states of the adjustable equipment in the load are as shown in Figures 7, 8.
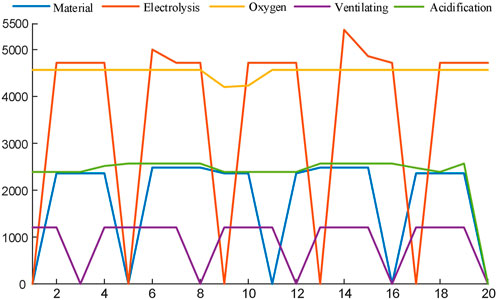
FIGURE 7. Power curve graphs of the production equipment in the electrolytic copper load during the demand response period.
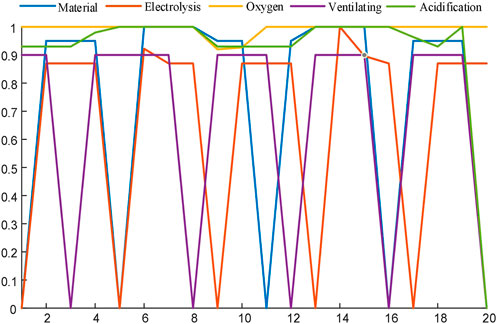
FIGURE 8. Power control state curves of the production equipment in the electrolytic copper load during the demand response period.
From the Figures 7, 8, it can be observed that during the demand response period in which the electrolytic copper load participates, the load has successfully responded according to the contracted response capacity. While adhering to the power control constraints of the production equipment in the electrolytic copper load, the load has undergone targeted power control based on the power control weight of each production equipment. This minimizes the impact of power control on the normal production of the load, thus validating the effectiveness of the proposed power control strategy in this paper.
This article addresses the issue of how the participation of high-energy industrial loads in demand-side response to the power grid can affect the production order of the load. Taking the typical multi-process high-energy industrial load of electrolytic copper as an example, a power control strategy that considers the normal production order of the load has been proposed. The power adjustment characteristics of different process stages of the electrolytic copper load provide a model basis for this power control strategy. Compared to conventional industrial loads that regulate power through on-off control, the power control model proposed in this article can continuously and discretely control power, thus more flexibly meeting power control requirements. Conventional industrial loads lack a basis for power control. This article analyzes the factors influencing the impact of power control on the production order of the electrolytic copper load, providing a more intuitive analysis of the impact of power control on normal load production. By calculating the weights of different production equipment participating in power control under the premise of minimizing the impact of power control on production order, the article can effectively reduce the impact of power control on normal load production. Based on the load power control model and the control boundaries of key production parameters, a power expression method for the electrolytic copper load is proposed. Under the premise of minimal impact on normal load production, optimization of the power control status of different process production equipment is carried out to meet the demand-side response capacity requirements of the electrolytic copper load. This provides a feasible and effective power control strategy for high-energy industrial loads to participate in demand-side response to the power grid.
The original contributions presented in the study are included in the article/supplementary material, further inquiries can be directed to the corresponding author.
XW: Writing–review and editing, Funding acquisition, Project administration, Writing–review and editing, Funding acquisition, Project administration, Writing–review and editing, Funding acquisition, Project administration. ZC: Writing–review and editing, Conceptualization, Methodology, Writing–review and editing, Conceptualization, Methodology, Writing–review and editing, Conceptualization, Methodology. HX: Writing–original draft, Formal Analysis, Methodology, Writing–original draft, Formal Analysis, Methodology, Writing–original draft, Formal Analysis, Methodology. SL: Writing–review and editing, Data curation, Investigation, Writing–review and editing, Data curation, Investigation, Writing–review and editing, Data curation, Investigation. XY: Writing–review and editing, Visualization, Writing–review and editing, Visualization, Writing–review and editing, Visualization. GC: Writing–review and editing, Software, Writing–review and editing, Software, Writing–review and editing, Software.
The author(s) declare that financial support was received for the research, authorship, and/or publication of this article. This work is supported by the State Grid Corporation of China’s technology project: Research and application of flexible load participation in grid regulation and safety control technology (521997230019).
Authors XW, ZC, GC were employed by the company State Grid Sichuan Electric Power Research Institute. Author XY was employed by State Grid Sichuan Electric Power Company.
The remaining authors declare that the research was conducted in the absence of any commercial or financial relationships that could be construed as a potential conflict of interest.
The authors declare that this study received funding from State Grid Corporation of China. The funder had the following involvement in the study: study design.
All claims expressed in this article are solely those of the authors and do not necessarily represent those of their affiliated organizations, or those of the publisher, the editors and the reviewers. Any product that may be evaluated in this article, or claim that may be made by its manufacturer, is not guaranteed or endorsed by the publisher.
Bhattacharyya, K., and Crow, M. L. (1996). A fuzzy logic based approach to direct load control. IEEE Trans Power Syst. 11 (2), 708–714. doi:10.1109/59.496143
Chen, Y. (2018). Research on frequency control strategy for high permeability wind power isolation grid based on polycrystalline silicon load control. Wuhan, China: Wuhan University.
Ding, Y., Min, S., Ho, H., and Xiao, H. (2014). A demand response energy management scheme for industrial facilities in smart grid. IEEE Trans. Industrial Inf. 10 (4), 2257–2269. doi:10.1109/tii.2014.2330995
GWEC (2014). Global wind report 2013-annual market update. https://www.gwec.net/wp-content/uploads/2014/04/GWEC-Global-Wind-Report_9-April-2014.pdf.
Jiang, H., Lin, J., Song, Y., Gao, W., Xu, Y., Shu, B., et al. (2014). “Demand side frequency control scheme in an isolated wind power system for industrial aluminum smelting production,” in 2014 IEEE PES General Meeting | Conference and Exposition, 1. doi:10.1109/PESGM.2014.6939145
Li, J., Wang, H., and Zhao, Q. (2008). Potential and prospects on new energy sources in China. Nat. Gas. Ind. 28 (1), 149–153. (in Chinese).
Lin, L., Zou, L., Zhou, P., and Xinyu, T. (2017). Multi perspective economic analysis of deep peak shaving of thermal power units under large-scale wind power grid connection conditions. Power Syst. Autom. 41 (07), 21–27. doi:10.7500/AEPS20160719005
Liu, L., and Pei, X. (2015). The method of participating in frequency regulation of electrolytic aluminum load in direct power supply system. Gansu Metall. 37 (05), 34–37+39.
Liu, M., Quilumba, F. L., and Lee, W. J. (2015). A collaborative design of aggregated residential appliances and renewable energy for demand response participation. IEEE Trans. Industry Appl. 51 (5), 3561–3569. doi:10.1109/tia.2015.2427286
Muhammad, H., and Yan, G. (2018). A review of demand response in an efficient smart grid environment. Electr. J. 31 (5), 55–63. doi:10.1016/j.tej.2018.06.003
Poncelet, K., Hoschle, H., Delarue, E., Virag, A., and Drhaeseleer, W. (2016). Selecting representative days for capturing the implications of integrating intermittent renewables in generation expansion planning problems. IEEE Trans. Power Syst. 32 (3), 1936–1948. doi:10.1109/tpwrs.2016.2596803
Samad, T., and Kiliccote, S. (2012). Smart grid technologies and applications for the industrial sector. Comput. Chem. Eng. 47, 76–84. doi:10.1016/j.compchemeng.2012.07.006
Shoreh, M. H., Siano, P., Shafie-Khah, M., Loia, V., and Catalão, J. P. S. (2016). A survey of industrial applications of demand Response. Electr. Power Syst. Res. 141, 31–49. doi:10.1016/j.epsr.2016.07.008
Shu, Y., Zhang, Z., Guo, J., and Zhang, Z. (2017). Study on key factors and solution of renewable energy accommodation. Proc. CSEE 37 (1), 1–8. doi:10.13334/j.0258-8013.pcsee.162555
Tu, X. (2018). Research on local area network frequency control in the steel industry based on load adjustment of mine heating stove. Wuhan, China: Wuhan University.
Tu, X., Xu, J., Liao, S., Liu, G., Feng, D., and Zhang, Y. (2018). Energy consumption behavior analysis and power characteristic modeling of steel industry load considering process control. Power Syst. Autom. 42 (02), 114–120. doi:10.7500/AEPS20170624001
US Department of Energy (2012). Benefits of demand response in electricity markets and recommendations for achieving them:a report to the United States Congress pursuant to section 1252 of the Energy PolicyAct of 2005. Washington, D.C.,USA: US Department of Energy.
Wang, H., and Zhang, L. (2021). A supply-demand interactive scheduling model considering the production process of short process steel enterprises. Power Syst. Autom. 45 (15), 64–76. doi:10.7500/AEPS20201002004
Keywords: industrial load, demand-side response, power control, control strategy, load power flexibility control
Citation: Wang X, Chen Z, Xie H, Liao S, Ye X and Chen G (2024) Demand-side response power control strategy considering load production sequence requirements. Front. Energy Res. 12:1370301. doi: 10.3389/fenrg.2024.1370301
Received: 14 January 2024; Accepted: 23 February 2024;
Published: 15 March 2024.
Edited by:
Zhengmao Li, Aalto University, FinlandReviewed by:
Suhan Zhang, Hong Kong Polytechnic University, Hong Kong SAR, ChinaCopyright © 2024 Wang, Chen, Xie, Liao, Ye and Chen. This is an open-access article distributed under the terms of the Creative Commons Attribution License (CC BY). The use, distribution or reproduction in other forums is permitted, provided the original author(s) and the copyright owner(s) are credited and that the original publication in this journal is cited, in accordance with accepted academic practice. No use, distribution or reproduction is permitted which does not comply with these terms.
*Correspondence: Haocong Xie, MTc1Mjk1OTMwMkBxcS5jb20=
Disclaimer: All claims expressed in this article are solely those of the authors and do not necessarily represent those of their affiliated organizations, or those of the publisher, the editors and the reviewers. Any product that may be evaluated in this article or claim that may be made by its manufacturer is not guaranteed or endorsed by the publisher.
Research integrity at Frontiers
Learn more about the work of our research integrity team to safeguard the quality of each article we publish.