 Tong Li
 Xiaoyu Zhang
 Hai Zhao
 Jiachen Xu
 Yiming Chang
 Shujun Yang
- 1School of Computer Science and Engineering, Northeastern University, Shenyang, China
- 2Electric Power Research Institute of State Grid Liaoning Electric Power Co., Ltd., Shenyang, China
- 3School of Information Science and Engineering, Northeastern University, Shenyang, China
- 4State Grid Liaoning Electric Power Supply Co., Ltd., Shenyang, China
In today’s digital age, multi-energy systems (MES) have become an indispensable part of the social infrastructure, providing people with diversified energy support such as electricity, gas, water and so on. However, with the increasing popularity and networking of MES, the network security threats they face are becoming more and more serious, especially the threat of network attacks. This makes it essential to detect attacks on MES and precisely classify attack types in order to establish effective defense strategies. In this paper, a Dual-Head output network attack detection and classification method based on parallel CNN-BiLSTM network is proposed. The method adopts a parallel structure and can process different aspects of information at the same time, speeding up the training and inference process of the whole network, making the system respond more quickly to potential network attacks, and improving real-time and efficiency. The multi-model fusion structure can give full play to the advantages of CNN and BiLSTM in processing different types of data, so that the system can capture attack characteristics more comprehensively in many aspects, and improve the overall detection and classification performance. The dual-head output not only improves the system’s ability to accurately detect attacks, but also can effectively classify different types of attacks in detail, which helps to formulate more targeted defense strategies. In addition, in order to effectively evaluate our proposed method, the network traffic data required for the experiment were collected in an environment very similar to the actual operating environment of a multi-energy system. Finally, the experiment verifies that our method can not only realize effective detection of network attacks, but also accurately classify different types of attacks.
1 Introduction
A multi-energy system is a comprehensive and integrated approach to energy management that embraces the coexistence and coordination of various energy carriers and sources within a unified framework (Li et al., 2020; Zhang et al., 2022). This innovative concept diverges from traditional single-energy systems by acknowledging the diversity of available energy forms and harnessing their synergies to optimize efficiency, enhance reliability, and foster sustainability (Li et al., 2019). But the increasing reliance on digital communication, smart grid technologies, and interconnected devices in these systems has made them susceptible to various forms of network attacks (Li et al., 2021; Li et al., 2022). These attacks pose serious risks to the stability and functionality of multi-energy infrastructures; the economic implications of a successful cyber attack on MES are substantial (Huang et al., 2022). In addition, with the integration of advanced technologies such as the Internet of Things (IoT) in MES, privacy and safety concerns emerge (Elmaghraby and Losavio, 2014). The main types of cyber attacks that affect MES include Port Scanning Attacks, Denial-of-Service (DoS) Attacks, and False Data Injection (FDI), among others. A port scanning attack is an attempt by an attacker to discover open network ports on a target system to identify services running on the system and potential vulnerabilities in preparation for subsequent attacks (Moubayed et al., 2019; Singh et al., 2021). DoS Attacks involve an attacker preventing normal users from accessing a system or service by overloading the system, blocking communication channels, or using other means (Li et al., 2023). DoS Attacks can lead to the stagnation of energy services, affect the stability and reliability of the system, and may even lead to widespread power outages (Li et al., 2022). FDI is a cybersecurity attack strategy where an adversary deliberately introduces inaccurate or deceptive information into a system. This manipulation of data aims to mislead the system’s decision-making processes, compromise its integrity, or deceive users relying on the authenticity of the data (Lu and Wu, 2022; Zhao et al., 2022). In response to these vulnerabilities, there is a pressing need to develop and implement effective network attack detection mechanisms tailored to the specific characteristics of MES. Research in this area is essential to safeguard the reliability, security, and resilience of multi-energy infrastructures, ensuring their continued contribution to a sustainable and interconnected energy landscape (Li et al., 2021).
In the realm of academic research, scholars have developed and evaluated various methods for detecting network attacks. These methods encompass diverse strategies aimed at identifying and mitigating cyber threats. The classification of these network attack detection methods can be outlined as follows: Rule-Based Detection methods, Statistical-Based Detection methods, and Machine Learning (ML) methods. Rule-based detection methods use predefined rules or specifications to identify abnormal or malicious activity in a network. These rules can include specific signatures, pattern matching, or specific attributes of network traffic. It is suitable for accurate identification of known attack patterns. For example, in (Birkinshaw et al., 2019), an intrusion detection system based on a software-defined network design was used to detect and prevent port scanning and DoS attacks in real-time. In (Egala et al., 2021), a decentralized selective ring-based access control mechanism was introduced along with device authentication and patient records anonymity algorithms to improve the healthcare system’s security capabilities (Liu et al., 2022). Constructed an attack model based on three typical attacks (the Stuxnet-like, DoS, and FDI) and detects anomalies by quantifying the dynamic variations of generalized models implied by operating data. In (Saad et al., 2020), a practical resilient control algorithm was developed to detect cyber attacks by authenticating every incoming update from the point of common coupling agent to guarantee the system’s security. In (Bhayo et al., 2022), a counter-based detection module reads the logs’ statistics continuously and determines whether the controller raises the alarm based on defined malicious activity parameters. Additionally, a Payload-Based detection module helps determine whether packets are sent by legitimate users or bots based on the payload size. However, these Rule-based detection methods are less effective against unknown attacks or variants and are not flexible enough to adapt to new threats. Statistical-based detection methods use statistical characteristics of network traffic or system behavior to identify anomalies. This can include statistical analysis of traffic patterns, frequencies, timestamps, etc. It can detect unknown attacks and has a certain adaptability to the changing attack forms. For instance (Kotenko et al., 2020), used fractal analysis and mathematical statistics to develop an approach for detecting cyber attacks against smart power supply networks by identifying anomalies in network traffic through assessing its self-similarity property (Ilha et al., 2021). Utilized information-theoretic and statistical analysis to accurately distinguish between normal and abnormal traffic patterns, classifying packets as either legitimate or malicious, thus realizing attack detection. In (Amma et al., 2020), a Class Scatter Ratio and Feature Distance Map (FDM) based statistical approach was proposed for detecting DoS attacks. The attack is detected by comparing the computed FDM of new traffic with normal and attack profile vectors (Velliangiri et al., 2023). Also used a statistical method based on FDM to identify DoS attacks. In (Çakmakçı et al., 2020), a DDoS detection scheme extracted four entropy-based and four statistical features from network flows as detection metrics. In (Wang et al., 2019), an interval state estimator based on Unscented Kalman Filter was used to quantify the normal fluctuation range of each state variable; any state that exceeds its normal fluctuation range is treated as an abnormal state. However, these statistics-based detection methods may produce a high false positive rate, requiring high complexity and variability of the network environment.
Rule-based detection methods and Statistics-based detection methods provide a basic, intuitive means of detection, while ML methods leverage algorithms to analyze and learn from network data, enabling the system to autonomously identify patterns associated with malicious activities. These techniques offer adaptive and dynamic detection capabilities to better adapt to unknown attack patterns and variants, helping enhance the system’s ability to recognize evolving cyber threat (Zhang et al., 2022). In (Li et al., 2021), extreme gradient boosting, light gradient boosting machine and extreme learning machine were separately designed as individual detectors for intrusion identification. In (Gorzałczany and Rudzinski, 2022), a data-mining/machine learning approach was adopted to address the intrusion detection problems in Internet of Things systems, this method used a multi-objective evolutionary optimization algorithm to optimize the tradeoff between accuracy and interpretability of the detection system. In (SaiSindhuTheja and Shyam, 2021), a detection system was proposed to detect DoS attacks, which integrated the Crow Search Algorithm and Opposition Based Learning method to select essential features, then classified using Recurrent Neural Network (RNN) classifier, this method can effectively improve the detection accuracy. In (Rashid et al., 2022), to address the two problems of over-fitting and higher complexity of model training caused by redundant features, Developed a tree-based stacking model for intrusion detection which considers the ranking of features based on a score and then creates a stacking model built on those features, and adopts the scaling of the input feature and model hyperparameter fine-tuning have been employed. In (Tang et al., 2020), a new LDoS attack detection method was proposed, Based on an analysis of network traffic, a network feature set was constructed for feature calculation and feature selection of network traffic data, and then the network traffic was classified by the Adaboost algorithm. In (Kravchik and Shabtai, 2022), this paper examined an attack detection method based on simple and lightweight neural networks, namely one-dimensional convolutional neural networks and autoencoders, these networks were applied to the time and frequency domains of the data, and the pros and cons of each representation approach were discussed. In (Zadsar et al., 2022), a multilayer perceptron (MLP) model was trained to detect FDI attacks against integrated power and gas systems. In (Martin et al., 2021), a self-supervised learning framework under a hierarchical model was used to train the encoding network, which is based entirely on a neural network, allows incremental training. In (Tian et al., 2020), two concurrent models of feature discriminator based on CNN and data discriminator based on FastText were developed, adding the results from the two discriminators in varying proportions for comprehensive decision result. In (Fard et al., 2021), the lower and upper estimation method based on the feedforward neural network model constructed optimal prediction interval with high confidence level surrounding the forecast target for malicious cyber attacks detection. In addition, compressing data, reducing data dimensions, and retaining only the most important features helps to reduce the storage space required, remove redundant information, and improve detection accuracy (Li et al., 2020; Li et al., 2021). So in the field of intrusion detection, more and more attention has been paid to data preprocessing methods of ML, such as PCA (Kravchik and Shabtai, 2022), Multi-Objective Evolutionary techniques (Mauro et al., 2021), the XGBoost-based feature selection method (Kasongo and Sun, 2020), combination of hash functions and embeddings (Martin et al., 2021), dimensional-reduction technology based on clustering (Li et al., 2022).
The aforementioned AI-based methods have yielded remarkable outcomes. However, there are two challenges. On the one hand, these AI-based methods (Tang et al., 2020; Tian et al., 2020; Fard et al., 2021; Li et al., 2021; Martin et al., 2021; SaiSindhuTheja and Shyam, 2021; Gorzałczany and Rudzinski, 2022; Kravchik and Shabtai, 2022; Rashid et al., 2022; Zadsar et al., 2022) mainly determined whether the network is attacked by extracting features from the data, but these methods either need to improve the extraction ability of data features, or the extraction of data features is too complicated, and the calculation cost and calculation time consumption of the model are too large. To address this issue, a potential approach, inspired by (Tang et al., 2022; Zhang et al., 2023) [43], was to utilize parallel CNN-BiLSTM model, which can simultaneously extract and integrate data features, provide efficient model representations, and take full advantage of the power of parallel computing, Significantly improve computing efficiency. On the other hand, the above methods (Birkinshaw et al., 2019; Wang et al., 2019; Amma et al., 2020; Kotenko et al., 2020; Saad et al., 2020; Tang et al., 2020; Tian et al., 2020; Çakmakçı et al., 2020; Egala et al., 2021; Fard et al., 2021; Ilha et al., 2021; Li et al., 2021; Martin et al., 2021; SaiSindhuTheja and Shyam, 2021; Bhayo et al., 2022; Gorzałczany and Rudzinski, 2022; Kravchik and Shabtai, 2022; Liu et al., 2022; Rashid et al., 2022; Zadsar et al., 2022; Velliangiri et al., 2023) can only detect one type of network attack, while the actual multi-energy system’s network attack situation is very complex, and it is likely to be subjected to more than one type of attack. Accurate detection of network attacks and accurate judgment of attack types are essential for taking appropriate response measures, such as optimizing resource allocation and making it more targeted, so as to improve the overall security of the network. Therefore, it is necessary to classify the detected attack types, and the design of Dual-Head Output models is an effective solution.
To tackle those challenges, the paper proposes a Dual-Head Output network attack detection method that can extract data features in parallel. The main contributions are as follows:
1) We introduce parallel CNN and BiLSTM into the network attack detection method, and make use of their different working principles to extract features from data from different angles, make full use of the potential information of the data, and achieve accurate network attack detection.
2) By using the Dual-Head Output network structure, we upgrade the network attack detection model from single attack detection to accurately identify and classify multiple network attacks.
3) We simulate the normal state and the attacked state of the information network of the multi-energy system on a data acquisition system which is very similar to the real multi-energy system, and collect the network traffic data required by the experiment, which improves the reliability of the experimental results.
4) The network attack detection method proposed in this paper has been verified by experiments, which proves that it can realize accurate classification of network attack types while accurately detecting network attacks.
The remainder is summarized as follows. Section 1 introduces the Dual-Head Output network attack detection method which can extract data features in parallel in detail. Section 3 introduces the data acquisition scheme of the attack detection experiment. Section 4 presents simulations to evaluate the performance of the proposed method. Finally, Section 5 concludes the paper.
2 Network attack detection method
In order to realize effective identification of network attacks and accurate classification of the types of attacks encountered by the network, we proposed a Dual-Head Output attack detection method based on parallel CNN-BiLSTM. The main process of the method is shown in Figure 1, including data preprocessing, time-frequency domain transformation of data based on Mixed-Radix Fast Fourier transform algorithm (Mixed-Radix FFT), data dimension reduction based on PCA and Dual-Head Output attack detection model based on parallel CNN-BiLSTM.
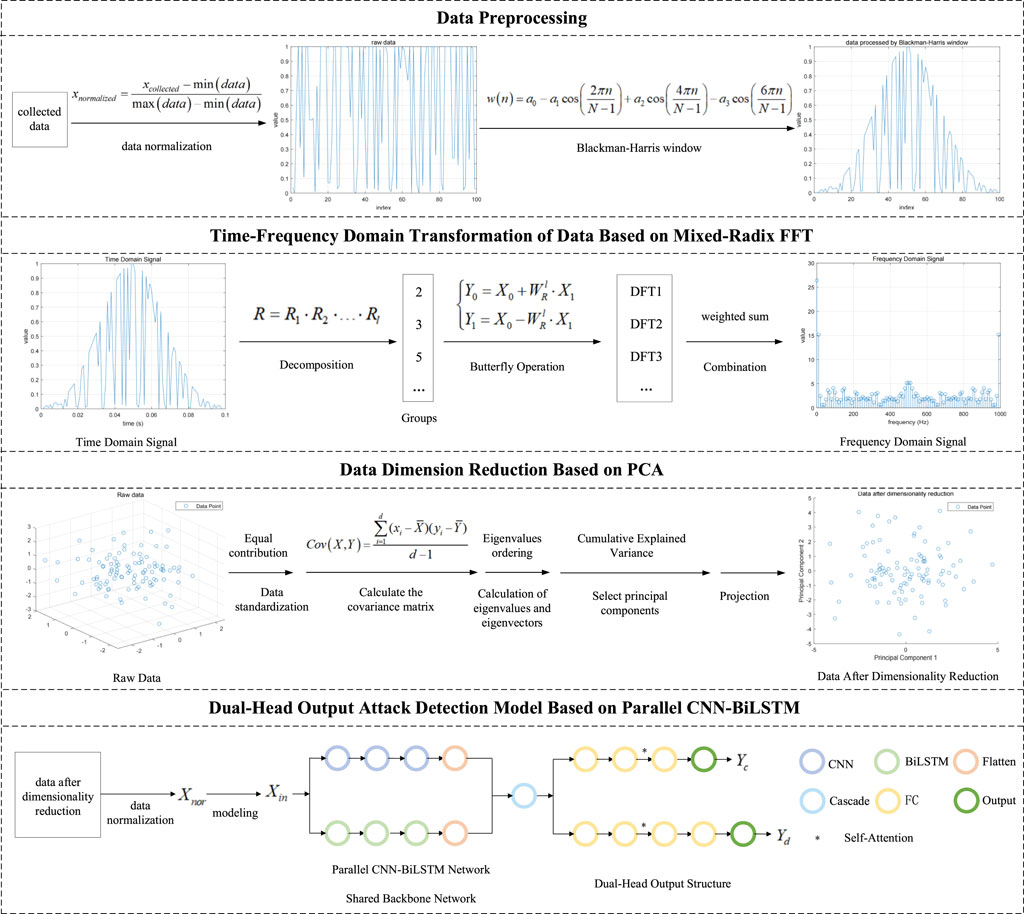
Figure 1. The main process of our approach.
2.1 Data preprocessing
Before converting time domain signals into frequency domain signals, some data preprocessing steps are usually required to ensure accurate and meaningful frequency domain representations, which mainly include data normalization and Blackman-Harris window.
1) Data normalization: The data normalization of the time domain signal can ensure that the amplitude of the signal is within a reasonable range and avoid the numerical stability problems caused by too large or too small signal amplitude. In this paper, the Min-Max normalization method as Formula (1) is adopted, which scales the data to a specified range by linear transformation.
where
2) Window function is a technique often used in signal processing to reduce the amplitude at both ends of the signal and avoid introducing unnecessary leaks in the frequency domain. Compared with other window functions, although the computational complexity of Blackman-Harris window may be higher, it works well in reducing spectral leakage and helps to improve spectral accuracy.
After data normalization, the Blackman-Harris window function is applied to the time-domain signal, which is equivalent to introducing a window in the time-domain signal to reduce the discontinuity of the signal at the window boundary, thereby reducing spectrum leakage and improving the accuracy of spectrum analysis. The steps usually involve point-by-point multiplication, that is, multiplying each sample of the signal with the corresponding sample of the window function.
The general form of a Blackman-Harris window is as Formula (2) is adopted:
where
Suppose there is a time domain signal
where
2.2 Time-frequency domain transformation of data based on Mixed-Radix FFT
The conversion of the time-domain signal to the frequency-domain representation helps to better understand the frequency component of the signal. Frequency domain analysis has several advantages: First, it provides a more compact representation of the main signal components. Second, it allows the detection of attacks that change the frequency of the usual operating pattern. Finally, attacks that typically evade existing time-domain detection methods are more easily detected in frequency-domain analysis.
Compared with other methods that convert time domain signals into frequency domain signals, Mixed-Radix FFT is a flexible and efficient discrete Fourier transform (DFT) calculation method. By decomgenerating the length of DFT into the product of different prime factors, Mixed-Radix FFT can make more effective use of computing resources, reduce computing complexity and improve computing efficiency, this makes it potentially more advantageous in real-time applications, especially for cases where fast calculations are required, and in addition, the Mixed-Radix FFT can handle transformations of multiple lengths and is not limited to dealing with DFT whose length is a power of 2, so it is more flexible.
The basic formula of DFT is to transform the time domain signal into the frequency domain signal by Fourier transform of the signal sequence. The DFT formula is as Formula (4):
where
The idea of Mixed-Radix FFT is to divide the calculation task of DFT into smaller subtasks to reduce the complexity of calculation, and it realizes the DFT calculation of the whole signal by recursively applying decomposition and Butterfly Operation. The key steps of the algorithm include:
Decomposition: Decomposition of a DFT of length
Groups: The calculation of the DFT is broken down into multiple small-scale DFT calculations. Each small DFT length is one of the prime factors obtained by decomposition. A set of radix is selected, usually 2, 3, and 5 are selected as radix, so that
Butterfly Operation: Each small DFT is calculated using the butterfly operation. The butterfly operation involves multiplying and adding complex numbers, and its specific form depends on the length
where
Combination: The results of all small-scale DFT calculations are combined to get the final DFT result. This usually involves an appropriate weighted sum.
2.3 Data dimension reduction based on PCA
Before the data is input into the machine learning model, PCA is used to reduce the dimension of the data set, which can remove redundant information in the data, retain the most important information in the data set, and reduce the training time of the model, high-dimensional data sets are usually accompanied by more computing overhead, and through dimensionality reduction, the training process of the model can be accelerated. Overall, PCA can help simplify data, improve model performance, reduce computational costs, and provide better interpretability. In addition, PCA assumes that the main information of the data is concentrated in the direction of large variance, and can better play its advantages of reducing the data dimension and extracting the main information when processing the data with strong linear correlation. The process of converting the time domain signal to the frequency domain signal is usually achieved through the FFT, which is linear, so the obtained frequency domain signal can be considered as the data of linear structure. The basic steps of PCA are as follows:
Data standardization: The data is standardized to ensure that each feature contributes equally to the principal component.
Calculate the covariance matrix: Calculate the covariance matrix of the normalized data. The covariance matrix reflects the correlation between different features as Formula (7).
where,
Calculation of eigenvalues and eigenvectors: The eigenvalue decomposition of covariance matrix is carried out to obtain the eigenvalues and corresponding eigenvectors. The eigenvalue of the covariance matrix represents the variance of the data in the direction of the corresponding eigenvector. The eigenvectors represent these directions. The idea of PCA is to select the eigenvector corresponding to the maximum eigenvalue, that is, to select the direction that can maintain the variance of the original data to the greatest extent.
Select principal components: The eigenvalues are arranged in order from largest to smallest, and the eigenvector with the largest first
Projection: The original data is projected onto the selected principal component to obtain a reduced data set.
2.4 Dual-head output attack detection model based on parallel CNN-BiLSTM
In order to capture the potential relationship between different network traffic data and the frequency dependency in the data, and realize efficient detection of network attacks and accurate classification of network attack types, we proposed a Dual-Head Output model based on parallel CNN-BiLSTM, as shown in Figure 2. The parallel CNN-BiLSTM network, as a shared backbone network of multi-head output structures, can simultaneously process different parts of the input data and make full use of the capability of parallel computation, which significantly improves the computational efficiency and speeds up the model training and reasoning process. In addition, the parallel CNN and BiLSTM layers help to extract and integrate data features simultaneously, which allows us to capture information related to various aspects of the data and provide efficient model representations that improve prediction accuracy. Specifically, the CNN component is used to extract inherent features between different data types within a certain number of frequencies. At the same time, BiLSTM captures deeper frequency features by considering information in both “forward” and “backward” directions. The parallel architecture of CNN and BiLSTM allows the independent extraction of inherent features from various data types and then concatenation of these features into a final feature vector. The specially designed Dual-Head Output structure shares the underlying feature representation extracted from the input data by the parallel CNN-BiLSTM network, which helps to improve the efficiency and generalization performance of the model, and can accurately classify the types of network attacks while realizing the detection of network attacks. In order to improve the accuracy of the model for attack detection and type classification at the same time, it is necessary to customize the degree of attention for different tasks. We introduce a Self-Attention Mechanism in the middle layer of the two output headers respectively. The Self-Attention Mechanism is suitable for the task interested in the relationship between the elements in the input sequence, and can capture the global dependency. The middle layer usually contains more information and abstract features, and the Self-Attention Mechanism can flexibly and dynamically focus on the task-related part of the feature vector output from the backbone network, which can effectively improve the performance of the model on different tasks.
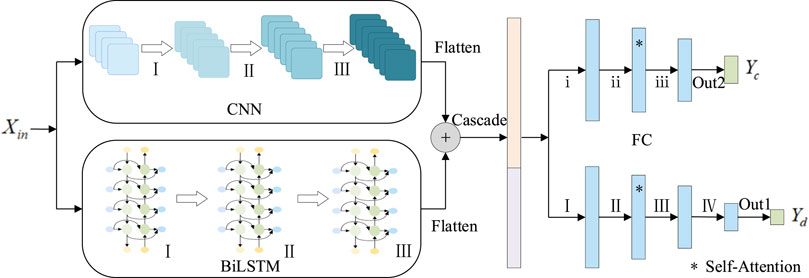
Figure 2. The dual-head output model based on parallel CNN-BiLSTM.
Remark 1. Multi-head output networks refer to neural network architectures that incorporate multiple output heads, each dedicated to a specific task or objective. Multi-task learning involves training a single model to perform multiple tasks concurrently. The key distinction lies in their architectural design and training strategies. Multi-head Output Networks adopts a modularized structure where each task corresponds to its own output head. During training, the model optimizes the losses from all output heads jointly. This modular design is advantageous when tasks are independent or exhibit significant differences, as it allows for task-specific fine-tuning without compromising the shared foundation. In contrast, multi-task learning takes a holistic approach by jointly training the model on all tasks. The model optimizes a joint objective that encompasses all tasks, promoting the discovery of shared representations. This holistic approach is particularly effective when tasks are interrelated or share underlying structures, fostering a collaborative learning process that benefits multiple objectives simultaneously.
In order to improve the convergence speed of the neural network, reduce the sensitivity to the input feature scale, and improve the generalization ability of the model. When using a deep learning model, the data whose dimensionality has been reduced by PCA needs to be normalized again to ensure that the model can learn and adapt better. The detailed operations were shown in Formula 1.
The normalized data
where
Suppose that samples with a batch size of
where
We set a hyperparameter

Figure 3. The above determination process.
3 Data acquisition scheme
In order to realize effective evaluation of our proposed attack detection and classification algorithm, normal traffic data and abnormal traffic data are collected successively in an environment very similar to the actual operating environment of the multi-power system. In Section 3.1, we describe the data acquisition environment. Section 3.2 describes the three attack scenarios used in the experiment and the attack tools used in each scenario.
3.1 Data acquisition environment
The data acquisition environment is shown in Figure 4, is composed of two parts, the physical topology and the communication topology, which ensure the two-way transmission of energy and information respectively (Ren et al., 2023; Teng et al., 2023). The physical topology consists of 17 units. It includes three energy carriers of electricity, gas and heat, four energy loads of electricity load, gas load, heat load and colding load, three energy storage devices of electricity storage, heat storage and gas storage, four energy conversion devices of electrical refrigerant, electrical boiler, CHP and refrigerating machine, but also through photovoltaic panels and solar water heaters to use the renewable energy of solar energy, in addition, the voltage is also changed by transformers.
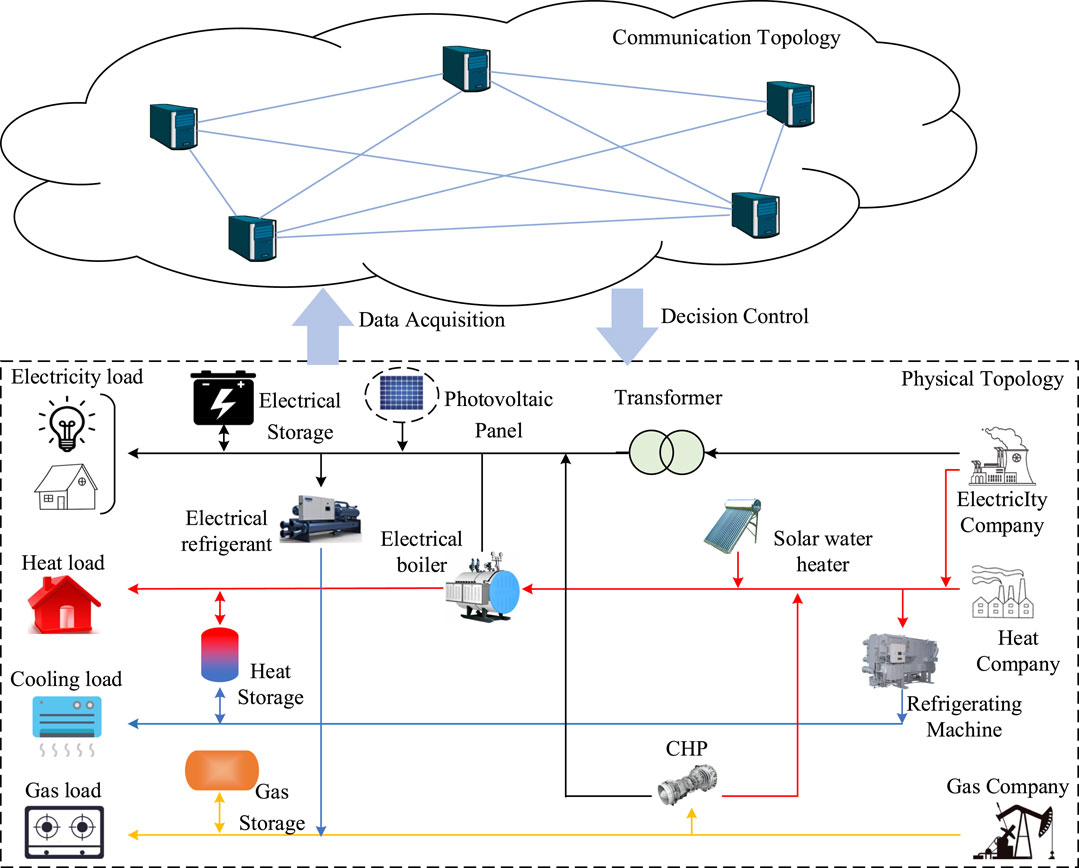
Figure 4. Data acquisition environment.
In the multi-energy system network, the collection of network traffic data mainly involves the equipment and protocol related to network traffic. Multi-energy system communication protocols include Message Queuing Telemetry Transport (MQTT), Constrained Application Protocol (CoAP), OPC Unified Architecture (OPC UA), and Distributed Network Protocol 3 (DNP3). The main communication protocol related to network security is NetFlow, which is used for network traffic monitoring and analysis. In the data collection process of this article, we used a Netflow-enabled switch (HUAWEI-LSS7G48TX6E0), a hardware device that generates NetFlow data and provides detailed information about network traffic. Network traffic data is collected using Switched Port Analyzer (SPAN), which is a local traffic mirroring technology usually provided by a switch. With SPAN, we can select multiple source ports and then copy all traffic on those ports to a destination port dedicated to monitoring. This allows us to get all the data flows through the source port.
To collect normal and abnormal traffic, we configure mirroring on four Netflow-enabled switches and prepare four computers to receive the mirrored traffic. Configure SPAN on the logged in switch, connect the computer’s network adapter to the destination port configured with SPAN, and then use Wireshark to extract traffic from each network. Because normal traffic and attack traffic are often mixed together in real networks, in order to better simulate the real environment, it helps the model better learn to work in the real environment. For normal traffic data and attack traffic data, we do not collect them separately, but collect them successively, and label the collected data to make it clear whether each sample is normal traffic or attack traffic, so as to facilitate subsequent model training and evaluation. It is important to note that we only conduct one type of cyber attack at a time, that is, the attack traffic data we collect contains information about only one type of cyber attack, not a mixture of attacks.
3.2 Attack scenarios
In this study, we choose to generate and collect network traffic data involving common port scanning attack, DoS attack and FDI attack. When the attack data needs to be collected, the attack traffic can be generated by connecting the attack host to the data collection environment. The information on attack traffic is summarized in Table 1.
1) For port scanning attack, we chose the easy-to-use nessus with automated scanning and rules engine and the open source NMAP with multi-platform support, the attack types include SYN Scan, UDP Scan, XMAS Scan, and ACK Scan.
2) For DoS attack, we chose the open source LOIC and the powerful Hping3, the Attack types include HTTP Flood Attack and UDP Flood Attack.
3) For FDI attack, we chose the widely used SQL Map and the fast and effective BSQL Hacker, types of attack include tampering with readings from metering devices or sensors and false energy storage data injection.
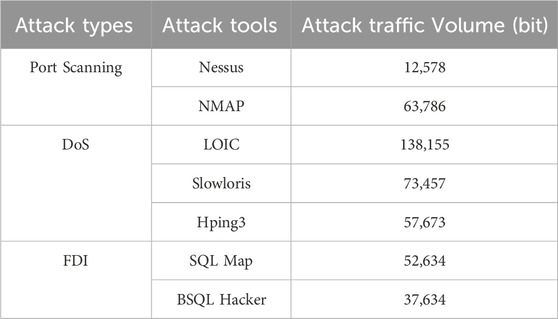
Table 1. The information on attack traffic.
4 Simulations
In this section, we design simulation experiments to verify the effectiveness of the proposed method, Figure 5 describes the overall flow chart of the experiment in this paper. In Section 4.1, the preparation work and specific details of the experiment are introduced, including dataset, hyperparameters determination, network parameters and performance evaluation metrics. Section 4.2 evaluates the performance of the proposed method through the experimental results of the test set, including the statistics and description of the experimental results, the comparison with the detection results of several baselines, and the analysis of the attack type classification results. In Section 4.3, an ablation analysis was designed to evaluate the function and performance of the method by purposefully removing a portion of the substructure, and the indispensability of each substructure in the method was validated.
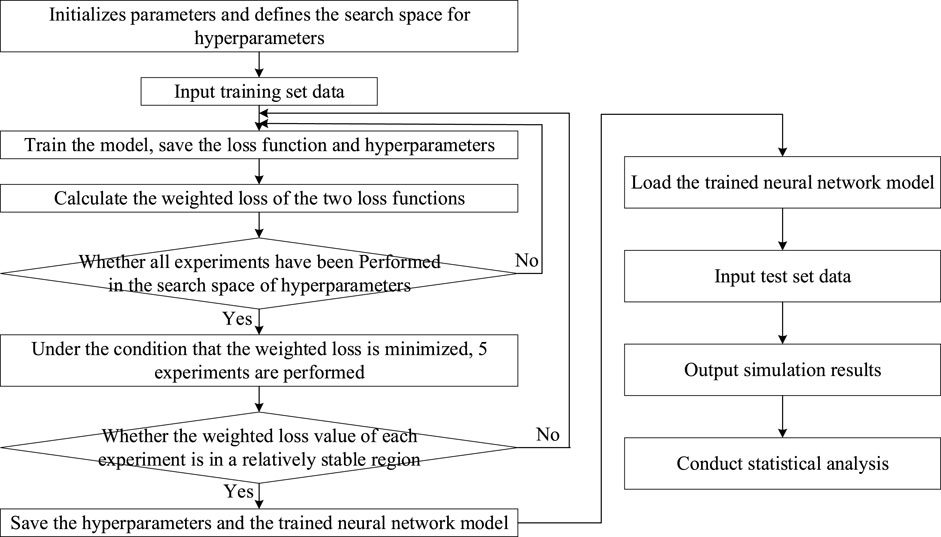
Figure 5. Overall flow chart of the experiment.
The calculation formula of the weighted loss involved in the figure is as Formula (16):
where
4.1 Preparation
4.1.1 Dataset
The data set was collected in a small experimental environment very similar to the actual operating environment of a multi-energy system. In order to ensure data quality, we clean the collected data to remove abnormal or inconsistent samples. The final retained data set contains about 3 to 1 normal traffic data and abnormal traffic data, and the ratio of Port scanning attack, DoS attack and FDI attack is about 5–18 to 6. Specifically, it includes data from 460,000 samples at a sampling frequency of 1300 Hz, 64 data features, For example, dst_port_count, num_failed_logins, num_connections, src_bytes, src_IP, num_shells, src_BPS_17, and num_root. Non-numeric features are converted to numeric values by label encoding. The data set was divided into training samples and test samples in a ratio of 4 to 1.
4.1.2 Performance evaluation metrics
In network attack detection, the confusion matrix and its derived metrics are crucial for assessing the performance of the model in detecting attack traffic and normal traffic. Table 2 is a confusion matrix for a binary classification problem, where rows represent the actual categories, and columns represent the predicted categories. In this matrix, TP denotes the number of instances where the model correctly classified positive samples as positive, FP represents the number of instances where the model incorrectly classified negative samples as positive, TN represents the number of instances where the model correctly classified negative samples as negative, and FN represents the number of instances where the model incorrectly classified positive samples as negative.
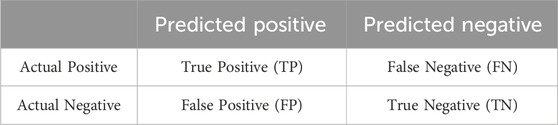
Table 2. Confusion matrix.
Based on the confusion matrix, several performance metrics can be calculated. In this experiment, we utilized three common performance metrics, including Accuracy, Precision, and Recall, with the specific formulas as Formula (17)–Formula (19):
where accuracy represents the proportion of the number of correctly classified samples to the total number of samples, which measures the proportion of the correct classification of the model. Precision indicates how many of the samples predicted by the model to be positive classes are actually positive classes, higher accuracy means that the model misclassifies negative classes into positive classes less often. Recall represents the proportion of samples successfully predicted by the model as positive class over samples of actual positive class, the recall rate measures the model’s ability to identify positive class samples, i.e. the proportion of attack samples that the model can correctly identify.
4.1.3 Hyperparameters determination
The hyperparameters in this paper include the coefficients
Because attack detection involves all data sets, including normal traffic data and attack traffic data. The attack type classification mainly involves only attack traffic data. The data volume ratio is approximately (1 + 3) to 1, so we set the weights of the attack detection loss function and the attack type classification loss function to be
We used the coefficients of the Blackman-Harris (4 coefficients) window, which are mathematically derived and optimized, and validated to meet specific performance metrics, including minimizing the main lobe width and side lobe level, as Formula (20):
In this paper, the optimal value of window length
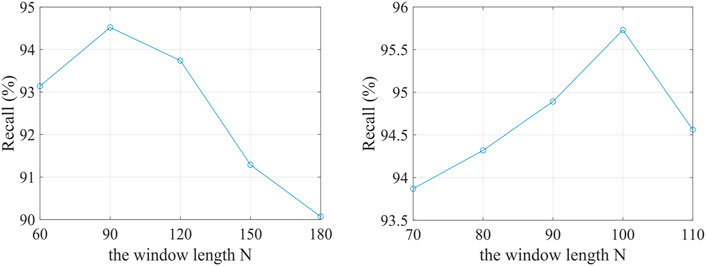
Figure 6. Recall-
Determining the best dimension of PCA dimensionality reduction usually involves weighing information retention and the number of dimensions. We use the relationship between the cumulative variance contribution rate and the number of principal components to determine the number of data features retained after PCA dimensionality reduction
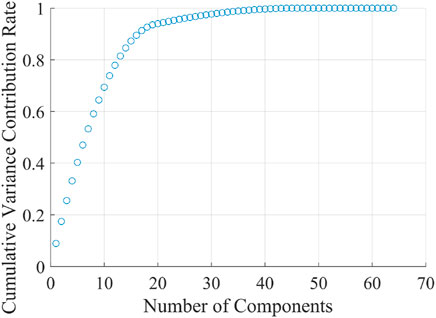
Figure 7. The relationship between cumulative variance contribution rate and number of components.
The structural parameters of the Dual-Head Output model based on parallel CNN-BiLSTM are shown in Table 3. Parameters of the CNN layer include the size and number of kernels, and stride. The CNN layer has no padding. Parameters of the BiLSTM layer and the Fully Connected (FC) layer refer to the size of hidden units. The parameters of the output header for attack detection (Output 1) and the output header for attack type classification (Output 2) are 1 and 3 respectively. 3 is the number of network attack types. The activation functions of Output 1 and Output 2 are Sigmoid and Softmax respectively, and the activation functions of CNN layer and FC layer are Leaky ReLU. The keep-probability of the CNN layer is 0.5, and the keep-probability of the BiLSTM layer and the FC layer is 0.8. We used the Adam optimizer. The network accepts input data with frequency numbers
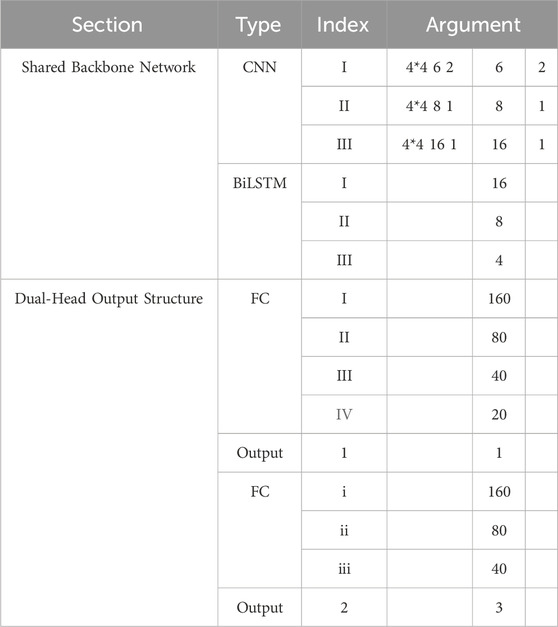
Table 3. The structural parameters of neural network.
For the threshold
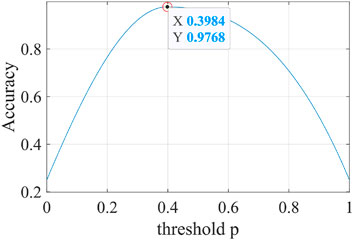
Figure 8. Accuracy-
4.2 Performance evaluation of the proposed method
4.2.1 Statistics and description of experimental results
For the network attack detection task, a confusion matrix and four values of TP, FP, FN and TN can be obtained by inputting test set data into the trained model, from which the evaluation index can be calculated. For the task of attack classification, we can get the confusion matrix of different attack types and calculate their evaluation indexes by statistical analysis of the experimental results. Figure 9 clearly shows the data composition of the experimental results.
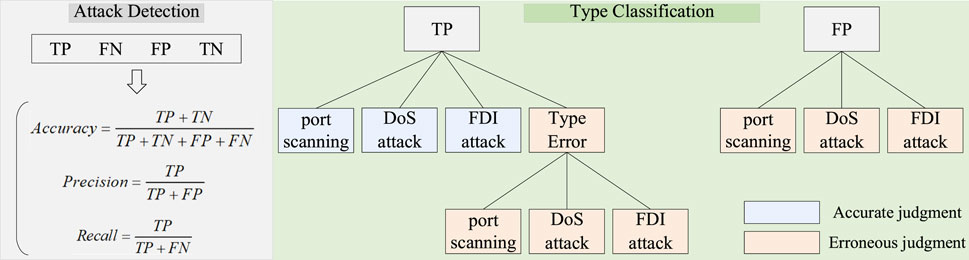
Figure 9. Data composition of the experimental results.
Figure 10 is a confusion matrix drawn based on the experimental results of the method in this paper, where 1 represents port scanning attack, 2 represents DoS attack, 3 represents FDI attack, and 4 represents no attack. As can be seen from Figure 8, the color of the squares on the main diagonal is obviously darker than that of the squares in other positions, which proves that our method has a better effect on the detection of attacks and the classification of attack types. The following sections further analyze and prove this conclusion with data and images.
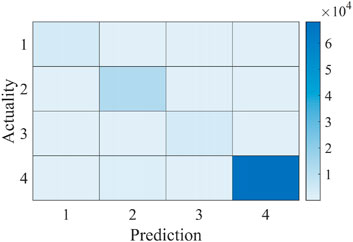
Figure 10. The confusion matrix is drawn according to the experimental results.
4.2.2 Comparative results and analysis of network attack detection
For the attack detection task, we evaluate the performance of our approach by comparing it to several baselines. The baselines include CNN, LSTM, BiLSTM, and CNN-LSTM. Table 4 shows the evaluation metrics of network attack detection based on several methods, Figure 11 compares the evaluation metrics of different methods through a bar chart to intuitively understand the performance differences of different attack detection methods. The following conclusions can be drawn:
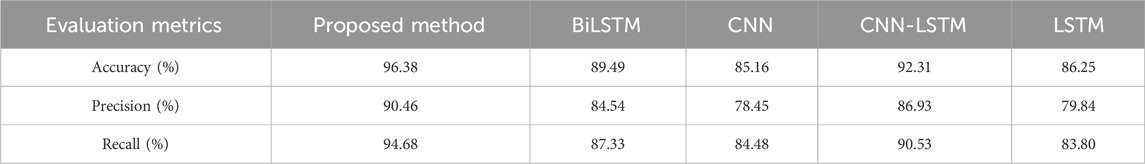
Table 4. Evaluation metrics of attack detection based on several methods.
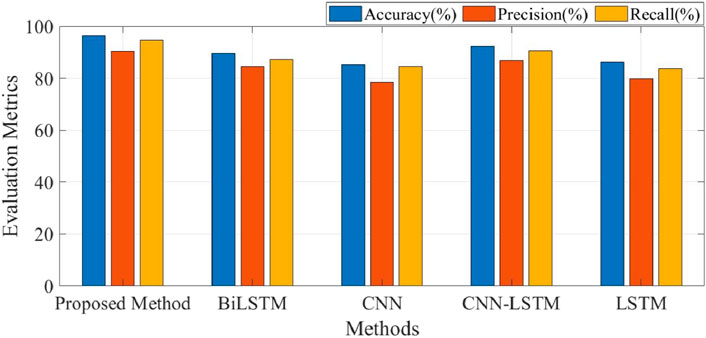
Figure 11. Comparison of evaluation metrics of detection performance based on several methods.
Compared with the baselines, the proposed method achieves the highest accuracy, the highest precision and the highest recall. The highest accuracy means that the overall performance of the model is the best, including the classification of attack and normal conditions is accurate. The highest precision means that the model has a high precision rate in all samples that are judged to be attack cases. The highest recall means that the model has a higher degree of detection of attack cases, and fewer real attack cases are missed.
In comparison to the CNN-LSTM model, the BiLSTM in our model considers both past and future context information when processing data of different frequencies, which helps the model to better capture long-term dependencies in the data. Similarly, the BiLSTM model performs better detection than the LSTM model.
Compared to the BiLSTM and CNN models, our method can more effectively extract spatial features and the relationship between data of different frequencies from the data set, and has stronger data feature mining ability. Similarly, CNN-LSTM model has better detection effect than LSTM model and CNN model. For the same reason, CNN-LSTM model also has better detection effect than BiLSTM model.
The LSTM model is more accurate and precise than the CNN model, but the recall is lower, possibly because the key information related to network attacks is mainly distributed in local areas. So the LSTM model has a lower recall.
4.2.3 Experimental results and analysis of attack type classification
In the whole test set, the evaluation metrics of network attack detection, port scanning attack, DoS attack and FDI attack are compared.
We make statistical data and confusion matrix according to the test set sample information and experimental results. The four numbers in the confusion matrices of network attack detection, port scanning attack, DoS attack and FDI attack add up to the total number of test set samples. Table 5; Figure 12 compare the evaluation metrics for the four cases. The following conclusions can be drawn:
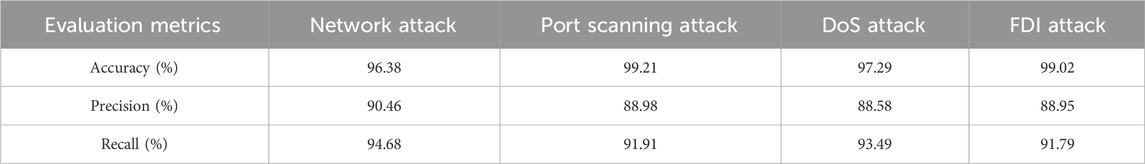
Table 5. Evaluation metrics of attack classification.
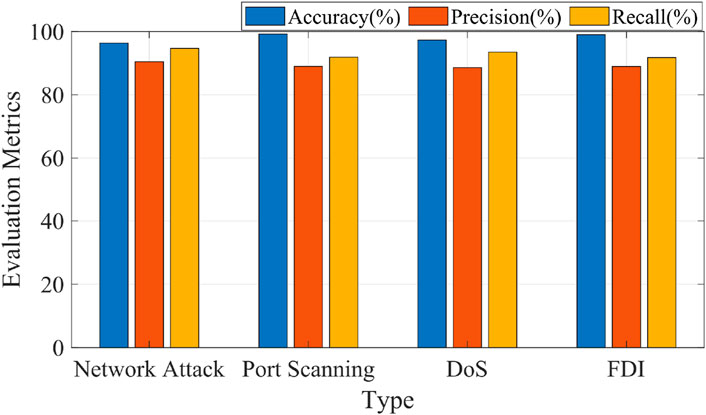
Figure 12. Evaluation metrics of attack type classification.
Compared with the accuracy of network attack detection, the accuracy of port scanning attack, DoS attack and FDI attack is slightly higher, This is because the value of TN in the confusion matrix of the three attack types becomes significantly larger. The precision and recall of the three attacks are significantly lower than that of the network attack detection. There may be two reasons for this. First, compared with the output header of network attack detection, the structure design of the output header of attack type classification is relatively simple, and it cannot meet the complex multi-classification task. Second, the three types of attacks may have some similarities in the characteristics of network traffic data, which makes it difficult for the model to accurately distinguish them, which will affect the classification performance of the model for certain types of attacks, especially in terms of Precision and Recall. Examples include higher traffic frequencies, different connection durations than normal traffic, specific destination ports, abnormal traffic patterns, and abnormal IP addresses.
4.3 Ablation analysis
In order to further verify the effectiveness of the proposed method, an ablation analysis was carried out in this case. Table 6; Figure 13 compare the evaluation metrics of attack detection in these different cases, namely, proposed method, no Blackman-Harris window (Case 1), no time-frequency domain transformation based on Mixed-Radix FFT (Case 2), and no PCA dimensionality reduction (Case 3). Table 7; Figure 14 compare the evaluation metrics of attack type classification in different cases, including port scanning attack, DoS attack and FDI attack. The following conclusions can be drawn:
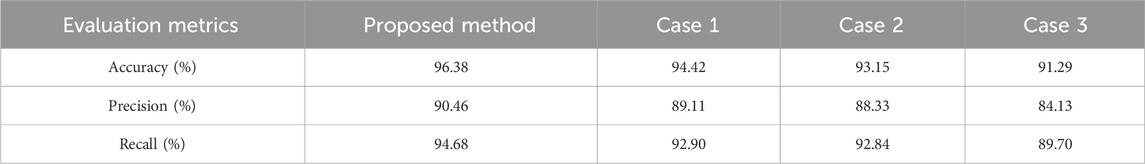
Table 6. Evaluation metrics of attack detection.
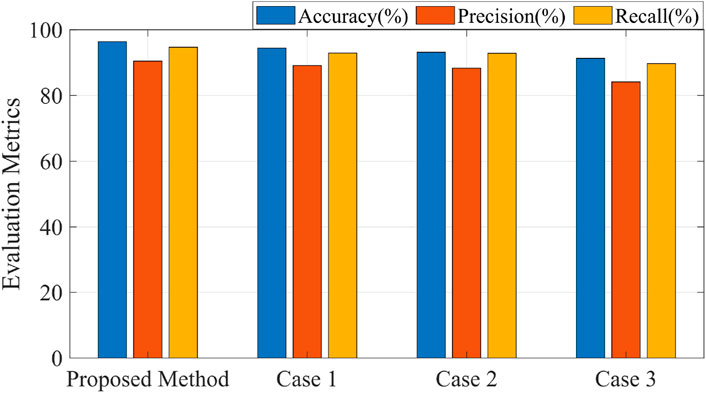
Figure 13. Evaluation metrics of attack detection in these different cases.
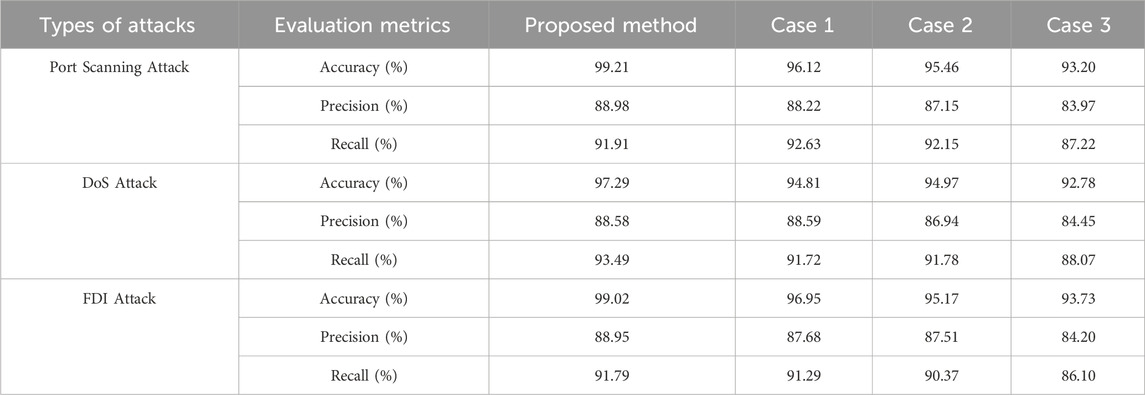
Table 7. Evaluation metrics of attack classification.
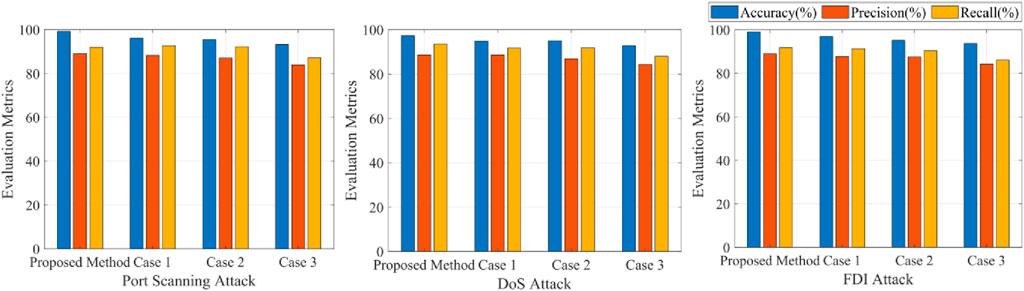
Figure 14. Evaluation metrics of attack type classification in different cases.
The results show that our method has the highest evaluation metrics compared with no Blackman-Harris window, no time-frequency domain transformation based on Mixed-Radix FFT and no PCA dimensionality reduction. This is because Blackman-Harris window can effectively reduce spectrum leakage and improve the accuracy of time-frequency domain transformation. The Mixed-Radix FFT method has both accuracy and computational efficiency, and provides more accurate time-frequency information for complex signals. PCA dimensionality reduction helps to reduce the input feature dimension, improve the efficiency of model training, and filter out redundant information, so as to optimize the performance of the neural network and make it more suitable for processing the data after time-frequency domain transformation. This integrated approach can improve the accuracy of network attack detection and attack type classification.
The evaluation metrics of Case 2 is slightly lower than that of Case 1, and Case 3 has the lowest evaluation metrics. It can be concluded that PCA dimensionality reduction has the greatest impact on the accuracy of network attack detection and attack type classification, because PCA dimensionality reduction directly reduces the number of features and can significantly affect the accuracy. The impact of the time-frequency domain transformation based on Mixed-Radix FFT and Blackman-Harris window on the accuracy of network attack detection and attack type classification is similar, the time-frequency domain transformation based on Mixed-Radix FFT is relatively important, because the time-frequency domain transformation and window function are more related to signal processing. The influence on the detection of network attacks may be more subtle, in addition, the time-frequency domain transformation based on Mixed-Radix FFT has great advantages in capturing the local characteristics of the signal, which helps to improve the performance of the model.
5 Conclusion
Aiming at the problem that MES are vulnerable to network attacks, this paper proposes a dual-head output network attack detection and classification method based on parallel CNN-BiLSTM network. This method not only can detect network attacks effectively, but also has the ability to classify attack types accurately. In order to improve the detection and classification effect of the model on network attacks, this paper adopts a series of data preprocessing methods to improve the quality of data, including Blackman-Harris window, time-frequency domain transformation based on Mixed-Radix FFT, data dimension reduction based on PCA. The parallel structure designed to accelerate the inference process of the network can effectively improve the detection and classification efficiency of the model, and at the same time play the advantages of CNN and BiLSTM in capturing data features to improve the performance of the model. The dual-head output structure can accomplish two different tasks of attack detection and attack type classification simultaneously. The data acquisition environment can simulate the normal working state and the state of different network attacks of the multi-energy system to improve the authenticity and availability of data. Finally, a comprehensive analysis of the experimental results verifies the superior performance and effectiveness of our method in network attack detection and attack classification.
Data availability statement
The original contributions presented in the study are included in the article/Supplementary materials, further inquiries can be directed to the corresponding author.
Author contributions
TL: Writing–review and editing. XZ: Writing–original draft. HZ: Writing–review and editing. JX: Writing–original draft. YC: Writing–review and editing. SY: Writing–review and editing.
Funding
The author(s) declare financial support was received for the research, authorship, and/or publication of this article. This work is supported by the National Key Research and Development Program of China under Grant 2022YFB3105100.
Conflict of interest
Authors TL and SY were employed by Electric Power Research Institute of State Grid Liaoning Electric Power Co., Ltd. Author YC was employed by State Grid Liaoning Electric Power Supply Co., Ltd.
The remaining authors declare that the research was conducted in the absence of any commercial or financial relationships that could be construed as a potential conflict of interest.
Publisher’s note
All claims expressed in this article are solely those of the authors and do not necessarily represent those of their affiliated organizations, or those of the publisher, the editors and the reviewers. Any product that may be evaluated in this article, or claim that may be made by its manufacturer, is not guaranteed or endorsed by the publisher.
References
Amma, N. G. B., Selvakumar, S., and Velusamy, R. L. (2020). A statistical approach for detection of denial of service attacks in computer networks. IEEE Trans. Netw. Serv. Manag. 17 (4), 2511–2522. doi:10.1109/TNSM.2020.3022799
Bhayo, J., Jafaq, R., Ahmed, A., Hameed, S., and Shah, S. A. (2022). A time-efficient approach toward DDoS attack detection in IoT network using SDN. IEEE Internet Things J. 9 (5), 3612–3630. doi:10.1109/JIOT.2021.3098029
Birkinshaw, C., Rouka, E., and Vassilakis, V. G. (2019). Implementing an intrusion detection and prevention system using software-defined networking: defending against port-scanning and denial-of-service attacks. J. Netw. Comput. Appl. 136, 71–85. doi:10.1016/j.jnca.2019.03.005
Çakmakçı, S. D., Kemmerich, T., Ahmed, T., and Baykal, N. (2020). Online DDoS attack detection using Mahalanobis distance and Kernel-based learning algorithm. J. Netw. Comput. Appl. 168, 102756. doi:10.1016/j.jnca.2020.102756
Egala, B. S., Pradhan, A. K., Badarla, V., and Mohanty, S. P. (2021). Fortified-chain: a blockchain-based framework for security and privacy-assured Internet of medical Things with effective access control. IEEE Internet Things J. 8 (14), 11717–11731. doi:10.1109/JIOT.2021.3058946
Elmaghraby, A. S., and Losavio, M. M. (2014). Cyber security challenges in Smart Cities: safety, security and privacy. J. Adv. Res. 5, 491–497. doi:10.1016/j.jare.2014.02.006
Fard, A. K.-, Su, W., and Jin, T. (2021). A machine-learning-based cyber attack detection model for wireless sensor networks in microgrids. IEEE Trans. Industrial Inf. 17 (1), 650–658. doi:10.1109/TII.2020.2964704
Gorzałczany, M. B., and Rudziński, F. (2022). Intrusion detection in Internet of Things with MQTT protocol—an accurate and interpretable genetic-fuzzy rule-based solution. IEEE Internet Things J. 9 (24), 24843–24855. doi:10.1109/JIOT.2022.3194837
Huang, B., Li, Y., Zhan, F., Sun, Q., and Zhang, H. (2022). A distributed robust economic dispatch strategy for integrated energy system considering cyber-attacks. IEEE Trans. Industrial Inf. 18 (2), 880–890. doi:10.1109/TII.2021.3077509
Ilha, A. d. S., Lapolli, Â. C., Marques, J. A., and Gaspary, L. P. (2021). Euclid: a fully in-network, P4-based approach for real-time DDoS attack detection and mitigation. IEEE Trans. Netw. Serv. Manag. 18 (3), 3121–3139. doi:10.1109/TNSM.2020.3048265
Kasongo, S. M., and Sun, Y. (2020). Performance analysis of intrusion detection systems using a feature selection method on the UNSW-NB15 dataset. J. Big Data 7 (105), 105. doi:10.1186/s40537-020-00379-6
Kotenko, I., Saenko, I., Lauta, O., and Kribel, A. (2020). An approach to detecting cyber attacks against smart power grids based on the analysis of network traffic self-similarity. Energies 13 (19), 5031. doi:10.3390/en13195031
Kravchik, M., and Shabtai, A. (2022). Efficient cyber attack detection in industrial control systems using lightweight neural networks and PCA. IEEE Trans. Dependable Secure Comput. 19 (4), 2179–2197. doi:10.1109/TDSC.2021.3050101
Li, T., Chen, L., Jensen, C. S., and Pedersen, T. B. (2021c). TRACE: real-time compression of streaming trajectories in road networks. Proc. VLDB Endow. 14 (7), 1175–1187. doi:10.14778/3450980.3450987
Li, T., Chen, L., Jensen, C. S., Pedersen, T. B., Gao, Y., and Hu, J. (2022c). “Evolutionary clustering of moving objects,” in 2022 IEEE 38th International Conference on Data Engineering, Kuala Lumpur, Malaysia, May, 2022, 2399–2411. doi:10.1109/ICDE53745.2022.00225
Li, T., Huang, R., Chen, L., Jensen, C. S., and Pedersen, T. B. (2020b). Compression of uncertain trajectories in road networks. Proc. VLDB Endow. 13 (7), 1050–1063. doi:10.14778/3384345.3384353
Li, Y., Gao, D. W., Gao, W., Zhang, H., and Zhou, J. (2020a). Double-mode energy management for multi-energy system via distributed dynamic event-triggered Newton-raphson algorithm. IEEE Trans. Smart Grid 11 (6), 5339–5356. doi:10.1109/TSG.2020.3005179
Li, Y., Gao, D. W., Gao, W., Zhang, H., and Zhou, J. (2021a). A distributed double-Newton descent algorithm for cooperative energy management of multiple energy bodies in energy Internet. IEEE Trans. Industrial Inf. 17 (9), 5993–6003. doi:10.1109/TII.2020.3029974
Li, Y., Li, T., Zhang, H., Xie, X., and Sun, Q. (2022a). Distributed resilient double-gradient-descent based energy management strategy for multi-energy system under DoS attacks. IEEE Trans. Netw. Sci. Eng. 9 (4), 2301–2316. doi:10.1109/TNSE.2022.3162669
Li, Y., Ren, R., Huang, B., Wang, R., Sun, Q., Gao, D. W., et al. (2023). Distributed hybrid-triggering-based secure dispatch approach for smart grid against DoS attacks. IEEE Trans. Syst. Man, Cybern. Syst. 53 (6), 3574–3587. doi:10.1109/TSMC.2022.3228780
Li, Y., Wang, J., Wang, R., Gao, D. W., Sun, Q., and Zhang, H. (2022b). A switched Newton–Raphson-Based distributed energy management algorithm for multienergy system under persistent DoS attacks. IEEE Trans. Automation Sci. Eng. 19 (4), 2985–2997. doi:10.1109/TASE.2021.3104393
Li, Y., Xue, W., Wu, T., Wang, H., Zhou, B., Aziz, S., et al. (2021b). Intrusion detection of cyber physical energy system based on multivariate ensemble classification. Energy 218, 119505. doi:10.1016/j.energy.2020.119505
Li, Y., Zhang, H., Liang, X., and Huang, B. (2019). Event-triggered-based distributed cooperative energy management for multienergy systems. IEEE Trans. Industrial Inf. 15 (4), 2008–2022. doi:10.1109/TII.2018.2862436
Liu, B., Chen, J., and Hu, Y. (2022). Mode division-based anomaly detection against integrity and availability attacks in industrial cyber-physical systems. Comput. Industry 137, 103609. doi:10.1016/j.compind.2022.103609
Liu, S., Li, Y., Guan, P., Li, T., Yu, J., Taherkordi, A., et al. (2024). FedAGL: a communication-efficient federated vehicular network. IEEE Trans. Intelligent Veh. 9, 3704–3720. doi:10.1109/TIV.2024.3349655
Lu, K.-D., and Wu, Z.-G. (2022). Multi-objective false data injection attacks of cyber–physical power systems. IEEE Trans. Circuits Syst. II Express Briefs 69 (9), 3924–3928. doi:10.1109/TCSII.2022.3181827
Martin, M. L.-, Carro, B., Arribas, J. I., and Sanchez-Esguevillas, A. (2021). Network intrusion detection with a novel hierarchy of distances between embeddings of hash IP addresses. Knowledge-Based Syst. 219, 106887. doi:10.1016/j.knosys.2021.106887
Mauro, M. D., Galatro, G., Fortino, G., and Liotta, A. (2021). Supervised feature selection techniques in network intrusion detection: a critical review. Eng. Appl. Artif. Intell. 101, 104216. doi:10.1016/j.engappai.2021.104216
Moubayed, A., Refaey, A., and Shami, A. (2019). Software-defined perimeter (SDP): state of the art secure solution for modern networks. IEEE Netw. 33 (5), 226–233. doi:10.1109/MNET.2019.1800324
Rashid, M., Kamruzzaman, J., Imam, T., Wibowo, S., and Gordon, S. (2022). A tree-based stacking ensemble technique with feature selection for network intrusion detection. Appl. Intell. 52, 9768–9781. doi:10.1007/s10489-021-02968-1
Ren, R., Li, Y., Sun, Q., Zhang, S., Gao, D. W., and Maharjan, S. (2023). Switched surplus-based distributed security dispatch for smart grid with persistent packet loss. IEEE Internet Things J. 11, 6185–6198. doi:10.1109/JIOT.2023.3311758
Saad, A., Faddel, S., Youssef, T., and Mohammed, O. A. (2020). On the implementation of IoT-based digital twin for networked microgrids resiliency against cyber attacks. IEEE Trans. Smart Grid 11 (6), 5138–5150. doi:10.1109/TSG.2020.3000958
SaiSindhuTheja, R., and Shyam, G. K. (2021). An efficient metaheuristic algorithm based feature selection and recurrent neural network for DoS attack detection in cloud computing environment. Appl. Soft Comput. 100, 106997. doi:10.1016/j.asoc.2020.106997
Singh, J., Bello, Y., Hussein, A. R., Erbad, A., and Mohamed, A. (2021). Hierarchical security paradigm for IoT multiaccess edge computing. IEEE Internet Things J. 8 (7), 5794–5805. doi:10.1109/JIOT.2020.3033265
Song, Z., Gu, Y., Li, T., Sun, Q., Zhang, Y., Jensen, C. S., et al. (2023). ADGNN: towards scalable GNN training with aggregation-difference aware sampling. Proc. ACM Manag. Data 1 (229), 1–26. doi:10.1145/3626716
Tang, D., Tang, L., Dai, R., Chen, J., Li, X., and Rodrigues, J. J. (2020). MF-Adaboost: LDoS attack detection based on multi-features and improved Adaboost. Future Gener. Comput. Syst. 106, 347–359. doi:10.1016/j.future.2019.12.034
Tang, Y., Yang, K., Zhang, S., and Zhang, Z. (2022). Photovoltaic power forecasting: a hybrid deep learning model incorporating transfer learning strategy. Renew. Sustain. Energy Rev. 162, 112473. doi:10.1016/j.rser.2022.112473
Teng, F., Zhang, Y., Yang, T., Li, T., Xiao, Y., and Li, Y. (2023). Distributed optimal energy management for we-energy considering operation security. IEEE Trans. Netw. Sci. Eng. 11, 225–235. doi:10.1109/TNSE.2023.3295079
Tian, Z., Luo, C., Qiu, J., Du, X., and Guizani, M. (2020). A distributed deep learning system for web attack detection on edge devices. IEEE Trans. Industrial Inf. 16 (3), 1963–1971. doi:10.1109/TII.2019.2938778
Velliangiri, S., Amma, N. G. B., and Baik, N.-K. (2023). Detection of DoS attacks in smart city networks with feature distance maps: a statistical approach. IEEE Internet Things J. 10 (21), 18853–18860. doi:10.1109/JIOT.2023.3264670
Wang, H., Meng, A., Liu, Y., Fu, X., and Cao, G. (2019). Unscented Kalman Filter based interval state estimation of cyber physical energy system for detection of dynamic attack. Energy 188, 116036. doi:10.1016/j.energy.2019.116036
Zadsar, M., Abazari, A., Ameli, A., Yan, J., and Ghafouri, M. (2023). Prevention and detection of coordinated false data injection attacks on integrated power and gas systems. IEEE Trans. Power Syst. 38 (5), 4252–4268. doi:10.1109/TPWRS.2022.3216118
Zhang, N., Sun, Q., Yang, L., and Li, Y. (2022a). Event-triggered distributed hybrid control scheme for the integrated energy system. IEEE Trans. Industrial Inf. 18 (2), 835–846. doi:10.1109/TII.2021.3075718
Zhang, X., Li, Y., Li, T., Gui, Y., Sun, Q., and Gao, D. W. (2023). Digital twin empowered PV power prediction. J. Mod. Power Syst. Clean Energy. doi:10.35833/MPCE.2023.000351
Zhang, Z., Ning, H., Shi, F., Farha, F., Xu, Y., Xu, J., et al. (2022b). Artificial intelligence in cyber security: research advances, challenges, and opportunities. Artif. Intell. Rev. 55, 1029–1053. doi:10.1007/s10462-021-09976-0
Keywords: multi-energy systems, network attack detection, attack type classification, multimodel fusion structure, dual-head output network
Citation: Li T, Zhang X, Zhao H, Xu J, Chang Y and Yang S (2024) A dual-head output network attack detection and classification approach for multi-energy systems. Front. Energy Res. 12:1367199. doi: 10.3389/fenrg.2024.1367199
Received: 08 January 2024; Accepted: 27 May 2024;
Published: 03 July 2024.
Edited by:
Qihe Shan, Dalian Maritime University, ChinaReviewed by:
Peiyuan Guan, University of Oslo, NorwayXiao Wang, The University of Manchester, United Kingdom
Copyright © 2024 Li, Zhang, Zhao, Xu, Chang and Yang. This is an open-access article distributed under the terms of the Creative Commons Attribution License (CC BY). The use, distribution or reproduction in other forums is permitted, provided the original author(s) and the copyright owner(s) are credited and that the original publication in this journal is cited, in accordance with accepted academic practice. No use, distribution or reproduction is permitted which does not comply with these terms.
*Correspondence: Xiaoyu Zhang, 2100689@stu.neu.edu.cn