- China Nuclear Power Technology Research Institute Co., Ltd., Shenzhen, China
The critical heat flux (CHF) is a vital parameter influencing the safety and efficiency of reactor cores. In this study, the Eulerian two-fluid model coupled with the extended wall boiling model in STAR-CCM+ was employed to simulate the departure from nucleate boiling (DNB) phenomenon in a 5 × 5 pressurized water reactor (PWR) fuel rod bundle channel with spacer grids under non-uniform heating conditions. The transition in boiling curves was used as the criterion of DNB occurrence, while the temperature distribution of rod surfaces was utilized for CHF location predictions. The predicted CHF value and CHF location exhibited good agreement with the experimental data. The deviation between calculated and experimental CHF values was within 15% and the deviation between predicted and experimental CHF locations was within one grid-to-grid span length. The results of this study suggested good prospects for the application of two-phase CFD model in predicting CHF in fuel assemblies with spacer grids.
1 Introduction
The critical heat flux (CHF) is one of the most essential parameters in nuclear fuel design and operational safety of nuclear power plants (NPP). When the local heat flux reaches the CHF, the heat transfer from cladding surface to coolant sharply deteriorates. The rapid reduction of the heat transfer coefficient will result in a significant increase in rod temperature, which could weaken or melt the cladding surface, and in severe cases, lead to fuel failure (Yang B. W. et al., 2021).
During the past few decades, researches on CHF have primarily been conducted through experiments. Nevertheless, experimental studies are often considered costly and time-consuming. A number of empirical or semi-empirical correlations have been developed based on experimental data to predict CHF. However, these correlations are limited to specific operating ranges and geometric structures.
With the continuous advancements in computer technology and computational fluid dynamics (CFD), numerical simulations with CFD software have been widely carried out to investigate the departure from nucleate boiling (DNB) phenomenon. Ikeda et al. (2006) performed a single-phase CFD analysis using STAR-CD on a 5 × 5 fuel rod bundle channel. They proposed a method to determine the rod with a higher probability of DNB based on the enthalpy distribution. Nevertheless, their research was unable to directly determine the value and location of the CHF. In order to simulate the boiling flow and the DNB phenomenon more accurately, a growing number of researchers applied the two-phase CFD model in the simulation. Alleborn et al. (2009) used STAR-CD to analyze the two-phase flows and CHF conditions in pipes and in subchannels with an estimation of the near wall accumulation of vapor, which showed the potential of predicting the CHF through the CFD analysis using wall boiling model. Vyskocil and Macek (2010a), Vyskocil and Macek (2010b) used NEPTUNE_CFD as the tool to simulate the DNB process in a vertical tube and in a rod bundle. CHF values were predicted by using the critical void fraction as the criterion of DNB. Zhang et al. (2015) applied the two-fluid model and the wall boiling model to investigate the DNB phenomenon in vertical heated tubes with FLUENT code. Using the wall temperature excursion as the criterion of DNB occurrence, CHF values of 26 sets of working conditions were predicted, which agreed well with the experimental data from Celata et al. (1993). Besides, Zhang et al. (2019) employed the same methodology to investigate the CHF in a 2 × 2 fuel rod bundle under low flow rate and high pressure. Li et al. (2018) used STAR-CCM + to numerically simulate the DNB phenomenon in a vertical heated tube. The transition in the boiling curves was used as the criterion for DNB occurrence under uniform heating conditions while the near wall void fraction was used for non-uniform cases. (Amidu and Addad, 2020; Addad and Amidu, 2022) applied a hybrid multiphase flow mode which combined the Eulerian two-fluid model and the volume of fluid model and presented an extended wall heat flux partitioning model for the prediction of slug flow on a downward-facing heated wall.
As can be seen from the above introduction, due to the complexity of two-phase flow phenomena and the immaturity of interphase models, there is no research showing that one fixed set of CFD model can accurately predict the CHF across different conditions. Besides, there are still few investigations focusing on the prediction of CHF value and CHF location with complex structures, such as a rod bundle channel with several spacer grids, and under non-uniform heating conditions. In this paper, the Eulerian two-fluid model and the extended wall boiling model in STAR-CCM+ were employed to simulate the DNB phenomenon in a 5 × 5 rod bundle channel with multiple spacer grids and with non-uniform heat flux. The values and locations of CHF under several working conditions were predicted and compared to experimental data to validate the CFD model.
2 Numerical models
2.1 Two-fluid model
The Eulerian two-fluid model is employed to simulate the liquid and vapor phases within the studied rod bundle channel. The phases are treated as interpenetrating continua coexisting everywhere in the flow domain. Governing equations for mass, momentum, and energy for each phase are solved and formulations describing phase interactions at interfaces are introduced to close the equations.
Continuity equation:
where
Momentum equation:
where p is the pressure, which is assumed to be equal in all phases.
Energy equation:
where
2.2 Interfacial momentum transfer
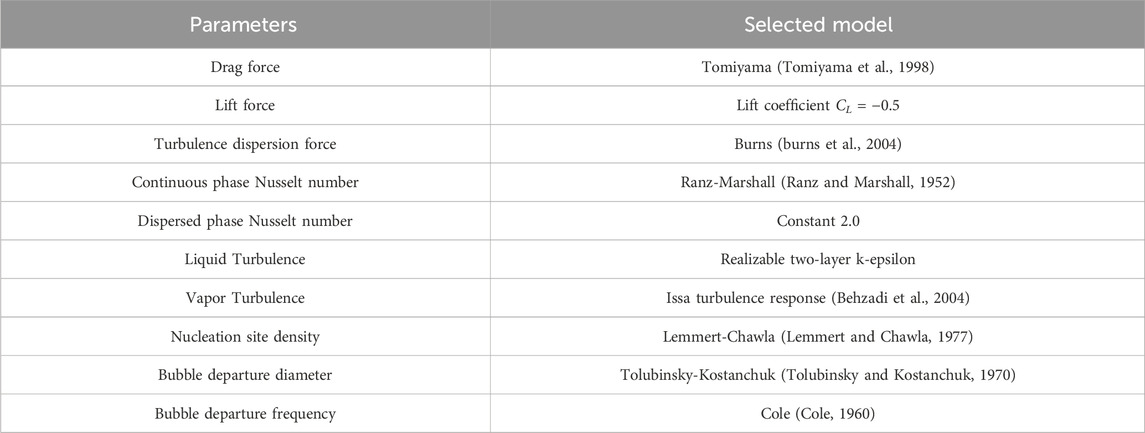
In the momentum equation, the interphase momentum transfer represents the sum of the forces that the phases exert on one another, which is composed of the drag force and the non-drag forces. The non-drag forces include the lift force, the turbulent dispersion force, the wall lubrication force and the virtual mass force. Many researchers convinced that the influences of the wall lubrication force and the virtual mass force could be ignored in the calculations (Li et al., 2011; Rabiee et al., 2017). Therefore, in this study, only the drag force (
The drag force is determined by the relative velocity between the liquid and vapor, and it is calculated as a function of the drag coefficient:
where
The lift force is calculated as follow:
where
The turbulent dispersion force is calculated as follow (burns et al., 2004):
where
2.3 Wall boiling model
The classical numerical method for calculating flow boiling is the Rensselaer Polytechnic Institute (RPI) wall boiling model developed by Kurul and Podowski (1990). The RPI model partitions the total heat flux (
where
where
where
The four components of total heat flux are calculated as follow:
where
2.4 Turbulence model
Turbulence in the continuous phase is modelled using realizable two-layer k-epsilon model. For the dispersed phase, turbulence can be modelled with two alternative methods: either with full turbulence models or with response models. Many researchers recommended the Issa turbulence response model in their studies (Liu et al., 2021; Povolny and Cuhra, 2014; Yang P. et al., 2021), which used a semi-empirical correlation to link the turbulent fluctuations of the continuous and dispersed phases. Thus, aiming to improve computing efficiency, the Issa turbulence response model is employed in this study to model turbulence in the dispersed phase.
The detail settings of all the principal and auxiliary models for the CHF prediction are summarized in Table 1.
3 CFD models
3.1 Geometric model and mesh independence verification
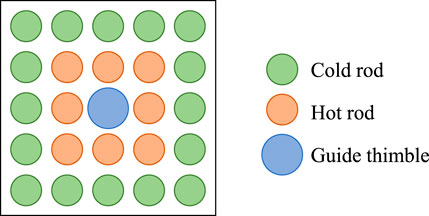
The geometric configuration utilized in this study was a 5 × 5 PWR fuel rod bundle assembled in a square channel as shown in Figure 1. The rod bundle consisted sixteen cold rods, eight hot rods and one guide thimble at the center. The cladding outer diameter was 9.5 mm and the cladding thickness was 0.6 mm. The thimble outer diameter was 12.5 mm. The pitch of the rod bundle was 12.6 mm.
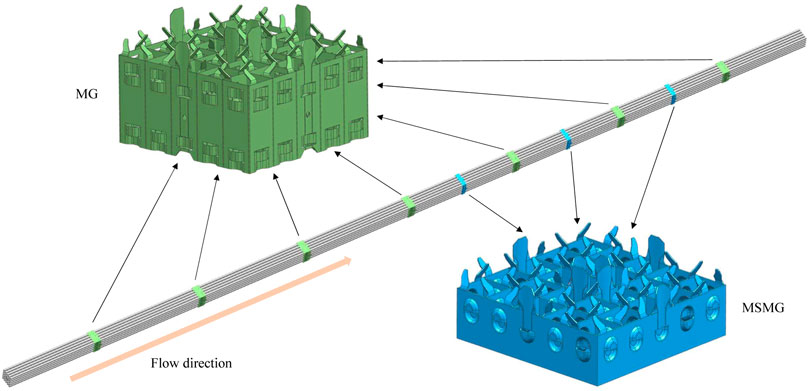
A total of ten spacer grids were positioned along the 3.7 m heated length, including seven Mixing Grids (MG) with a height of 33 mm and three Mid Span Mixing Grids (MSMG) with a height of 18 mm, as shown in Figure 2. MG and MSMG were primarily composed of inner strips, outer strips, steel dimples, springs and mixing vanes. The strips arranged in a crisscross pattern formed a basic framework of the spacer grid. The steel dimples and springs maintained the fuel rods and the guide thimble in their proper radial position, preventing vibration under the impact of the fluid. Furthermore, the mixing vanes located at the end of the spacer grid were designed with a deflection angle with respect to the flow direction, so as to generate lateral flow and enhance fluid mixing. The inlet section was extended by an additional 0.3 m to ensure that the fluid was fully developed before the heating length. A schematic of the arrangement of spacer grids in the rod bundle is illustrated in Figure 3.
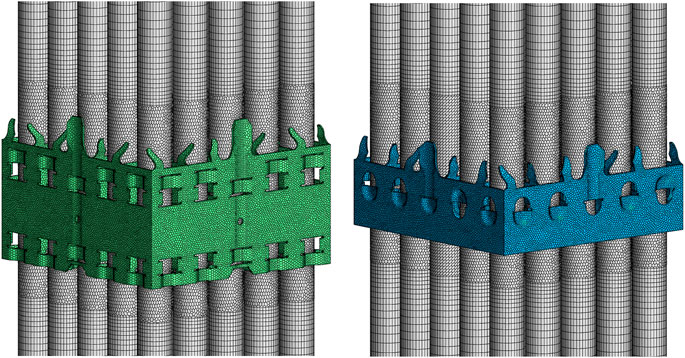
Due to the complexity of the spacer grids geometry, the flow domain where spacer grids were positioned was discretized with unstructured polyhedral meshes while a stretch mesh generator was employed to obtain extruded meshes for the fluid domain of rod bundles. In order to capture the flow details close to the wall, two layers of wall prism meshes were applied. For independence verification, five sets of meshes were tested under the same working condition. Figure 4 shows the variation of pressure drop with the number of cells. As can be seen, the pressure drop decreased gradually with the increase of the cell number. When the cell number exceeded 21.6 million, the influence on the calculation result of pressure drop could be neglected. Therefore, the mesh configuration with 21.6 million cells was selected for CHF prediction in this study. Figure 5 shows the final generated meshes of one of the regions of MG and MSMG, respectively.
3.2 Boundary condition
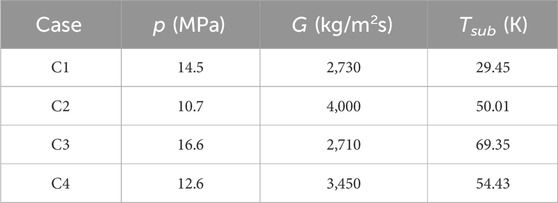
Four experimental cases with significantly different working parameters were selected for the validation of the CFD analysis. Their working conditions are presented in Table 2, where p, G, and Tsub represent pressure, mass flux, and inlet subcooling, respectively.
As shown in Figure 1, fuel rods in the rod bundle were divided into two types: the sixteen fuel rods on the periphery were low-power rods, also known as cold rods, while the other eight fuel rods were high-power rods, also known as hot rods. The power ratio between a hot rod and a cold rod was 1.28. Having the heat flux shape identical to the experiment, the power distribution of fuel rods followed a cosine distribution in the axial direction. In addition, the guide thimble had no heat flux boundary and was set to adiabatic condition in CFD calculation. The heat flux distribution for all fuel rods was defined through the user-defined field function in STAR-CCM+.
The axial heat flux distribution applied to the inner surface of the cladding of cold rods was as follow:
where
The axial heat flux distribution applied to the inner surface of the cladding of hot rods was as follow:
To calculate the total heating power, the axial heat flux distributions of all cold rods and hot rods were integrated and summed together as follow:
where
Then the average heat flux could be derived by dividing the total heating power by the total heating area as follow:
where
In the CFD analysis, a method similar to that in the experiment was adopted. The reference heat flux
3.3 Criterion of DNB occurrence
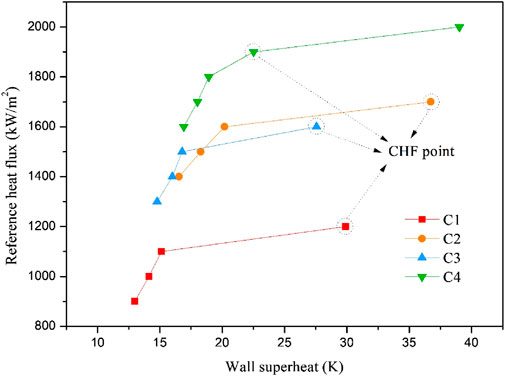
In the studies of CHF prediction using CFD, different methods have been used to determine whether DNB occurred. A common method is estimating the maximum void fraction of heating wall. DNB is considered to have occurred when the void fraction exceeds the critical value. However, for different researchers, the critical void fraction may take different values, such as 0.74 proposed by Podowski and Podowski (2009), 0.8 proposed by Vyskocil and Macek (2010b) and 0.82 proposed by Weisman and Pei (1983). Another common method is based on the wall temperature excursion. When a large temperature increase is monitored, the corresponding heat flux is considered as CHF (Yan et al., 2013; Karoutas et al., 2015). Considering that temperature excursions in numerical simulations could occur at low-mesh-quality cells due to numerical variations, Xu et al. (2019) proposed a new method by defining a variable called DNB indicator which was related to multiple thermal parameters. DNB occurred when the DNB indicator was larger than the indicator threshold, that need to be determined empirically with experimental cases. The studies of Li et al. (2018) and Liu et al. (2021) reported that the transition of the boiling curve could be used as an effective criterion of DNB occurrence. When plotting the curve of the wall superheat against the heat flux, in the subcooled boiling area, the wall superheat increases linearly with the increasing heat flux. As the heat flux continues to increase and reaches a certain value, a turn in the boiling curve can be noticed. This is because when the CHF is reached, the wall temperature will increase rapidly with the increasing heat flux, resulting in a rapid decrease in the slope of the boiling curve. In this study, the final method was adopted to determine the CHF values of the experimental cases.
4 Results and discussion
4.1 Calculation results and CHF prediction
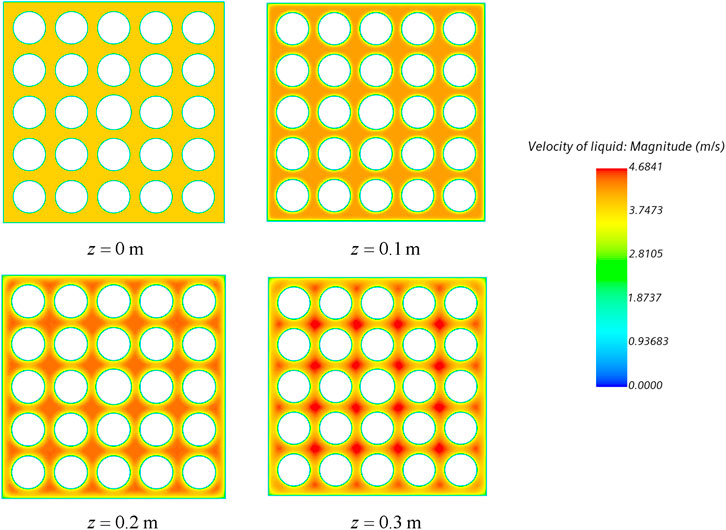
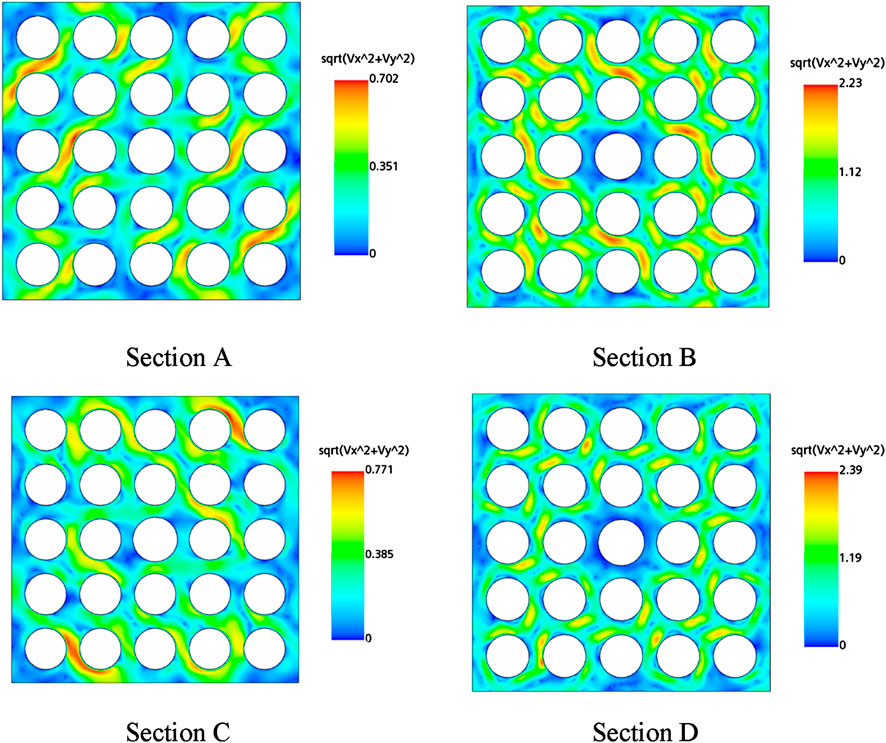
The velocity distribution of liquid in the region between the inlet section (
A series of steady-state CFD calculations were conducted for each of the four experimental cases. Based on the calculation results, the curves of the wall superheat against the reference heat flux
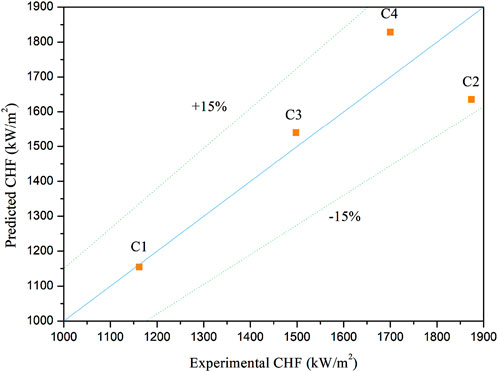
For each case, based on the reference heat flux corresponding to the predicted CHF point, the corresponding average heat flux was derived, which represented the predicted CHF value. Predicted CHF values of all calculated cases were compared to the experimental CHF values, as shown in Figure 8. As can be seen, the predicted results agreed well with experimental ones. Deviations between the predicted and the experimental CHF values for the four cases were within 15%.
4.2 Effect of mixing vanes
It is well known that the enhancement of the CHF by mixing vanes is attributed to the generation of swirl and cross flows and the increase in the turbulent intensity. Taking the CHF point of case C1 as an example (when reference heat flux
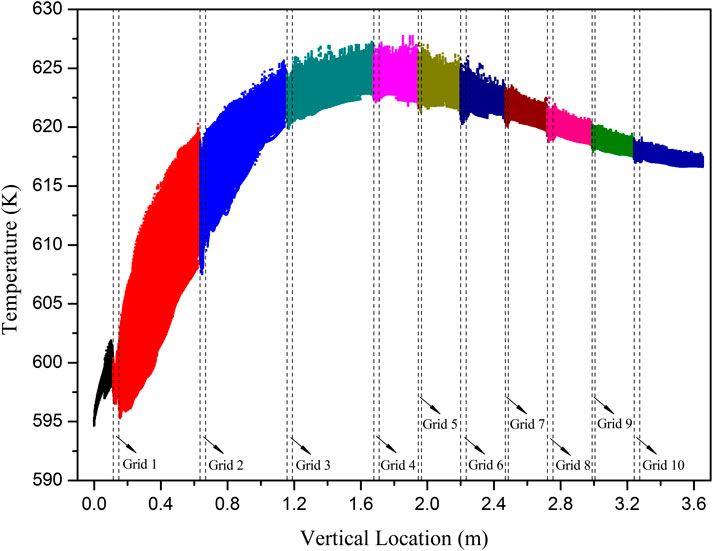
Calculation results of case C1 were used as an example to verify the accuracy of the predicted CHF locations. The temperature values of all cells of hot rod surfaces along with the vertical location were extracted and plotted. Figure 11 shows the extracted temperature distribution of hot rod surfaces with the reference heat flux setting to 1,100 kW/m2, which was the working condition before the CHF was reached. Each point in Figure 11 represented the value of one cell on the surface of the hot rods. The positions of all spacer grids were indicated in the figure. Data in different spans were shown in different colors for suitable distinguishment. It can be seen that due to the cosine shape axial power profile, the highest temperature did not occur at the outlet of the rod bundle channel, but in the region close to the axial power peak. It can also be noticed that after flowing through a spacer grid, the temperature would drop slightly.
Figure 12 shows the temperature of hot rod surfaces with the reference heat flux setting to 1,200 kW/m2, where the CHF was reached. The shape of the temperature distribution was similar to that in Figure 11. However, a large temperature increase was observed in the upstream area of the 8th spacer grid, indicating that the predicted CHF occurred at this location. Besides, temperature excursion could also be observed in the upstream area of the final spacer grid and in the end region of the rod bundle channel, but to a lesser extent, which indicated the possible location of the next CHF.
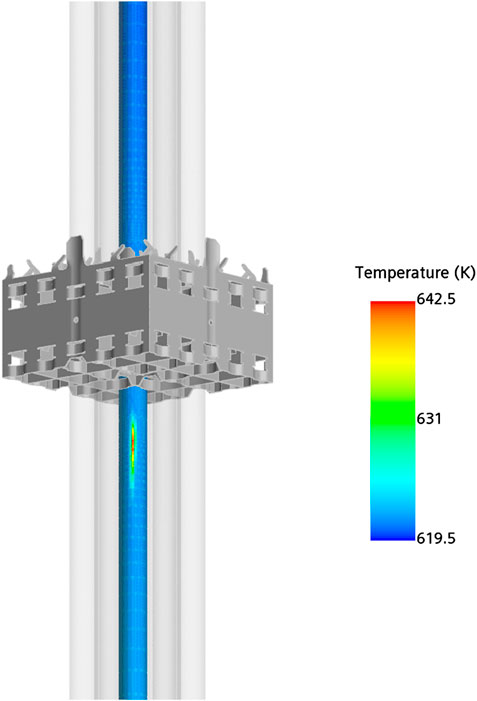
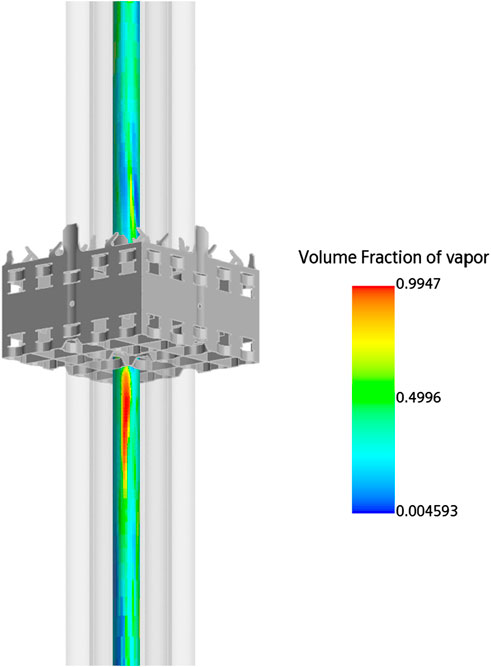
To visually assess the thermal-hydraulic parameter distributions around the CHF location, the contours of the temperature and the vapor volume fraction on the surface of the rod with the highest temperature in the channel close to the 8th spacer grid were shown in Figures 13, 14, respectively. As can be seen, at the CHF location, the temperature was the highest and the vapor volume fraction was the larger. The larger vapor volume fraction was 0.9947.
The comparison between CFD simulation results and experimental data was summarized in Table 3. The deviation between predicted CHF values and experimental CHF values of the four cases was within 15%. All the predicted CHF locations were in the upstream area of a spacer grid, which was consistent with the experiment. The deviation of predicted and experimental CHF locations was within one grid-to-grid span length.
5 Conclusion
Based on the Eulerian two-fluid model and the extended RPI wall boiling model, the DNB phenomenon in a 5 × 5 PWR rod bundle channel combined with several spacer grids was investigated with different non-uniform heating conditions. The following conclusions were achieved from the results.
(1) The CFD model combination utilized in this paper was capable to simulate the DNB phenomenon in a complex rod bundle channel with spacer grids and was capable to predict the CHF values accurately. The deviation between predicted and experimental CHF values was within 15%.
(2) Spacer grids and mixing vanes had a significant influence on the flow and the temperature field. The secondary flow caused by mixing vanes could decrease the possibility of DNB and enhance the CHF.
(3) By analyzing the temperature distribution of rod surfaces, the possible CHF location could be effectively predicted. Both the predicted and experimental CHF locations were in the upstream area of a spacer grid. The deviation was within one grid-to-grid span length.
(4) The CFD scheme and prediction method proposed by this study showed good potential in predicting CHF value and CHF location in complex structures and under different working conditions. Further verification with more experimental cases should be performed. Besides, it is necessary to verify the effectiveness of the proposed CFD scheme and prediction method for different fuel types.
(5) The complexity of spacer grids leads to significant computational cost of the simulation. It is possible that a certain degree of geometric simplification for spacer grids located upstream and far from the CHF location will not affect the prediction results. More research should be performed.
Data availability statement
The original contributions presented in the study are included in the article/supplementary material, further inquiries can be directed to the corresponding author.
Author contributions
LK: Conceptualization, Methodology, Writing–original draft. ZX: Data curation, Writing–review and editing. MS: Formal Analysis, Writing–review and editing. JD: Methodology, Writing–review and editing. MY: Project administration, Writing–review and editing. HY: Writing–review and editing. ZY: Validation, Writing–review and editing. CJ: Supervision, Writing–review and editing.
Funding
The author(s) declare financial support was received for the research, authorship, and/or publication of this article. This research was funded by Department of Science and Technology of Guangdong Province (grant number 2017B020242001).
Conflict of interest
Authors LK, ZX, MS, JD, MY, HY, ZY, and CJ were employed by China Nuclear Power Technology Research Institute Co., Ltd.
Publisher’s note
All claims expressed in this article are solely those of the authors and do not necessarily represent those of their affiliated organizations, or those of the publisher, the editors and the reviewers. Any product that may be evaluated in this article, or claim that may be made by its manufacturer, is not guaranteed or endorsed by the publisher.
References
Addad, Y., and Amidu, M. A. (2022). Numerical prediction of slug flow boiling heat transfer in the core-catcher cooling channel for severe accident mitigation in nuclear power plant. Nucl. Eng. Des. 393, 111796. doi:10.1016/j.nucengdes.2022.111796
Alleborn, N., Reinders, R., Lo, S., and Splawski, A. (2009). Analysis of two-phase flows in pipes and subchannels under high pressure. Proc Exhft-7, Pap. FM 11.
Amidu, M. A., and Addad, Y. (2020). An enhanced model for the prediction of slug flow boiling heat transfer on a downward-facing heated wall. Ann. Nucl. Energy 145, 107596. doi:10.1016/j.anucene.2020.107596
Bartolomei, G. G., and Chanturiya, V. M. (1967). Experimental study of true void fraction when boiling subcooled water in vertical tubes. Therm. Eng. 14, 123–128.
Behzadi, A., Issa, R. I., and Rusche, H. (2004). Modelling of dispersed bubble and droplet flow at high phase fractions. Chem. Eng. Sci. 59 (4), 759–770. doi:10.1016/j.ces.2003.11.018
Burns, A. D., Frank, T., Hamill, I., and Shi, J. M. (2004). The Favre averaged drag model for turbulent dispersion in Eulerian multi-phase flows. 5th Int. Conf. Multiph. flow 4, 1–17.
Celata, G. P., Cumo, M., and &riani, A. (1993). Burnout in highly subcooled water flow boiling in small diameter tubes. Int. J. Heat Mass Transf. 36 (5), 1269–1285. doi:10.1016/S0017-9310(05)80096-1
Cole, R. (1960). A photographic study of pool boiling in the region of the critical heat flux. AIChE J. 6 (4), 533–538. doi:10.1002/aic.690060405
Ikeda, K., Makino, Y., and &Hoshi, M. (2006). Single-phase CFD applicability for estimating fluid hot-spot locations in a 5×5 fuel rod bundle. Nucl. Eng. and Des. 236 (11), 1149–1154. doi:10.1016/j.nucengdes.2005.11.006
Karoutas, Z. E., Xu, Y., Smith, L. D., Joffre, P. F., and Sung, Y. (2015). Use of CFD to predict critical heat flux in rod bundles. Nucl. React. Therm. Hydraul. (NURETH-16).
Kurul, N., and Podowski, M. Z. (1990). Multidimensional effects in forced convection subcooled boiling. Int. Heat. Transf. Conf. Digit. Libr. Begel. House Inc.
Lemmert, M., and Chawla, J. M. (1977). Influence of flow velocity on surface boiling heat transfer coefficient. Heat Transf. Boil. 237 (247).
Li, H., Vasquez, S. A., Punekar, H., and Muralikrishnan, R. (2011). Prediction of boiling and critical heat flux using an Eulerian multiphase boiling model. ASME Int. Mech. Eng. Congr. Expo. 54921, 463–476. doi:10.1115/IMECE2011-65539
Li, Q., Avramova, M., Jiao, Y., Chen, P., Yu, J., Pu, Z., et al. (2018). CFD prediction of critical heat flux in vertical heated tubes with uniform and non-uniform heat flux. Nucl. Eng. Des. 326, 403–412. doi:10.1016/j.nucengdes.2017.11.009
Liu, W., Shang, Z., Yang, L., Liu, Y., Hu, Y., and Liu, Y. (2021). Numerical investigation of the CHF in a vertical round tube and a single rod channel based on the Eulerian two-fluid model. Prog. Nucl. Energy 135, 103699. doi:10.1016/j.pnucene.2021.103699
Moraga, F. J., Bonetto, F. J., and Lahey, R. T. (1999). Lateral forces on spheres in turbulent uniform shear flow. Int. J. Multiph. Flow 25 (6-7), 1321–1372. doi:10.1016/S0301-9322(99)00045-2
Podowski, M. Z., and Podowski, R. M. (2009). Mechanistic multidimensional modeling of forced convection boiling heat transfer. Sci. Technol. Nucl. Installations 2009. doi:10.1155/2009/387020
Povolny, A., and Cuhra, M. (2014). Two-phase CFD of channel boiling for boiling transition problems. Int. Conf. Nucl. Eng. 45950, V005T17A059. doi:10.1115/ICONE22-30970
Rabiee, A., Moradi, L., and Atf, A. (2017). Numerical analysis of critical heat flux phenomenon in a nuclear power plant core channel in the presence of mixing vanes. AUT J. Mech. Eng. 1 (2), 119–130. doi:10.22060/mej.2017.12928.5472
Tolubinsky, V. I., and Kostanchuk, D. M. (1970). Vapour bubbles growth rate and heat transfer intensity at subcooled water boiling. Int. Heat. Transf. Conf. 4, 23.
Tomiyama, A., Kataoka, I., Zun, I., and Sakaguchi, T. (1998). Drag coefficients of single bubbles under normal and micro gravity conditions. JSME Int. J. Ser. B Fluids Therm. Eng. 41 (2), 472–479. doi:10.1299/jsmeb.41.472
Tomiyama, A., Tamai, H., Zun, I., and Hosokawa, S. (2002). Transverse migration of single bubbles in simple shear flows. Chem. Eng. Sci. 57 (11), 1849–1858. doi:10.1016/S0009-2509(02)00085-4
Vyskocil, L., and Macek, J. (2010a). CFD simulation of critical heat flux in a tube. Proc. CFD4NRS-3 CFD Nucl. React. Saf. Appl.
Vyskocil, L., and Macek, J. (2010b). CFD simulation of critical heat flux in a rod bundle. Proc. CFD4NRS-3 CFD Nucl. React. Saf. Appl.
Weisman, J., and Pei, B. S. (1983). Prediction of critical heat flux in flow boiling at low qualities. Int. J. Heat Mass Transf. 26 (10), 1463–1477. doi:10.1016/S0017-9310(83)80047-7
Xu, Y., Brewster, R. A., Conner, M. E., Karoutas, Z. E., and Smith, L. D. (2019). CFD modeling development for DNB prediction of rod bundle with mixing vanes under PWR conditions. Nucl. Technol. 205 (1-2), 57–67. doi:10.1080/00295450.2018.1510265
Yan, J., Smith III, L. D., and Karoutas, Z. (2013). Departure from nucleate boiling modeling development for PWR fuel. Int. Conf. Nucl. Eng. 55805, V003T10A016. doi:10.1115/ICONE21-15345
Yang B W, B. W., Anglart, H., Han, B., and Liu, A. (2021). Progress in rod bundle CHF in the past 40 years. Nucl. Eng. Des. 376 (2–4), 111076. doi:10.1016/j.nucengdes.2021.111076
Yang P, P., Zhang, T., Hu, L., Liu, L., and Liu, Y. (2021). Numerical investigation of the effect of mixing vanes on subcooled boiling in a 3× 3 rod bundle channel with spacer grid. Energy 236, 121454. doi:10.1016/j.energy.2021.121454
Zhang, R., Cong, T., Tian, W., Qiu, S., and Su, G. (2015). Prediction of CHF in vertical heated tubes based on CFD methodology. Prog. Nucl. Energy 78, 196–200. doi:10.1016/j.pnucene.2014.10.001
Keywords: critical heat flux, CFD, rod bundle, two phase flow, spacer grids
Citation: Kejia L, Xiong Z, Shuqi M, Desheng J, Yulong M, Yisong H, Youxin Z and Jun C (2025) Prediction of critical heat flux in a rod bundle channel with spacer grids based on the Eulerian two-fluid model. Front. Energy Res. 12:1366902. doi: 10.3389/fenrg.2024.1366902
Received: 07 January 2024; Accepted: 13 December 2024;
Published: 07 January 2025.
Edited by:
Longxiang Zhu, Chongqing University, ChinaReviewed by:
Luteng Zhang, Chongqing University, ChinaYongchun Li, Shenzhen University, China
Yacine Addad, Khalifa University, United Arab Emirates
Copyright © 2025 Kejia, Xiong, Shuqi, Desheng, Yulong, Yisong, Youxin and Jun. This is an open-access article distributed under the terms of the Creative Commons Attribution License (CC BY). The use, distribution or reproduction in other forums is permitted, provided the original author(s) and the copyright owner(s) are credited and that the original publication in this journal is cited, in accordance with accepted academic practice. No use, distribution or reproduction is permitted which does not comply with these terms.
*Correspondence: Jin Desheng, SmluLmRlc2hlbmdAMTYzLmNvbQ==
 Li Kejia
 Zheng Xiong
 Meng Shuqi
 Jin Desheng*