 Muhammad Kazim Raza1Mohammed Alghassab2*
 Abdullah Altamimi3,4
 Zafar A. Khan5,6
 Syed Ali Abbas Kazmi1*Majid Ali1
 Uchenna Diala7
- 1U.S.-Pakistan Center for Advanced Studies in Energy (USPCAS-E), National University of Sciences and Technology (NUST), Islamabad, Pakistan
- 2Department of Electrical and Computer Engineering, Shaqra University, Riyadh, Saudi Arabia
- 3Department of Electrical Engineering, College of Engineering, Majmaah University, Al-Majmaah, Saudi Arabia
- 4Engineering and Applied Science Research Center, Majmaah University, Riyadh, Saudi Arabia
- 5School of Computing and Engineering, University of Huddersfield, Huddersfield, United Kingdom
- 6Department of Electrical Engineering, Mirpur University of Science and Technology, New Mirpur City, Pakistan
- 7Department of Electrical and Electronic Engineering, School of Engineering, University of Derby, Derby, United Kingdom
Hybrid microgrids, integrating local energy resources, present a promising but challenging solution, especially in areas with limited or no access to the national grid. Reliable operation of off-grid energy systems necessitates sustainable energy sources, given the intermittent nature of renewables. While fossil fuel diesel generators mitigate risks, they increase carbon emissions. This study assesses the viability of integrating a very small modular renewable energy reactor into a microgrid for replacing conventional diesel generators, substantially curbing greenhouse gas emissions. A comprehensive analysis, including design and economic evaluation, was conducted for an off-grid community microgrid with an annual generation and load of 8.5 GWh and 7.8 GWh, respectively. The proposed microgrid configurations incorporate very small modular reactors, alongside solar, wind, and battery storage systems. MATLAB modeling and simulation across eight cases, accounting for seasonal variations, demonstrate the technical and economic feasibility of case 7. This configuration, integrating modular reactors, photovoltaics, wind turbines, and battery storage, satisfactorily meets load demands. Notably, it boasts a high internal rate of return up to ∼31% and a shorter payback period of around 4 years compared to alternative scenarios.
1 Introduction
While fossil fuels still dominate the energy sector, the global demand for energy continues to increase, prompting massive technological advances in the alternative energy industry—including solar, hydropower, nuclear energy, and other renewable sources, as well as advanced energy storage. However, power generation and supply for remote communities are still major challenges. The costs of fuel transportation and grid extension are too high for customer-challenging utilities, and there has always been a need to develop a solution for isolated areas to fulfill their energy self-sufficiency with local resources (Lew, 2000). The issue of balancing various competing aspects of power generation, such as capital expenditures, operating costs, emissions, and environmental impact, is a major challenge in realizing this need. To address the global problem of climate change, there has been a growing focus on popular low-carbon energy sources. Renewable energy resources (RER), such as solar photovoltaics and wind power, have low greenhouse gas (GHG) emissions and are also the controlled version of nuclear power plants (Borelli et al., 2016; Bull, 2001). Furthermore, very small modular nuclear reactors (vSMRs) are a new concept for capitalizing power requirements of less than 20 MW, for special applications. The portable version of the smart microgrid (SMG) with vSMRs, and respective inclusion of other energy options, can be used to meet the requirement of off-grid communities (Juan et al., 2024). The compact size and modular design of vSMR make them easily transportable, which makes them suitable for use in microgrid configurations (Juan et al., 2024). Microgrids (MGs) are a new distribution network architecture, based on idea of smart grids that may fully benefit from the integration of a large number of small-scale distributed energy resources and low-voltage power distribution with distributed energy resource (DER) systems (Kuzlu et al., 2017). The MG offers a solution to electrify off-grid areas at a minimal cost rather than adding a traditional cost-intensive infrastructure (Kroposki et al., 2007). Microgrids have two modes—the grid-connected mode, which connects the microgrid to the main grid, and the islanded mode, which isolates the microgrid from the main grid, and in the case of an emergency, it provides a continuous supply of power to the loads (Parhizi et al., 2015). The advantages accredited to MGs include improved power quality and reliability, cost-effectiveness, and carbon emission reduction, particularly using onsite RER (Nwulu and Xia, 2017). The power is supplied to remote area communities by use of photovoltaic (PV), battery energy storage systems (BESS), and a diesel generator, which has been a viable off-grid solution in recent years (Nejabatkhah, 2018).
In MGs, there are different DG units for various RERs, such as solar PV, wind, biomass, fuel cells, and BESS for local loads operating together in harmony, with integrated power electronic controllers and protective devices to feed the load at hand (Meena Agrawal, 2014). The production of RER is highly dependent on local weather and climatic conditions. Non-dispatchable renewable energy’s intermittent and stochastic supplies might cause power system instabilities (Denholm and Margolis, 2007; Zahedi, 2011; Khalid and Savkin, 2013; Mahmud and Zahedi, 2016). The RER is a non-controllable and stochastic system and, therefore, requires a BESS, which allows one to store surplus energy during periods when the RER output exceeds the power requirement. The stored power can be reused when the RER is not generating (Roberts and Sandberg, 2011). Storage is predicted to be a critical component of future smart grids (Cosentino et al., 2011; Denholm and Hand, 2011; Roberts and Sandberg, 2011). Therefore, nuclear vSMR can be implemented for clean environments and applications, including those that require both electrical and thermal power sources, since its carbon footprint is very nominal (Iyer et al., 2014).
These reactors may provide baseload energy generation regardless of weather, and they could be linked to a central or distributed grid or run independently. Combining a renewable energy resource (hybridization) with an energy storage system will increase the reliability and stability of the supplied energy. Several articles have discussed the installation of storage, the hybridization of power plants and microgrid power systems at various locations, and their associated components, methods, criteria, and aims. The impact of aging for the entire system is considered, rather than just a single component, which makes the long-term study of an energy system less trustworthy. The simulation process for the operation of the energy system flow and use of optimal component capacity across a year has been conducted for economic evaluations of these systems, aiming at minimizing the payback time. The simulations were run using the average yearly months of meteorological and environmental data. The usage of a supercapacitor module might feed, quickly, peaks in the electrical load, considerably increasing energy self-consumption and self-sufficiency (Hassan, 2020; Ceran et al., 2021; Hassan et al., 2022).
The limitation in previous research is that RERs, such as solar PV and wind, are not better options for running baseload due to their variability and intermittent nature. Fossil fuel-based generators are also used for baseload, which compounds the climate issues. The power delivered to isolated areas via the utility grid is subjected to high financial constraints for transmission lines and infrastructures, which are compounded with high system losses. The population in such isolated areas is dispersed and usually has low income, which makes the recovery of the installed infrastructure very difficult. To handle all these problems, vSMR is the best option to use for base power plants, as it will enable the provision of a sustainable power supply.
The purpose of this study is to formulate and implement RERs, BESS, and vSMR for off-grid communities and evaluate whether the integrated vSMR with renewables in MGs has the technological and economic capacity to replace typical diesel generators, resulting in considerable reductions in GHG emissions. The power generated by these resources are managed well to ensure that reliable power is supplied to the connected loads in an MG. The proposed solution of MGs will also reduce the stress on the transmission grid as well as minimize carbon emissions to the environment.
2 The architecture of the microgrid system
In this study, a typical MG consists of sources such as vSMR, a solar PV system, a wind turbine system (WTS), and a BESS, as shown in Figure 1A. For the simulation of the electric load, wind speed, and solar irradiance, data are available on NREL National Solar Radiation Database (NSRDB) and G. W. Atlas, “Global Wind Atlas” (NREL, 2019; Atlas, 2019). A vSMR, PV, and a wind turbine are used to meet the electrical demand of Nawabshah. The MG is not stable without a BESS to store the electrical energy because RERs are naturally intermittent. The surplus electrical energy will be stored in a BESS to meet the electrical demand and will be discharged as per requirements.
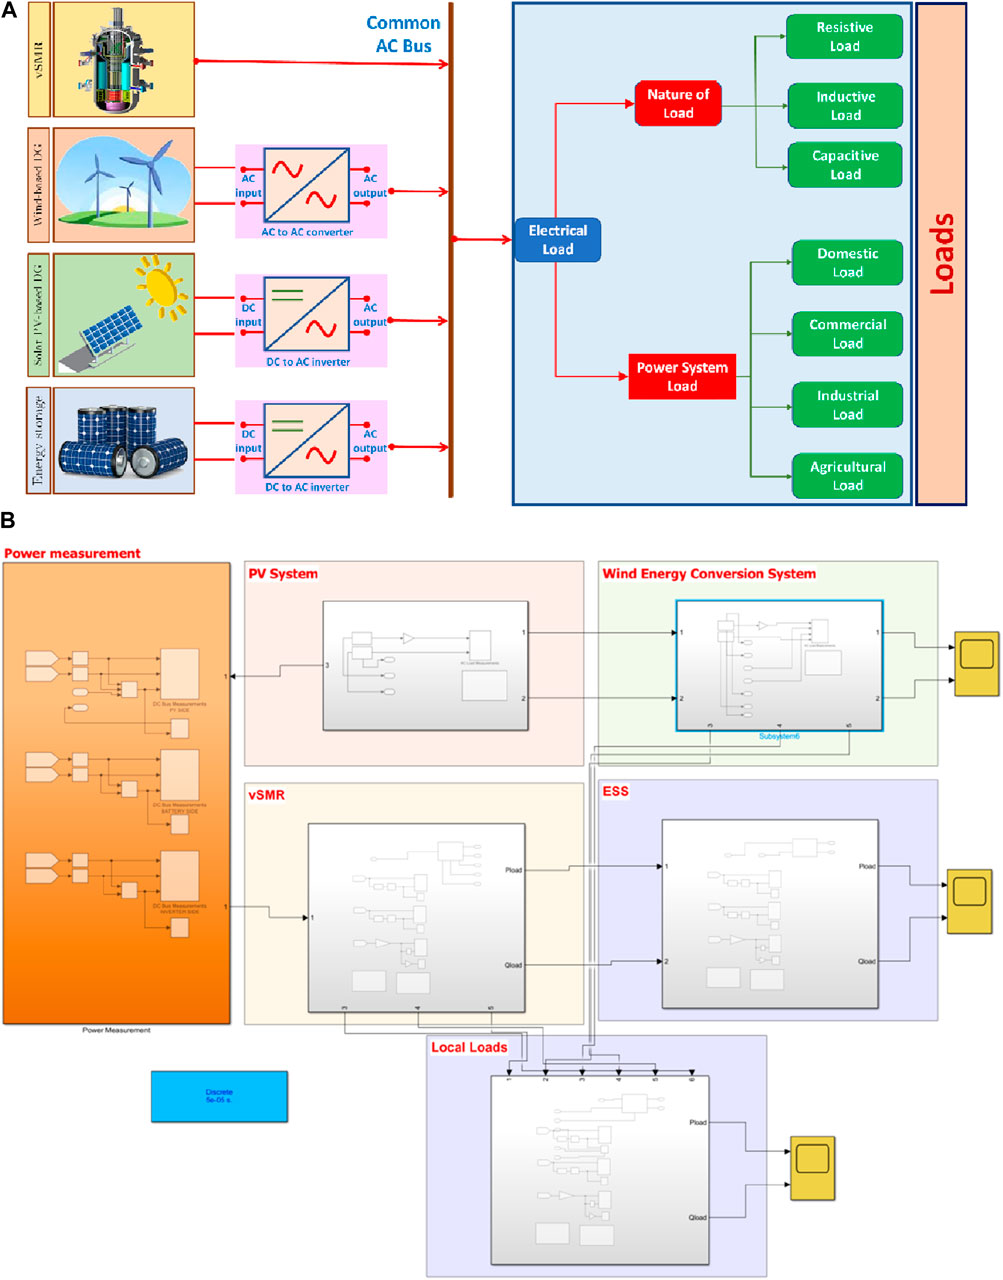
Figure 1. (A) System architecture of a vSMR-based MG (Arafat and Van Wyk; Acen et al., 2021; Douglas and Proprietary; incore, 2016). (B) MATLAB/Simulink test system with integrated vSMR, PV, and wind turbines.
2.1 MATLAB and Simulink model
A microgrid operating at 11 kV is developed in Simulink, as shown in Figure 1B. It is observed that the following units—vSMR, PV, wind, and BESS, are integrated together to achieve the desired system.
2.2 Illustration of the test cases
In this study, an annual seasonal variation is considered, which includes four seasons—winter, spring, summer, and autumn. Eight cases are developed to simulate the model for different scenarios, as shown in Table 1. Table 1 presents several simulated scenarios used to highlight the vSMR that is used as the baseload, while other resources are turned on and off.
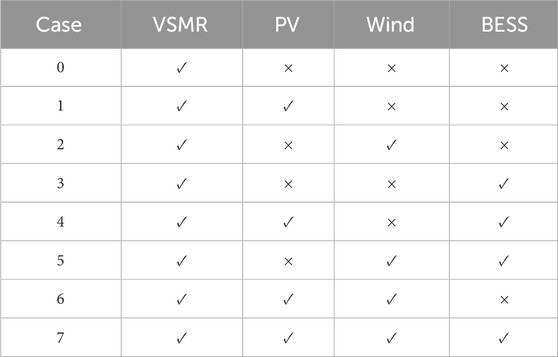
Table 1. Illustration of the test cases.
3 System modeling
3.1 System load profile
The load data are collected for Nawabshah in Pakistan. To decrease the computational load, the daily demand profile for each month is considered to be the same. The real-time simulation has 8,760 h in a year. The simulation with 8,760 data points takes approximately 90 times as long as the analysis with 96 data points. Furthermore, the sensitivity analysis performed in this research necessitates running the simulation many times. As a result, each month’s hour-by-hour average for each day was used to create the 24 data points for each month and then take the average hour-by-hour for each month of the season. The average for winter is the same as 16 January 2021, the spring average is same as 3 April 2021, and the summer average is the same as 7 June 2021, and that for the autumn season is same as 5 October 2021, resulting in the simulation using 96 data points (4 seasons 1 day/month 24 h/day) rather than 8,760 data points (Ko and Kim, 2019). The daily demand profile (24 data points) for January was the same throughout the month, while the daily load demands for the other three seasons were not the same, as shown in Figure 2.
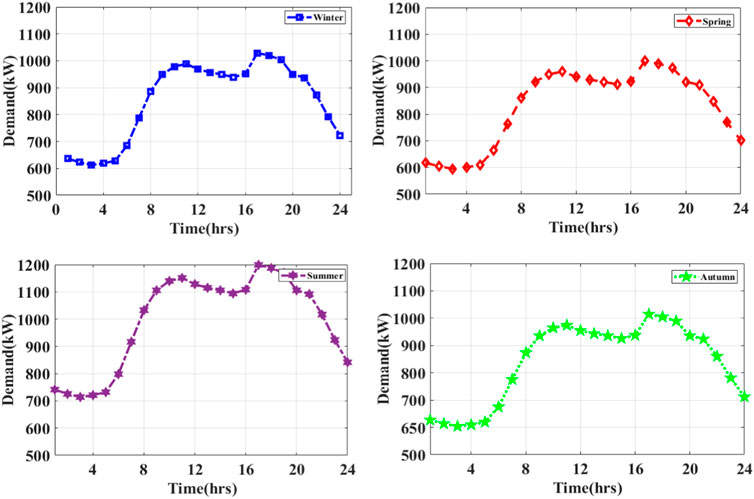
Figure 2. Electrical demand for Nawabshah.
3.2 Microgrid components
3.2.1 Very small modular reactors (vSMR)
According to the US Energy Department’s Advanced Research Projects Agency-Energy (ARPA-E), the vSMR is rated below 10 MWe (World Nuclear Association, 2019). The vSMR can operate in both baseload and load-following modes. At its maximal capacity, the baseload vSMR always offers a constant power level. Load-following vSMR, on the other hand, adjusts its output in response to variations in system demand, over time (Lewis et al., 2016). The following is a list of vSMRs that are still in the developmental stage. The capital cost of vSMRs depends on the amount of generated electricity. The vSMR fuel cost is included in the “fuel cost”; hence, it is not included in the refilling cost. The cost of operation, maintenance, and fuel is unaffected by the amount of power generated. As a result, load-following, which reduces the power output, is not cost-effective (Locatelli et al., 2015). On the other hand, the functioning of a base-load plant is simple; it always supplies the same amount of power during an interval of time. In this study, a vSMR rated at 1 MWe is considered for an MG is shown in Table 2, and specifications are shown in Table 3 (Nichol and Desai, 2019).
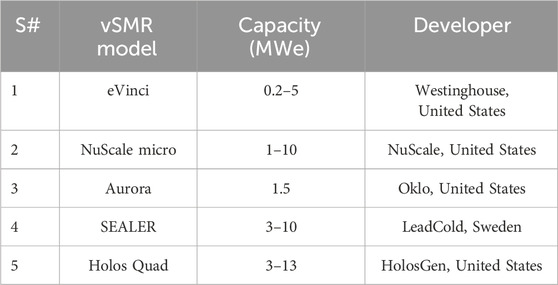
Table 2. vSMR standard capacities across the globe (Nichol and Desai, 2019).
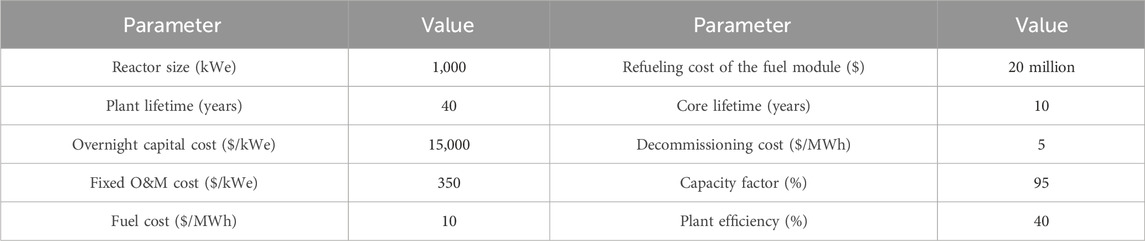
Table 3. Specifications of the vSMR (Nichol and Desai, 2019).
3.2.2 Solar power
The seasonal irradiance data are considered for the PV system. Each season’s resource data are represented by 24 data points. The hour-by-hour average for each day was used to create the 24 data points for each month, and then the average hour-by-hour for each month of the season was taken. The average for winter was taken on 16 January 2021; for spring, it was taken on 3 April 2021; for summer, it was taken on 7 June 2021; and for autumn, it was taken on 5 October 2021. To get the first data point of January (among 24 data points), the first-hour data point of each day (total of 31 days) was collected and averaged. Similarly, the average of each second-hour data point of each day (total of 31 days) of January was the second resource data point (among 24 data points), as shown in Figure 3A. The amount of solar electricity generated is determined by the surface area of PV panels, solar irradiation, and ambient temperature. The PV panel’s capital cost, replacement cost, O&M cost, and lifetime are 1,200 $/kW (Canada Energy Regulator, 2020), 1,000 $/kW (Canada Energy Regulator, 2020), 12 $/kW/Year (IEA, 2020a), and 25 years (Engineering, 2020), respectively.
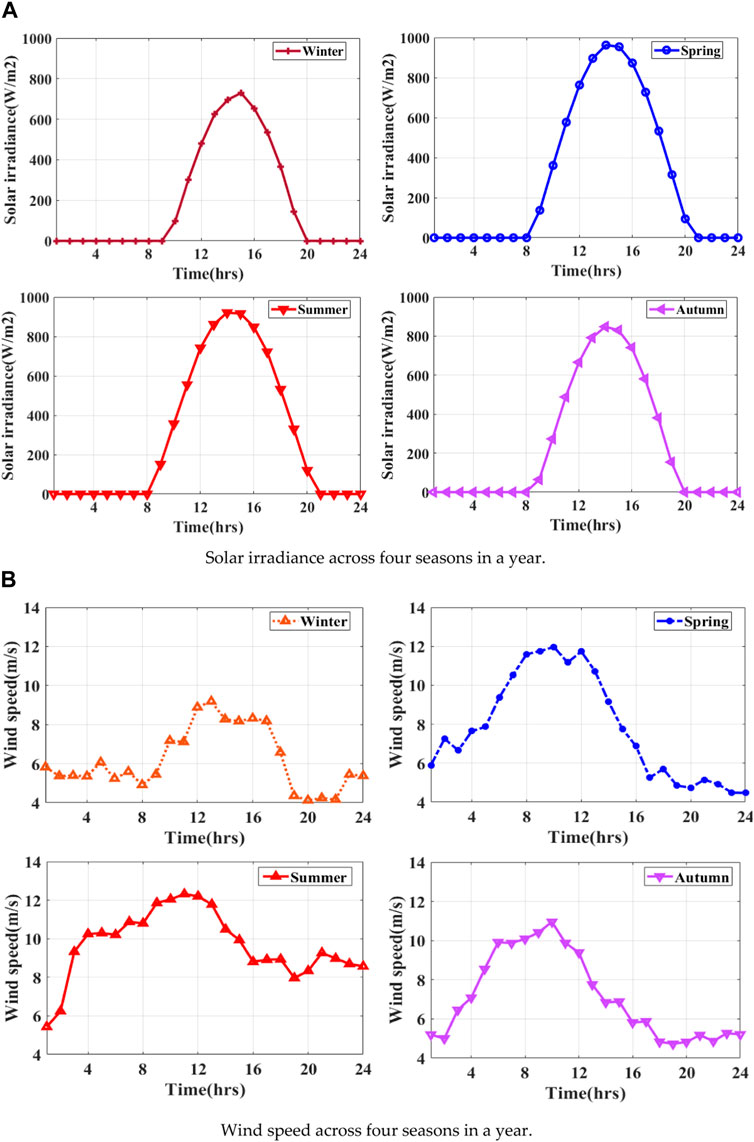
Figure 3. (A) Solar irradiance across four seasons in a year. (B) Wind speed across four seasons in a year.
The total extracted power by solar PV panels is calculated using Eq. 1 (Malik et al., 2020).
Here,
3.2.3 Wind power
For simulation purposes, the resource data of wind speed and the average solar irradiance are considered for each season. The wind speed is used to calculate the mechanical and electrical power, as shown in Eqs 2, 3 (Murty and Kumar, 2020). The WT’s capital cost, replacement cost, O&M cost, and lifetime are 1,130 $/kW (Canada Energy Regulator, 2020), 1,130 $/kW, 48$ kW/year (IEA, 2020b), and 25 years (Mone et al., 2015), respectively.
The wind is the primary source of power for wind turbines, and its mechanical power is proportional to the speed and direction of the wind, as shown in Eq. 2. Due to several system component losses, mechanical power cannot be translated completely into electrical power. To account for these losses, mechanical power is multiplied by the generator’s efficiency to obtain electrical power, as shown in Eq. 3. The data of wind speed are shown in Figure 3B.
3.2.4 BESS
The power of both solar PV systems and wind turbines changes as the weather varies. They will require supplemental resources, such as an auxiliary service, to deal with these variations. The BESS acts as an additional service, modulating active power to manage the frequency and minimize frequency deviation caused by abrupt changes in the RES. Emergency consumption (Ee) in Eq. 6 indicates the unexpected load that was neither scheduled nor controlled by the battery. If a planned load is unexpectedly disconnected, the battery will be charged. Furthermore, battery charging and discharging are stated in Eqs 5, 6 (Murty and Kumar, 2020). The BESS capital cost, replacement cost, operating and maintenance costs, and lifetime are 398 $/kWh, 398 $/kWh, 10 $/kW/Year, and 5 years, correspondingly (Kharel and Shabani, 2018).
The BESS’s capability is determined by the electrical demand and supply of energy hours in a day. The battery bank capacity (kWh) is estimated using the following equations (Borhanazad et al., 2014):
where
4 Economic analysis
The financial analysis described in this article is concerned with the evaluation of the vSMR, renewable energy, and BESS installation project, in terms of budget and financial elements, which are used to determine the project’s investment viability. In this study, financial analysis is carried out by using the System Advisor Model (SAM) software. The cash flow for year n is represented by Cn, which is the difference between the cash input in year n (Cin,n) and the cash outflow in year n. According to Eqs 8–10, (Cout,n) is used to calculate Cn and may be used to determine these cash flows.
where n denotes the debt duration in years and
4.1 Simple payback period–SPP
The simple payback period is the time taken for the cash flow to match the total venture capital as given in Eq. 11, where C is the project’s capital cost,
4.2 Net present value–NPV
A project’s net present value is the difference between its discounted. As indicated in the equation 12, it is determined by discounting all cash flows.
where r is the project’s discount rate and Cn is the cash flow after taxes in n years.
4.3 Internal rate of return–IRR
The IRR is the discount rate that results in a zero NPV for the project and is computed by using Eq. 13
where
5 Results and discussion
There are various scenarios simulated in MATLAB. The vSMR is used as a base, and other resources turn on and off. The results of all cases are compared one by one for each season. This study considers 4 months for the winter season—January, February, November, and December. For spring, 2 months, March and April, are considered. For summer, 4 months, May, June, July, and August, are considered. Finally, for the autumn season, 2 months, September and October, are considered.
5.1 Case 0: base case
For the base case, the load demand is supplied by only vSMR, and it supplies constant power to the off-grid communities. Figure 4A shows the load demand curve for different seasons, and the vSMR curve is the total output power of vSMR, during each time interval. The load demand increased from 03:00 to 11:00 and 15:00 to 17:00 in all seasons. The average load demand is highest during the summer season, while the lowest load demand is measured during the spring season.

Figure 4. (A) Power supplied by only vSMR. (B) Balance power after supplied by only VSMR. (C) Power supplied by VSMR with solar PV. (D) Balance power after supplied by vSMR and solar PV. (E) Power supplied by VSMR and wind turbines. (F) Balance power after supplied by vSMR and wind turbines. (G) Power supplied by VSMR with BESS. (H) Balance power after supplied by vSMR with BESS. (I) Power supplied by VSMR and PV. (J) Balance power after supplied by vSMR and solar PV with BESS. (K) Power supplied by VSMR and wind turbines with BESS. (L) Balance power after supplied by vSMR and wind turbines with BESS. (M) Power supplied by VSMR, PV, and wind turbines. (N) Balance power after supplied by vSMR, PV, and wind turbines. (O) Power supplied by VSMR, solar PV, and wind turbines with BESS. (P) Balance power after supplied by vSMR, solar PV, and wind turbines with BESS. (Q) Comparison of all cases 0–7.
Figure 4B shows the balance power available after the load demand was fulfilled by vSMR. The maximum surplus power of 96 kW is available in the system, from 01:00 to 06:00, except for the summer season. The maximum power load demand increases to 500 kW, from 07:00 to 22:00, in the summer season. Therefore, the base power cannot meet the load demand as the power supplied to the microgrid is constant.
5.2 Case 1: addition of the renewable resources
In this case, the load demand is fulfilled by vSMR and the solar PV system. The output power of the solar PV varies as it depends on the solar irradiance, while vSMR generates constant power to off-grid communities. Figure 4C shows the load demand requirement for different seasons such as winter, spring, summer, and autumn, while the curve for vSMR and solar PV is the total output power of the system during each time interval. The load demand increased from 03:00 to 11:00 and 15:00 to 17:00 in all seasons. The average load demand is highest during the summer season, while the lowest load demand is measured during the spring season. The output power of solar PV varies from 09:00 to 19:00 as solar irradiance is available during the day. The maximum power extracted from the solar PV system is 568 kW at 15:00 during the spring season.
Figure 4D shows the balance of power available after the load demand was fulfilled by the vSMR and solar PV system. However, when the solar PV is integrated with vSMR, the maximum surplus power of 350 kW is available, from 01:00 to 06:00 and 11:00 to 18:00, during the spring season and the deficit of 390 kW, from 07:00 to 12:00 and 18:00 to 24:00, in the summer season. However, the surplus of 350 kW is due to the solar PV system from 13:00 to 17:00. Moreover, when the solar PV system is injected into the system, the required power is reduced from 500 kW to 350 kW, as compared to case 0.
5.3 Case 2: vSMR and wind-based renewable resource only
In this case study, the microgrid provides the load demand by integrating vSMR and wind turbines. The output power of wind turbines varies as it depends on wind speed, while the vSMR supplies constant power to off-grid communities. Figure 4E shows the load demand requirement for various seasons and the total individual output power produced by vSMR and wind turbines during each time interval. The load demand increases from 03:00 to 11:00 and 15:00 to 17:00, throughout the year. The average power of a wind turbine is 180 kW, and the maximum power generated by the wind turbine is 243 kW at 13:00 during the summer season.
Figure 4F shows that when vSMR and wind turbine are integrated, the maximum surplus power of 235 kW is available in the system from 01:00 to 06:00 in the winter season, due to less load demand, as industry and markets are closed, while the system faces a shortage of power of 320 kW from 08:00 to 23:00 in the summer season, although the maximum shortage of power in summer is due to the maximum load demand as compared to other seasons. Moreover, when a wind turbine is injected into the system, the trend is the same, but the required power is reduced because the wind speed is available throughout the year. In addition, there is a shortage of power during the winter and summer seasons from 08:00 to 23:00 and from 09:00 to 23:00 during the spring and autumn seasons.
5.4 Case 3: vSMR and BESS only
In this case, only vSMR with the BESS topology is implemented to meet the load demand, and it provides constant power to off-grid communities. Figure 4G depicts the load demand curve for several seasons, with the curve representing the total output power of vSMR and SOC of BESS for each time interval. In all seasons, the load demand increased from 03:00 to 11:00 and 15:00 to 17:00. The summer season has the highest average load demand, whereas the spring season has the lowest load demand. Except during the summer season, surplus electricity is stored in the BESS from 01:00 to 06:00 and provided to the load from 07:00 to 09:00. Figure 4H depicts the available balance power after the load demand has been met by vSMR with the BESS. However, the shortage of power is during 06:00 to 24:00 in the summer season, 09:00 to 23:00 in the winter season, 09:00 to 23:00 in the autumn season, and 10:00 to 23:00 in the spring season. During the summer season, the maximum power required to fulfill the load demand is increased to 500 kW from 06:00 to 24:00. Thus, the consistent power supplied to the microgrid’s base power with the BESS has been unable to match the load requirement.
5.5 Case 4: vSMR, solar PV, and BESS only
In this case, vSMR and solar PV with BESS topology is implemented to meet the load demand. The solar PV output power varies due to solar irradiation, whereas vSMR provides consistent electricity to off-grid populations. Figure 4I depicts the load demand required for various winter, spring, summer, and fall seasons, with the curve representing the total individual output power of vSMR, solar PV, and BESS at each time interval. In all seasons, load demand increased from 03:00 to 11:00 and 15:00 to 17:00. The summer season has the highest average load demand, whereas the spring season has the lowest load demand. Except for summer, electricity is in excess from 01:00 to 06:00, with the next surplus power in the system when extracted power from solar PV is provided into the system. The excess electricity, on the other hand, is stored in the BESS and used to power the load. The solar PV output power fluctuates from 09:00 to 19:00 according to available solar irradiation during the day. During the spring season, the greatest power extracted from the PV system is 568 kW at 15:00.Furthermore, the BESS stores surplus electricity from 01:00 to 06:00 and 13:00 to 16:00 in the winter season, 01:00 to 06:00 and 11:00 to 14:00 in the spring season, 13:00 to 16:00 in the summer season, and 01:00 to 06:00 and 12:00 to 17:00 in the autumn season. Additionally, during the winter season, BESS is provided to load from 07:00 to 08:00 and 17:00 to 19:00, during the spring season from 07:00 to 10:00 and 19:00 to 24:00, during the summer season from 17:00 to 19:00, and during the fall season from 07:00 to 08:00 and 18:00 to 22:00.
Figure 4J depicts the available balance power after the load demand has been met by the vSMR and solar PV system with BESS, when solar PV and BESS are integrated with vSMR in the microgrid. Despite this, the spring season fulfills the load demand throughout the season and has excess electricity from 15:00 to 18:00. Furthermore, the fall season has excess power from 16:00 to 17:00 but a shortage of electricity from 09:00 to 11:00 and 23:00 to 24:00. Furthermore, while summer and winter have the same surplus and deficit power trends, the duration and quantity of electricity required have changed. Moreover, the shortage of power is during 06:00 to 11:00 and 20:00 to 24:00 during the summer season, with a maximum deficiency power of 390 kW. During the winter season, the shortage of power is during 09:00 to 12:00 and 20:00 to 24:00, with a maximum shortage of over 250 kW.
5.6 Case 5: vSMR, wind turbine, and BESS only
In this case, vSMR and wind turbines with BESS topology are implemented to meet the load demand. The wind turbine output power varies with wind speed, whereas vSMR provides steady electricity to off-grid populations. Figure 4K depicts the load demand required for various winter, spring, summer, and fall seasons, with the curve representing the total individual output power for the vSMR and wind turbine at each time interval. In all seasons, the load demand increased from 03:00 to 11:00 and 15:00 to 17:00.
The summer season has the highest average load demand, whereas the spring season has the lowest load demand. In addition, during the summer season, the maximum power extracted from the wind turbine is 243 kW at 13:00. Because wind is accessible all year, the output power of wind turbines is available at all times. In addition, during the winter season, BESS reserves surplus electricity from 01:00 to 04:00, during the spring season from 01:00 to 03:00 and 24:00, during the summer season from 01:00 to 06:00, and during the fall season from 01:00 to 04:00 and at 24:00. Furthermore, BESS is provided to load from 07:00 to 11:00 in the winter season, 09:00 to 18:00 in the spring season, 07:00 to 10:00 in the summer season, and 08:00 to 15:00 in the fall season.
Figure 4L depicts the remaining power available after vSMR and wind turbine with BESS have met the load requirement, when the wind turbine and BESS are integrated with vSMR in the microgrid. However, excess electricity is accessible from 05:00 to 06:00 during the winter season, 04:00 to 08:00 during the spring season, and 05:00 to 7:00 during the fall season. Moreover, the system has a power deficit from 12:00 to 23:00 during the winter season, 19:00 to 23:00 during the spring season, 11:00 to 23:00 during the summer season, and 16:00 to 23:00 during the fall season.
5.7 Case 6: vSMR, solar PV, and wind turbines only
In this case, vSMR, solar PV, and wind turbine (WT) topology is implemented to meet the load demand. The solar PV and wind turbine output power varies due to solar irradiation and wind speed, respectively. However, vSMR provides consistent electricity to off-grid populations. Figure 4M depicts the load demand requirements for various seasons such as winter, spring, summer, and fall, whereas the curves for vSMR, solar PV, and wind turbine represent the total output power of the system at each time interval.
In all seasons, the load demand increased from 03:00 to 11:00 and 15:00 to 17:00. The summer season has the highest average load demand, whereas the spring season has the lowest load demand. The output power of solar PV fluctuates from 09:00 to 19:00 because solar irradiance is available throughout the day, but the output power of wind turbines is accessible all year since wind is available. During the summer season, the maximum power taken from the solar PV is 568 kW at 15:00, while the greatest power extracted from the wind turbine is 243 kW at 13:00.
Figure 4N depicts the remaining power after vSMR, solar PV, and wind turbines have met the load requirement. When the solar PV and wind turbine systems are integrated with vSMR, the maximum surplus power of 520 kW is available from 01:00 to 19:00 and at 24:00, during the spring season, and deficit power of 240 kW from 07:00 to 11:00 and 19:00 to 23:00, during the summer season. However, there is a surplus power of 520 kW as a result of the WT and PV systems. Furthermore, when WT and PV systems are fed into the system, the shortage of power drops from 500 kW to 240 kW when compared to the base case.
5.8 Case 7: vSMR, solar PV, and wind turbines with BESS
In this case, the load demand is fulfilled by vSMR, solar PV, and wind turbines with BESS. The solar PV and wind turbine output power varies due to solar irradiation and wind speed. However, vSMR provides consistent electricity to off-grid populations. Figure 4O depicts the load demand requirements for winter, spring, summer, and fall seasons, whereas the curves for vSMR, solar PV, wind turbine, and BESS represent the total output power of the system at each time interval.
In all seasons, load demand increased from 03:00 to 11:00 and 15:00 to 17:00. Summer has the highest average load demand, whereas spring has the lowest load demand. The output power of solar PV fluctuates from 09:00 to 19:00 because solar irradiance is available throughout the day, but the output power of WT is accessible all year since wind is available. Furthermore, during the summer season, BESS reserves surplus electricity from 01:00 to 04:00 and 20:00 to 23:00 while supplying power to load from 07:00 to 10:00 and 19:00 to 23:00. During the spring season, the maximum power taken from PV is 568 kW at 15:00, while the maximum power extracted from WT is 243 kW at 13:00 during the spring season.
Figure 4P depicts the remaining power available after vSMR, solar PV, and wind turbines have met the load requirement, when solar PV, wind turbines, and BESS are integrated with vSMR in the microgrid. Although it fulfilled the load demand and has excess electricity throughout the year, there is no power shortfall. In addition, the excess electricity is available from 05:00 to 06:00 and 15:00 to 17:00 in the winter season, 04:00 to 19:00 in the spring season, 13:00 to 18:00 in the summer season, and 11 h in the autumn season from 05:00 to 07:00 and 11:00 to 18:00.
5.9 Comparison of cases 0–7
In the comparison of all cases, case 7 is better than the other cases because it integrates vSMR, solar PV, and wind turbines with BESS. It meets the load demand and generates surplus power, while the total surplus power is 8653 kW for the whole year. Case 3 is the worst because there is a power deficit of 17,660 kW throughout the year, as shown in Figure 4Q. The BESS is also used in cases 3, 4, and 5, but they do not meet the load demand.
The comparative performance analysis of different cases is shown in Table 4, based on the total surplus power and total power deficit in all four seasons. As a result, it is observed that case 7 is the best case, as it gives surplus power and no power deficit. On the other hand, all other cases give power lags and deficits which are undesirable. The summary of the performance analysis of the eight cases can be observed and compared easily from Table 4.
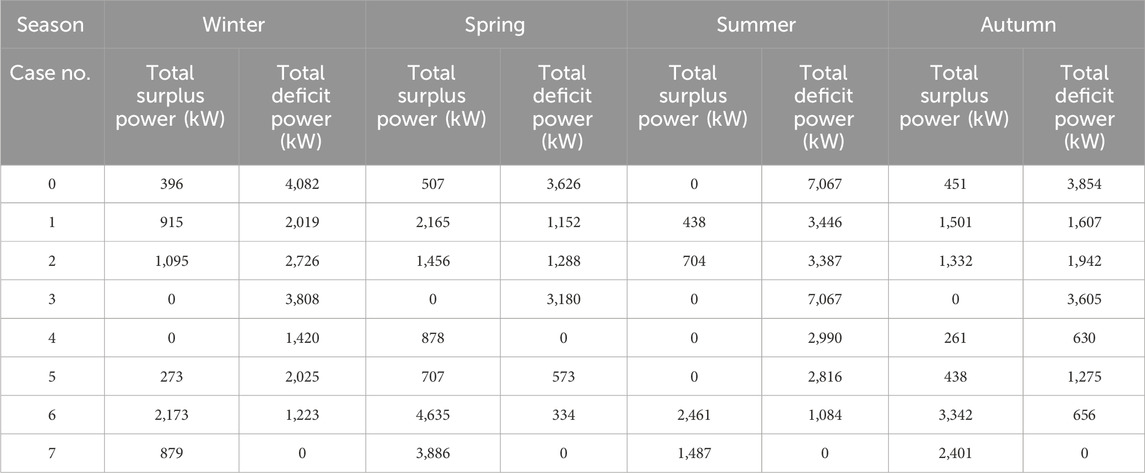
Table 4. Comparative performance analysis of different schemes.
Figure 4Q shows that case 7 meets the load demand throughout the year, although other cases have a shortage of power and have not fulfilled the load demand. Moreover, for the winter season, case 7 meets all of the load demand and also surplus power at 05:00, 06:00, 15:00, 16:00, and 17:00. The power values are 168 kW, 105 kW, 278 kW, 234 kW, and 93 kW, respectively. Furthermore, during the spring season, the surplus power is from 03:00 to 19:00, that is, 13 kW–520 kW. Moreover, during the summer season, it meets all of the load demand and also surplus power from 14:00 to 18:00 at 297 kW, 350 kW, 369 kW, 313 kW, 137 kW, and 91 kW. Furthermore, during the autumn season it also meets the load demand from 5:00, 06:00, 07:00 with surplus power 200 kW, 161 kW, and 77 kW, respectively. The surplus power from 11:00 to 18:00 of 11 kW–387 kW varies.
5.10 Economic analysis of vSMR-RER-based microgrid
The study of the economic analysis of different parameters for various scenarios of the system is shown in Table 4. The lifetime period of vSMR, solar PV, WT, and BESS is 40, 25, 25, and 5 years, respectively, and the cash flow of the system and the replacement cost of equipment are shown in Figure 5.
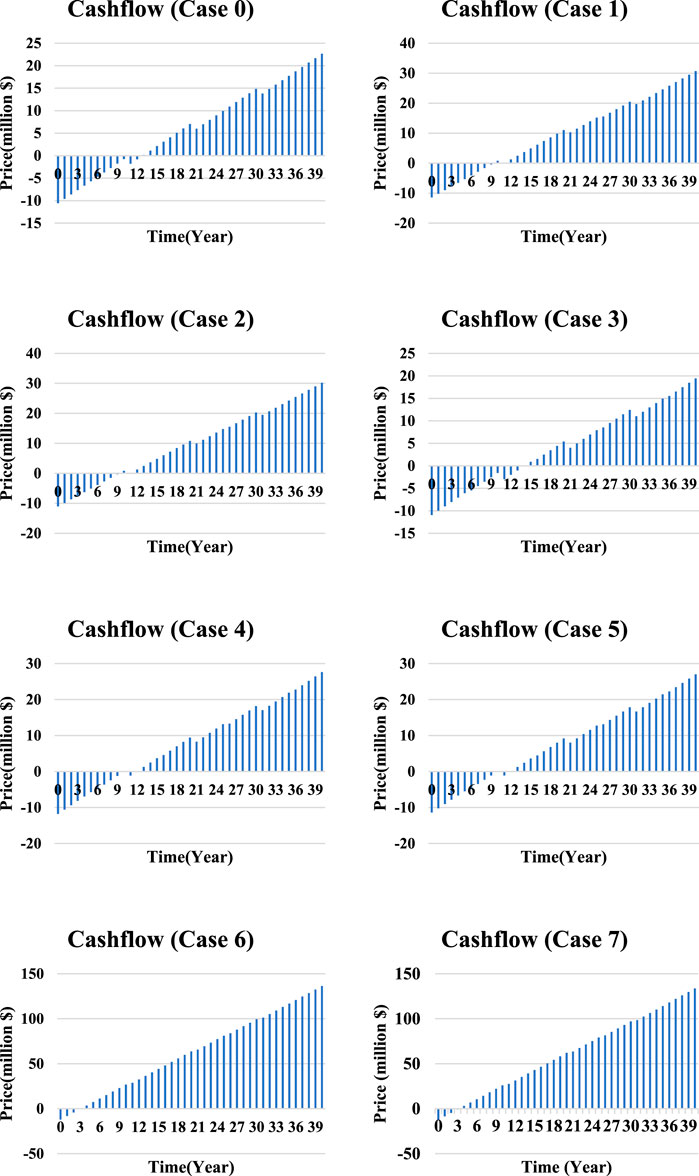
Figure 5. Cash flows of cases 0–7 with economic analysis using vSMR, solar PV, and wind turbines with BESS.
5.10.1 Comparison of economic analysis
The economic comparative performance analysis of different cases is shown in Table 5, based on the net present value, payback period, and revenue, at the end of the system calculated. It shows that if evaluating the NPV and net cash flows of all scenarios, case 7, with the investment, will produce the optimal results for the microgrid. In comparison of all cases, case 7 is better than others because of the power supplied by the integration of vSMR, solar PV, and wind turbines with BESS to meet the load demand. It is clearly shown that the payback periods of case 6 and case 7 are less than those in the other cases. The payback period and NPV of case 6 are 3.9 years and $19.08 million, and those for case 7 is 3.99 years and $18.24 million, respectively. Case 7 used BESS, and case 6 did without BESS. Case 6 has less payback period and more IRR than case 7 but no more difference between them. There is less difference in the cost between them, but case 7 fulfills the requirement of the load demand, as shown in Table 5.
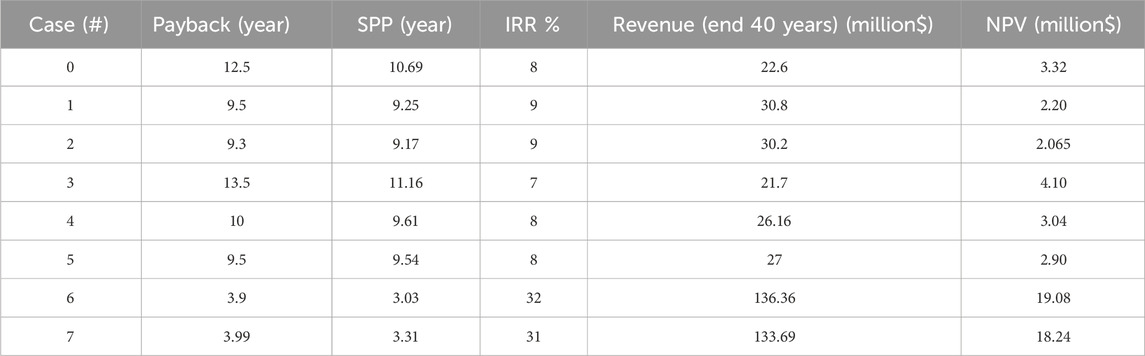
Table 5. Comparison of economic analysis.
6 Conclusion
This study conducted a comprehensive techno-economic analysis that centered on the combination of vSMR, wind turbines, solar PV, and BESS systems. Diverse scenarios, each having unique combinations of energy sources, were simulated to address the load requirements. The study also considered the temporal variations intrinsic to different seasons. The following conclusions can be drawn from all of the scenarios simulated in this study.
• Seasons affect the output power of solar PV and winds differently as varying solar irradiance and wind profile. The solar irradiance is maximum in the spring season and minimum in the winter season. The wind speed is the highest during the summer season and lowest during the winter season. Thus, seasonal variation plays a significant role in combinations involving wind turbines and solar PV systems.
• The average output power of the system is highest during the summer season and lowest during the winter season. Although the average load is also highest during the summer season and the lowest load demand during the spring season, this is mainly due to the higher generation from both wind turbine and solar PV systems.
• Cases 0, 1, 2, and case 6 without BESS do not meet the load demand effectively. Cases 3, 4, and 5 implemented vSMR and renewable energy sources, with BESS, did not meet the load demand. Thus, having BESS provides good stability and reliability for the MG; however, techno-economic limitation constraints limit the feasibility of such systems. Case 6 is economically feasible but technically not viable; however, case 7 is better than all other cases as it fulfills the load demand.
• Although, the capital cost varied from case 0 to case 7, which is $10.5 million to $12.15 million. The payback period, IRR, NPV, and revenue, at end of 40 years of case 7, is 3.99, 31%, $18.24 million, and $133.69 million, respectively.
This shows that using vSMR in microgrids is not only technically feasible, but it is economically attractive with a payback period of merely 4 years. This research shows that the future of energy for microgrids can take multiple paths, ranging from hydrogen storage and large-scale batteries to vSMR.
Data availability statement
The original contributions presented in the study are included in the article/Supplementary Material; further inquiries can be directed to the corresponding authors.
Author contributions
MR: formal analysis, investigation, methodology, validation, visualization, and writing–original draft. MoA: conceptualization, funding acquisition, project administration, and writing–review and editing. AA: funding acquisition, methodology, supervision, and writing–review and editing. ZK: conceptualization, methodology, supervision, writing–original draft, and writing–review and editing. SA: conceptualization, formal analysis, investigation, methodology, project administration, writing–original draft, supervision, and writing–review and editing. MaA: conceptualization, supervision, validation, visualization, and writing–review and editing. UD: formal analysis, visualization, and writing–review and editing.
Funding
The author(s) declare that financial support was received for the research, authorship, and/or publication of this article. The authors extend their appreciation to the Deanship of Scientific Research at Shaqra University for funding this research work through the project number (SU-ANN-2023029).
Acknowledgments
The authors extend their appreciation to the Deanship of Scientific Research at Shaqra University for funding this research work through the project number (SU-ANN-2023029).
Conflict of interest
The authors declare that the research was conducted in the absence of any commercial or financial relationships that could be construed as a potential conflict of interest.
Publisher’s note
All claims expressed in this article are solely those of the authors and do not necessarily represent those of their affiliated organizations, or those of the publisher, the editors, and the reviewers. Any product that may be evaluated in this article, or claim that may be made by its manufacturer, is not guaranteed or endorsed by the publisher.
Abbreviations
ARPA-E, Advanced Research Projects Agency-Energy; BESS, battery energy storage system; DERs, distributed energy resources; DGs, distributed generator; GHGs, greenhouse gases; IRR, internal rate of return; MPPT, maximum power point tracking; MGs, microgrids; SMG, smart microgrid; SPP, simple payback period; NPP, nuclear power plant; NPV, net present value; O&M, operation and maintenance; PV, photovoltaic; P, active power; Q, reactive power; RES, renewable energy sources; SOC, state of charge; vSMR, very small modular Reactors; WT, wind turbine.
References
Acen, P. M., Time, A. R., Energy, A. C., Renewables, A. M. I., Asian, S., and Hoa, K. (2021). ACEN and AMI to pilot battery energy storage system in Vietnam - SolarQuarter. Available at: https://solarquarter.com/2021/10/18/acen-and-ami-to-pilot-battery-energy-storage-system-in-vietnam/.
Arafat, Y., and Van Wyk, J. eVinciTM micro reactor. Pittsburgh, Pennsylvania, United States: Westinghouse.
Atlas, G. W. (2019). Global wind Atlas. Available at: https://globalwindatlas.info/.
Borelli, D., Devia, F., Lo Cascio, E., Schenone, C., and Spoladore, A. (2016). Combined production and conversion of energy in an urban integrated system. Energies 9 (10), 817. doi:10.3390/en9100817
Borhanazad, H., Mekhilef, S., Gounder Ganapathy, V., Modiri-Delshad, M., and Mirtaheri, A. (2014). Optimization of micro-grid system using MOPSO. Renew. Energy 71, 295–306. doi:10.1016/j.renene.2014.05.006
Bull, S. R. (2001). Renewable energy today and tomorrow. Proc. IEEE 89 (8), 1216–1226. doi:10.1109/5.940290
Canada Energy Regulator (2020). Government of Canada, N.E.B. NEB–market snapshot: the cost to install wind and solar power in Canada is projected to significantly fall over the long term. Available at: https://www.cer-rec.gc.ca/nrg/ntgrtd/%0Amrkt/snpsht/2018/11-03cstnstllwnd-eng.html.
Ceran, B., Mielcarek, A., Hassan, Q., Teneta, J., and Jaszczur, M. (2021). Aging effects on modelling and operation of a photovoltaic system with hydrogen storage. Appl. Energy 297, 117161. doi:10.1016/j.apenergy.2021.117161
Cosentino, V., Favuzza, S., Graditi, G., Ippolito, M. G., Massaro, F., Riva Sanseverino, E., et al. (2011). “Transition of a distribution system towards an active network. Part II: economical analysis of selected scenario,” in 3rd Int. Conf. Clean Electr. Power Renew. Energy Resour. Impact, ICCEP 2011, Ischia, Italy, June, 2011, 15–20.
Denholm, P., and Hand, M. (2011). Grid flexibility and storage required to achieve very high penetration of variable renewable electricity. Energy Policy 39 (3), 1817–1830. doi:10.1016/j.enpol.2011.01.019
Denholm, P., and Margolis, R. M. (2007). Evaluating the limits of solar photovoltaics (PV) in electric power systems utilizing energy storage and other enabling technologies. Energy Policy 35 (9), 4424–4433. doi:10.1016/j.enpol.2007.03.004
Engineering (2020). What is the lifespan of a solar panel? Available at: https://www.engineering.com/%0ADesignerEdge/DesignerEdgeArticles/ArticleID/7475/What-Is-the-Lifespan-of-a-Solar-Panel.aspx.
Hassan, Q. (2020). Optimisation of solar-hydrogen power system for household applications. Int. J. Hydrogen Energy 45 (58), 33111–33127. doi:10.1016/j.ijhydene.2020.09.103
Hassan, Q., Jaszczur, M., Abdulateef, A. M., Abdulateef, J., Hasan, A., and Mohamad, A. (2022). An analysis of photovoltaic/supercapacitor energy system for improving self-consumption and self-sufficiency. Energy Rep. 8, 680–695. doi:10.1016/j.egyr.2021.12.021
IEA (2020b) US wind O&M costs estimated at $48,000/MW; Falling costs create new industrial uses. Paris, France: IEA|New Energy.
Investopedia (2021). Internal rate of return (IRR) definition and formula. Available at: https://www.investopedia.com/terms/i/irr.asp.
Iyer, G., Hultman, N., Fetter, S., and Kim, S. H. (2014). Implications of small modular reactors for climate change mitigation. Energy Econ. 45, 144–154. doi:10.1016/j.eneco.2014.06.023
Juan, A. V., Joseph, G. L., and Charles, J. T. (2024) Mobile nuclear power plants for ground operations.
Khalid, M., and Savkin, A. V. (2013). Closure to discussion on ‘A method for short-term wind power prediction with multiple observation points. IEEE Trans. Power Syst. 28 (2), 1898–1899. doi:10.1109/TPWRS.2013.2255351
Kharel, S., and Shabani, B. (2018). Hydrogen as a long-term large-scale energy storage solution to support renewables. Energies 11 (10), 2825. doi:10.3390/en11102825
Ko, W., and Kim, J. (2019). Generation expansion planning model for integrated energy system considering feasible operation region and generation efficiency of combined heat and power. Energies 12 (2), 226. doi:10.3390/en12020226
Kroposki, B., Pink, C., Basso, T., and DeBlasio, R. (2007). “Microgrid standards and technology development,” in 2007 IEEE Power Eng. Soc. Gen. Meet. PES, Tampa, FL, USA, June, 2007.
Kuzlu, M., Pipattanasompom, M., and Rahman, S. (2017). “A comprehensive review of smart grid related standards and protocols,” in ICSG 2017 - 5th Int. Istanbul Smart Grids Cities Congr. Fair, Istanbul, Turkey, April, 2017, 12–16.
Lew, D. J. (2000). Alternatives to coal and candles: wind power in China. Energy Policy 28 (4), 271–286. doi:10.1016/S0301-4215(99)00077-4
Lewis, C., MacSweeney, R., Kirschel, M., Josten, W., Roulstone, T., and Locatelli, G. (2016). Small modular reactors: can building nuclear power become more cost-effective. Cumbria, UK: National Nuclear Laboratory. Available at: https://www.researchgate.net/publication/321715136_Small_modular_reactors_Can_building_nuclear_power_become_more_cost-effective.
Locatelli, G., Boarin, S., Pellegrino, F., and Ricotti, M. E. (2015). Load following with Small Modular Reactors (SMR): a real options analysis. Energy 80, 41–54. doi:10.1016/j.energy.2014.11.040
Mahmud, N., and Zahedi, A. (2016). Review of control strategies for voltage regulation of the smart distribution network with high penetration of renewable distributed generation. Renew. Sustain. Energy Rev. 64, 582–595. doi:10.1016/j.rser.2016.06.030
Malik, M. M., Ali, S., Kazmi, A., Asim, H. W., Ahmed, A. B. I. N., and Shin, D. R. (2020). An intelligent multi-stage optimization approach for community based micro-grid within multi-microgrid paradigm. IEEE Access 8, 177228–177244. doi:10.1109/ACCESS.2020.3022411
Meena Agrawal, A. M. (2014). An appraisal of micro-grid project implementations in the east & south-east Asia. Int. J. Emerg. Trends Engg Dev. 3 (4).
Mone, C., Hand, M., Bolinger, M., Rand, J., Heimiller, D., and Ho, J. (2017). 2015 cost of wind energy review.
Murty, V. V. S. N., and Kumar, A. (2020). Multi-objective energy management in microgrids with hybrid energy sources and battery energy storage systems. Prot. Control Mod. Power Syst. 5 (1), 1–20. doi:10.1186/s41601-019-0147-z
Nejabatkhah, F. (2018). Optimal design and operation of a remote hybrid microgrid. CPSS Trans. Power Electron. Appl. 3 (1), 3–13. doi:10.24295/CPSSTPEA.2018.00001
Nichol, M., and Desai, H. (2019). Cost competitiveness of micro-reactors for remote markets. Washington, DC, USA: Nuclear Energy Institute (NEI).
NREL (2019). NREL national solar radiation Database (NSRDB). Available at: https://maps.nrel.gov/nsrdb-viewer/?aL=x8CI3i%255Bv%255D%3Dt%26Jea8x6%255Bv%255D%3Dt%26Jea8x6%255Bd%255D%3D1%26VRLt_G%255Bv%255D%3Dt%26VRLt_G%255Bd%255D%3D2%26mcQtmw%255Bv%255D%3Dt%26mcQtmw%255Bd%255D%3D3&bL=clight&cE=0&lR=0&mC=4.740675384778373%2C22.8515.
Nwulu, N. I., and Xia, X. (2017). Optimal dispatch for a microgrid incorporating renewables and demand response. Renew. Energy 101, 16–28. doi:10.1016/j.renene.2016.08.026
Parhizi, S., Lotfi, H., Khodaei, A., and Bahramirad, S. (2015). State of the art in research on microgrids: a review. IEEE Access 3, 890–925. doi:10.1109/ACCESS.2015.2443119
Roberts, B. P., and Sandberg, C. (2011). The role of energy storage in development of smart grids. Proc. IEEE 99 (6), 1139–1144. doi:10.1109/JPROC.2011.2116752
incore (2016). Wind turbine cables for wind energy projects - Incore Cables. Int. Energy Agency – IEA, 1–7. Available at: https://www.incore-cables.com/wind-turbine-cables/. (Accessed on January 1, 2024)
World Nuclear Association (2019) Small nuclear power reactors. London, United Kingdom: World Nuclear Association.
Keywords: photovoltaic, wind turbine, nuclear, battery, microgrid, off-grid
Citation: Raza MK, Alghassab M, Altamimi A, Khan ZA, Abbas Kazmi SA, Ali M and Diala U (2024) Integration of very small modular reactors and renewable energy resources in the microgrid. Front. Energy Res. 12:1365735. doi: 10.3389/fenrg.2024.1365735
Received: 04 January 2024; Accepted: 27 March 2024;
Published: 21 May 2024.
Edited by:
Elżbieta Jasińska, Wrocław University of Science and Technology, PolandReviewed by:
Minh Quan Duong, The University of Danang, VietnamMatteo Manganelli, Italian National Agency for New Technologies, Energy and Sustainable Economic Development (ENEA), Italy
Basem Alamri, Taif University, Saudi Arabia
Copyright © 2024 Raza, Alghassab, Altamimi, Khan, Abbas Kazmi, Ali and Diala. This is an open-access article distributed under the terms of the Creative Commons Attribution License (CC BY). The use, distribution or reproduction in other forums is permitted, provided the original author(s) and the copyright owner(s) are credited and that the original publication in this journal is cited, in accordance with accepted academic practice. No use, distribution or reproduction is permitted which does not comply with these terms.
*Correspondence: Mohammed Alghassab, bWFsZ2hhc3NhYkBzdS5lZHUuc2E=; Syed Ali Abbas Kazmi, c2Fha2F6bWlAdXNwY2FzZS5udXN0LmVkdS5waw==