 Feng Wang1
 Yongliang Liang
94% of researchers rate our articles as excellent or good
Learn more about the work of our research integrity team to safeguard the quality of each article we publish.
Find out more
ORIGINAL RESEARCH article
Front. Energy Res. , 10 April 2024
Sec. Sustainable Energy Systems
Volume 12 - 2024 | https://doi.org/10.3389/fenrg.2024.1364528
This article is part of the Research Topic Low-Carbon Oriented Improvement Strategy for Flexibility and Resiliency of Multi-Energy Systems View all 24 articles
In the operation of medium-voltage distribution cables, the local insulation performance may degrade due to inherent defects, environmental influences, and external forces, leading to consecutive self-recovering latent faults in the cables. If not addressed promptly, these faults may escalate into permanent failures. To address this issue, this paper analyzes the development mechanism and characteristics of latent cable faults. A 10kV low-resistance cable latent fault model based on the Kizilcay arc model is built in the PSCAD/EMTDC platform. Furthermore, the paper analyzes and extracts the time-domain, frequency-domain, and time-frequency domain features of fault current samples. Effective fault feature vectors are constructed using multivariate analysis of variance (MANOVA) and Principal Component Analysis (PCA). Based on the fault feature vectors and Extreme Learning Machine (ELM), an intelligent fault identification model for cable latent faults is developed. The initial parameters of the ELM model are optimized using the Particle Swarm Optimization (PSO) algorithm. Finally, the superiority of the proposed model is validated in terms of classification accuracy, training time, and robustness compared to other machine learning algorithms.
Power cables are commonly buried underground, and with the passage of time, factors such as electrical, thermal, and mechanical stress gradually reduce their insulation strength, eventually leading to permanent faults that jeopardize the safe and reliable power supply of urban distribution networks. Operational experience with medium-voltage cables indicates that, prior to the occurrence of permanent faults, transient and self-recovering arc grounding faults may occur at the same location. Due to their short duration (1/4 to four cycles) and small fault currents, traditional overcurrent protection devices with inverse time characteristics fail to activate. In this paper, such faults are referred to as latent cable faults. Timely detection of latent faults in medium-voltage distribution cables and conducting targeted maintenance can effectively prevent their development into permanent faults, thus ensuring the safe and reliable operation of the power system.
The current research approaches for identifying latent cable faults both domestically and internationally primarily involve extracting fault features, constructing threshold criteria for identification, and utilizing data-driven algorithms for recognition. Ref (Sidhu and Xu) proposed two detection algorithms, namely, cable latent fault detection and classification rules based on wavelet analysis, as well as the integration of fault currents and negative sequence currents in the time domain, with the latter being more suitable for single-phase cable latent faults. Ref (Zhou et al.) and (Zhang et al., 2017a) analyzed the characteristics of cable overcurrent caused by various disturbance sources, including short circuit faults, capacitor switching and transformer reclosing, load switching, and motor starting. They utilized feature quantities obtained through wavelet transform decom-position to develop overcurrent detection criteria. Furthermore, based on this foundation, feature extraction and grey relational analysis were employed to calculate the correlation between measured samples and reference samples for identifying latent cable faults. Ref (Fothergill et al., 2011) applied wavelet singularity detection and Bayesian change point analysis to detect the current signals of cable latent faults, extract frequency do-main feature vectors, and achieve classification and recognition of cable latent faults using probabilistic neural networks and support vector machines, respectively. In ref (Mousavi and Butler-Purry), the empirical mode decomposition (EMD) method was utilized to extract transient features, and the ant colony algorithm and fuzzy neural network were applied for fault classification in distribution network cables. Ref (Faisal et al., 2012) introduced a latent fault identification method that relies on time-domain characteristics. This method involved obtaining the time-frequency characteristics of fault currents and voltages through S-transform analysis and subsequently detecting latent faults. Ref (Mousavi and Butler-Purry, 2009) proposed a latent fault detection and classification method based on a rule-oriented support vector ma-chine. Addressing the challenge of distinguishing load transients from latent faults, Ref (Mousavi et al., 2003) presented a methodology that employed wavelet packet analysis for extracting waveform features. This approach integrated three signal processing techniques, namely, principal component analysis, linear discriminant analysis, and feature subset classification, in conjunction with the k-nearest neighbor algorithm for fault type identification. Ref (Sidhu and Xu, 2010) introduced two detection algorithms rooted in wavelet analysis and time-domain fault current characteristics. These algorithms established latent fault detection rules and thresholds, enabling the identification and classification of latent faults. Notably, only a limited number of studies have ventured into modeling latent faults. Ref (Mousavi and Butler-Purry, 2010) harnessed self-organizing mapping (SOM) technology for numerical modeling of latent faults. During the modeling process, specific energy features in the wavelet domain were obtained and employed. Ref (Zhang et al., 2017b) adopted the Kizilcay arc model to simulate cable latent faults but did not account for the influence of latent faults on the model.
However, whether it is machine learning algorithms or the more widely used deep learning approaches in recent years, they are fundamentally data-driven algorithms. Data-driven algorithms, especially deep learning algorithms, have higher requirements for the scale and quality of samples. They excessively rely on samples, and when the sample size is insufficient or the quality is poor, they often struggle to achieve desirable results.
In summary, this paper establishes a cable latent fault model based on the Kizilcay arc model in the PSCAD/EMTDC platform, which effectively characterizes the features of cable latent faults. By conducting batch simulations to obtain fault phase current samples, various analyses including time-frequency, frequency-domain, and time-frequency domain are performed to extract multi-dimensional and multi-domain fault features, constructing initial feature vectors. Multivariate analysis of variance is utilized to select features, retaining effective features and constructing feature vectors. Principal Component Analysis is employed to process the feature vectors, significantly reducing the dimensionality while retaining the maximum amount of effective information from the original features. An intelligent diagnosis model based on Extreme Learning Machine (ELM) is established, and the Particle Swarm Optimization (PSO) algorithm is introduced to optimize its generalization capability. Case study results demonstrate that the cable latent fault identification model based on Extreme Learning Machine outperforms other machine learning algorithms in terms of fault recognition performance.
Latent faults in cables are often characterized by low energy and short duration intermittent arc faults. Therefore, this paper employs the Kizilcay arc model (Kizilcay and Pniok, 2007), (Idarraga et al.) to represent latent faults in cables. The Kizilcay arc model, based on the energy balance theory and control theory, provides a concise and accurate representation of arc fault characteristics, and it has been widely applied in recent research (Wang et al., 2021). This model con-siders the arc ignition process and assumes a constant length for the main arc while the length of the secondary arc linearly increases over time.
The mathematical expression of the Kizilcay arc model is as follows:
where τ is the time constant, G is the arc static equivalent conductance, which can be understood as the arc conductance value when the current remains stable for a long time under external conditions. It is a function of the arc forward current if and the static arc voltage ust(t), as shown in Eq. 2. g is the arc instantaneous conductance and is related to the arc instantaneous resistance according to the quantity relationship de-scribed in Eq. 3.
The static arc voltage ust(t) satisfies:
where u0 is the characteristic voltage of the arc, and r0 is the characteristic resistance of the arc.
Substituting Eqs 2–4 into Eq. 1, the complete formulation of the Kizilcay dynamic arc model can be obtained.
As mentioned earlier, cable latent faults are often developed from water trees and electrical trees. Using only the arc model is insufficient to accurately characterize the characteristics of latent faults. Therefore, the unburned portions of the water tree and electrical tree channels are equivalently represented as constant resistances, which are connected in series with the arc model to provide a better description of latent faults. The equivalent model of cable latent faults is illustrated in the following figure.
As shown in Figure 1, the latent fault of medium-voltage distribution cables is considered as a series connection of the arc resistance Rarc and the equivalent resistance R0 of the defect channel. Therefore, the model of cable latent faults can be expressed as follows:
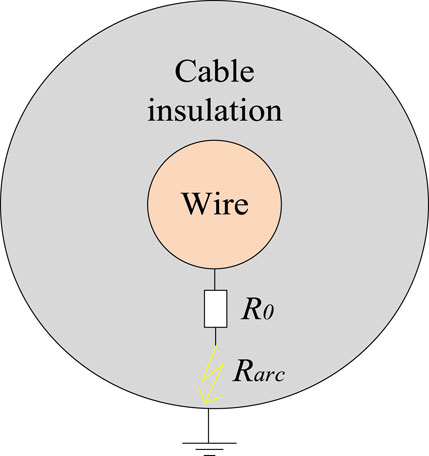
Figure 1. Schematic diagram of equivalent model of cable latent fault.
Where uf is the voltage of the latent fault in the cable, and if is the current of the latent fault.
This paper establishes a typical low-resistance grounded medium-voltage cable distribution system, as shown in Figure 2, using the Bergeron cable model in the PSCAD platform. The power supply voltage is 110 kV, which is stepped down to 10 kV through a distribution transformer, and connected to three cable feeders. The specific cable parameters are provided in Table 1.

Figure 2. Schematic diagram of 10 kV cable distribution system.
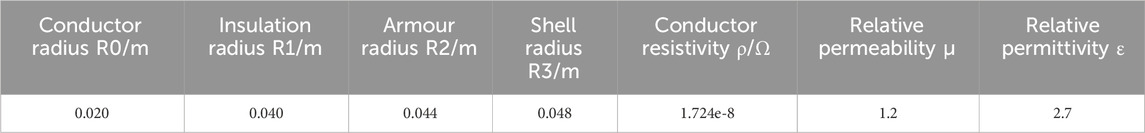
Table 1. Cable parameters.
Time-domain feature statistics include dimensional and dimensionless features, which describe fault characteristics from different perspectives and enable fault classification. In this study, a total of nine time-domain feature statistics were extracted, including five dimensional features and four dimensionless features, as listed in Table 2.
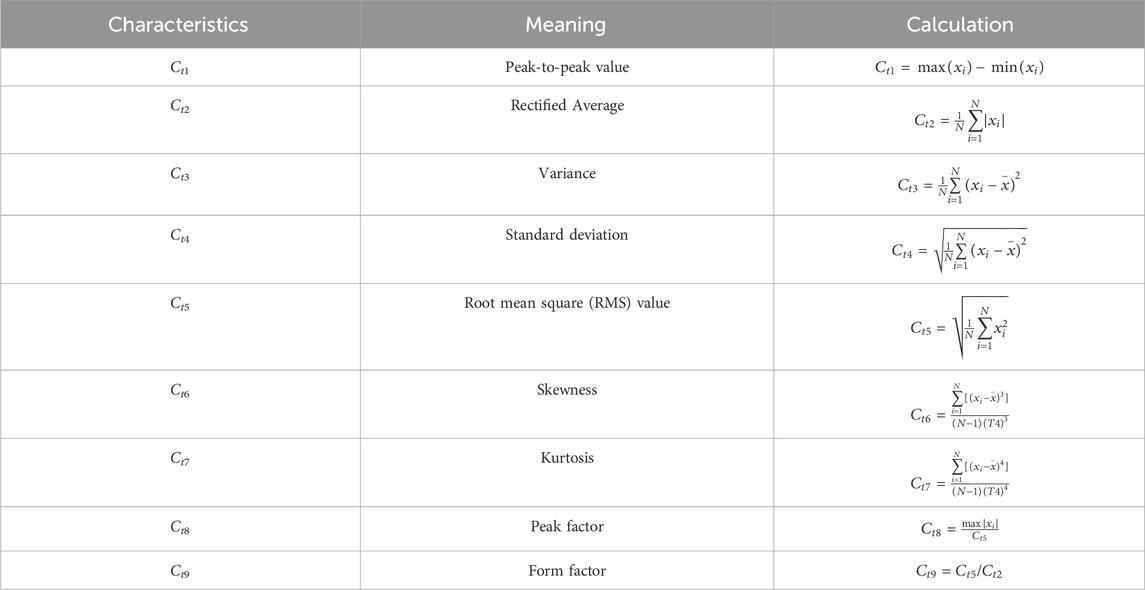
Table 2. Time-domain feature.
The aforementioned nine statistical features form the time-domain feature vector:
The fault phase current signal is subjected to spectral analysis to obtain the frequency components of the signal, thereby extracting the frequency-domain features. In this paper, a total of four frequency-domain features are extracted, including centroid frequency, average frequency, root mean square frequency, and frequency standard deviation. The specific meanings of each feature are listed in Table 3.
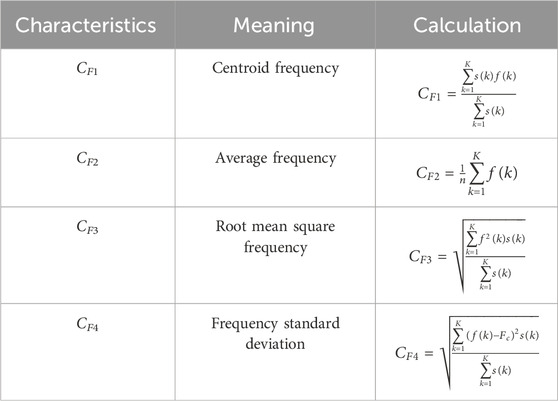
Table 3. Frequency-domain feature.
The aforementioned nine statistical features form the time-domain feature vector:
The stationary wavelet transform, employing the “zero-padding” method during signal decomposition and reconstruction, exhibits translation invariance, ensuring that the decomposed approximation and detail coefficients at each level have the same length as the original signal. (Wang et al., 2021). This preserves the transient features of the original signal to the maximum extent. Based on this, in this paper, time-frequency domain feature extraction of cable latent faults and other transient disturbances is achieved by calculating the energy and performing statistical analysis on the wavelet coefficients obtained through the stationary wavelet transform (Li, 2021; Wu and Wang, 2022).
The formulas for obtaining the low-frequency approximation coefficients aj,n and high-frequency detail coefficients dj,n at each level through the stationary wavelet transform are as follows:
In the equations, i is the sample point index within the window, j denotes the level of wavelet coefficients, and n represents the discretization level of the wavelet function.
For the jth level wavelet coefficients sj = [s1j, s2j, … sNj] obtained from the stationary wavelet transform, three feature statistics are constructed: energy, energy entropy, and information entropy. The specific meanings of each feature are listed in Table 4.
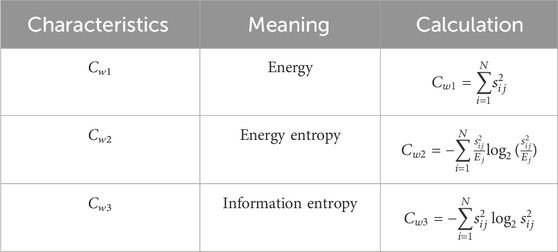
Table 4. Frequency -domain feature.
The above three features constitute the time-frequency domain feature vector.
Taking the A-phase current of each fault type as an example, the 9-dimensional time-domain feature vector Cti is calculated as described earlier. The 4-dimensional frequency-domain feature vector CFi is obtained by performing spectral analysis on Cti. The A-phase current is then subjected to 3-level stationary wavelet transform using the dB4 mother wavelet. Each level’s subbands are divided into five equal intervals of 0.02s, corresponding to the power frequency period. Within each interval, three feature values are computed, resulting in a total of 60-dimensional time-frequency feature vector Cwi By combining the feature vectors from the three domains, a 73-dimensional feature vector [Cti, CFi, Cwi] is constructed for each fault sample. This process is repeated for each fault type, resulting in a fault feature matrix of size (number of fault samples) × 73 for each class of faults.
Multivariate analysis of variance (MANOVA) is a statistical theory and method for studying the relationships between multiple independent variables and multiple de-pendent variables. It is applicable when the independent variables simultaneously in-fluence two or more dependent variables. MANOVA is used to analyze whether there are significant differences in the means of these dependent variables when the independent variables are at different levels (Wu and Wang, 2022). Furthermore, to specifically analyze the significance levels of each dependent variable, univariate analysis of variance (ANOVA) needs to be conducted for each dependent variable. In univariate ANOVA, the significance of the differences between independent variables and a specific dependent variable is evaluated using the output parameters p and the test statistic F. Typically, if the F value is large and p < the significance level (usually set at 0.05), the significance level of that dependent variable is considered significant (Liu et al., 2022).
The 73-dimensional features were subjected to individual one-way analysis of variance (ANOVA), resulting in the identification of 21 significant features. The corresponding p-values and F-values for each feature are presented in Table 5.

Table 5. Parameter table of 21-dimensional effective features.
Principal Component Analysis (PCA) aims to minimize information loss by per-forming an orthogonal transformation on a set of potentially correlated variables, resulting in a new set of linearly independent variables called principal components. The fundamental idea behind PCA is to represent the amount of information contained in each principal component using their respective variances. A higher variance indicates a greater amount of information contained in the corresponding principal component. The basic steps of PCA involve standardizing the original data, computing the correlation matrix, calculating the eigenvalues and eigenvectors, and determining the variance contribution. Finally, the selection of principal components is made based on these considerations (Huckemann et al., 2010).
The variance of the principal components is an important criterion for selecting the principal components (Huang et al., 2021). The variance contribution rate and cumulative variance contribution rate of the ith principal component are defined by Eqs 11, 12 respectively. The variance contribution rate represents the extent to which the principal component reflects the original sample information, with a higher contribution rate indicating a greater reflection of sample information.
The 21-dimensional features selected through multivariate analysis of variance were subjected to principal component analysis (PCA) for dimensionality reduction. By considering eigenvalues greater than one and achieving a cumulative contribution rate of 95%, PCA reduced the feature vectors to five dimensions. The original 21-dimensional feature vectors were replaced by the feature vectors composed of the first five principal components, significantly reducing the dimensionality while retaining the effective information from the original features to the maximum extent. The weights of each principal component and the cumulative variance contribution rate are shown in Table 6 and Figure 3, respectively.
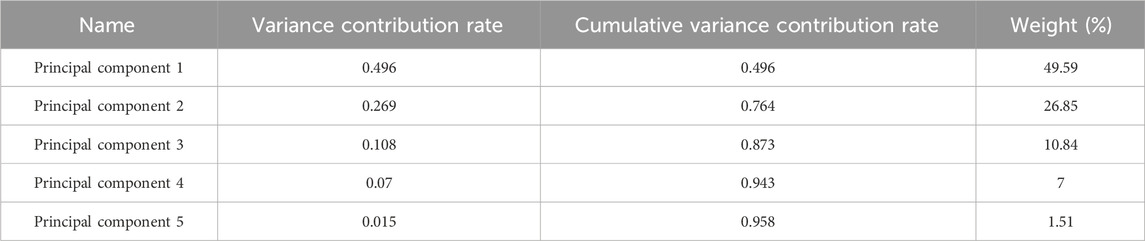
Table 6. Weight results of each component.
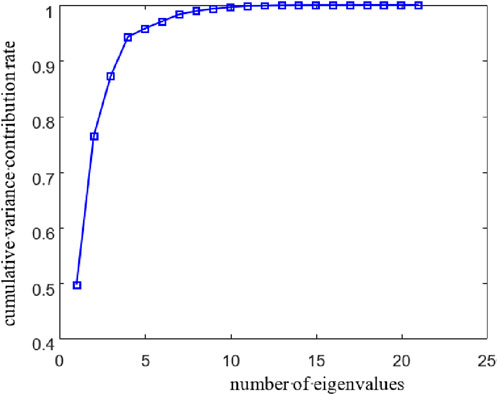
Figure 3. The number of eigenvalues and cumulative variance contribution rate of PCA.
Extreme Learning Machine (ELM) is a machine learning algorithm used for training Single Hidden Layer Feedforward Neural Networks (SLFNs) (Qian et al., 2023). Its basic principles are as follows:
Given input samples {(xi,ti),i = 1,2, … ,N}, where N represents the number of samples, xi = { xi1, xi2, … , xim}T and ti = { ti1, ti2, … , tim}T denote the input vector and corresponding sample label of the ith sample, respectively (Liu et al., 2023). For a single hidden layer feedforward neural network with L hidden nodes, its network structure is shown in the Figure 4.
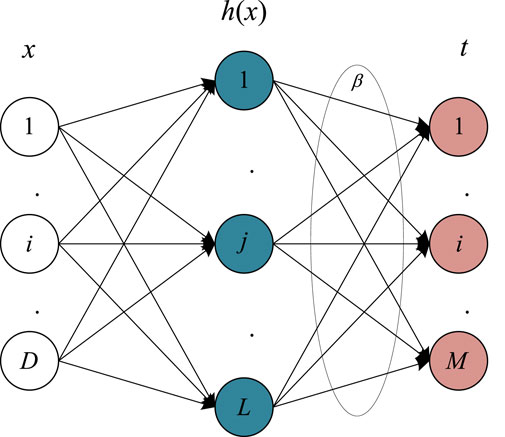
Figure 4. Network structure of ELM.
Particle Swarm Optimization (PSO) algorithm is a population-based intelligent evolutionary computation method that simulates the foraging behavior of birds (Wang P. et al., 2023). It utilizes the collaborative behavior of a bird swarm to achieve optimal population search. In this study, the PSO algorithm is employed to optimize the random initial parameters of the ELM model (Wang D. et al., 2023; Gao, 2023).
The basic steps of the PSO algorithm are as follows:
1. Initialization of particle population: A set of particles is randomly generated, and the initial velocities v0 and positions x0 of each particle are randomized
2. Computation of fitness values for each particle: The fitness value of each particle is calculated. Additionally, the individual best (Pbest) and global best (Gbest) values are computed and recorded along with the corresponding particle positions.
3. Iterative updates: The velocities and positions of each particle are updated ac-cording to Eqs 13, 14. After each update, the fitness value is recalculated, and the updated particle fitness value is compared with the fitness value at the historical best position to determine the optimal fitness value.
Thus, this paper presents a data-driven latent fault identification model based on ELM (Extreme Learning Machine). The overall training process of the model is illustrated in Figure 5.

Figure 5. Construction process of fault identification model based on data-driven.
The five types of faults described earlier correspond to their respective fault labels, which need to be converted into vector labels when training the ELM model, as shown in Table 7.
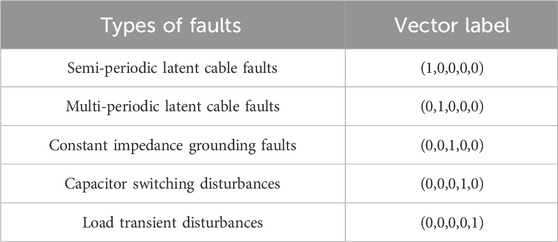
Table 7. Fault type and its corresponding vector label.
After applying principal component analysis (PCA) to the extracted multi-dimensional fault features, the dimension was reduced to 5. Consequently, the ELM model was configured with five input layer nodes and five output layer nodes. The hidden layer activation function was set to the Sigmoid function, and the number of hidden layer nodes was determined as 11. For the output vector, the softmax function was used as the activation function to normalize it, ensuring that each output element in the vector is between 0 and 1. The values represent the probability of the input data be-longing to each fault type. In the PSO optimization algorithm, the learning factors c1 and c2 were both set to 1.5, and the number of iterations was set to 1,000. The optimization results are shown in Figure 6. The model training reached its optimal state when the number of iterations reached 815. Initially, due to the random initialization of weights and thresholds in the ELM model, the error was large. However, as the training progressed, the fitness function rapidly decreased.
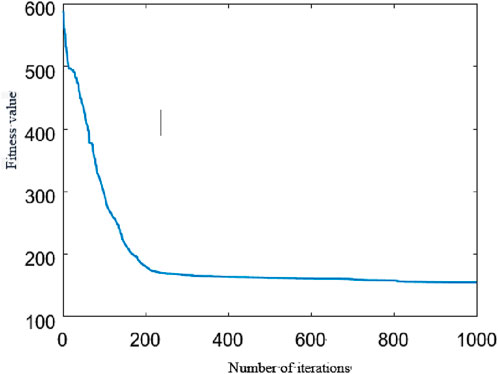
Figure 6. Fitness curve of ELM model.
Figure 7 presents the confusion matrix of the ELM model for fault classification on the training and testing sets, with classification accuracies of 91.02% and 88.87%, respectively. These results demonstrate that the proposed data-driven ELM-based cable latent fault identification model exhibits good classification performance. Although the overall classification accuracy is satisfactory, it can be observed from the classification results that the data-driven model for medium-voltage cable latent fault identification tends to misclassify serious faults such as constant impedance grounding faults as cable latent faults or transient disturbances. This limitation implies that the safety of the model’s output results cannot be fully guaranteed, which is an inherent drawback of data-driven algorithms.
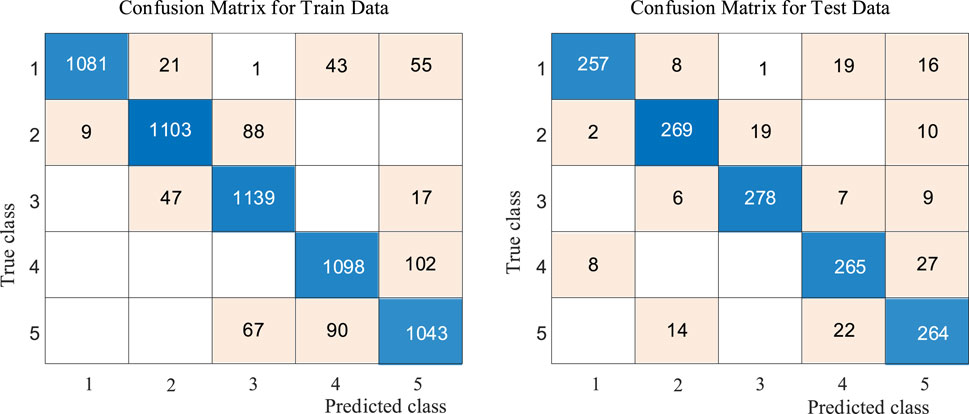
Figure 7. Confusion matrix of classification results on training set and test set.
To validate the effectiveness of the proposed cable incipient fault identification method based on the ELM model, it was compared with the SVM classification model optimized by ten-fold cross-validation and the KNN model.
Similarly, for each type of fault mentioned earlier, 1,200 sets of samples were randomly selected, with 80% of samples used for training and the remaining 20% used for testing. The fault classification based on SVM was implemented using the libSVM software package, while the KNN algorithm was implemented using the MATLAB KNN function. The classification accuracies of the three models are shown in Table 8.
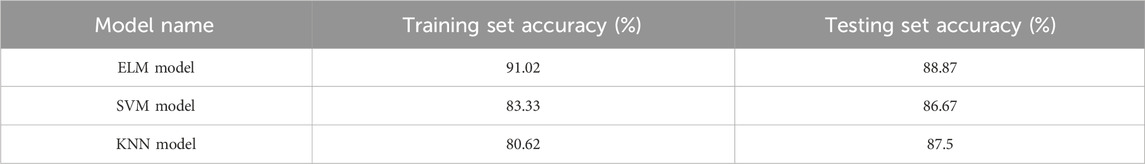
Table 8. Comparison of fault classification models based on ELM, SVM and KNN.
From the accuracy values in Table 8, it can be observed that all three classification models achieve classification accuracies above 85% on the test set, validating the effectiveness of the extracted and optimized feature vectors proposed in this study. Furthermore, the ELM model demonstrates higher overall classification accuracy on the test set compared to the SVM and KNN-based classification models. Additionally, due to the absence of hidden layer parameter updates, the ELM model exhibits significantly lower training time compared to the SVM and KNN models.
To simulate real-world field data, Gaussian white noise with signal-to-noise ratios (SNRs) of 40dB, 30dB, and 20dB was added to the raw data of each fault type to evaluate the model’s noise resistance. Figure 8 shows the current signal of the half-wave cable incipient fault with 30dB Gaussian white noise added.
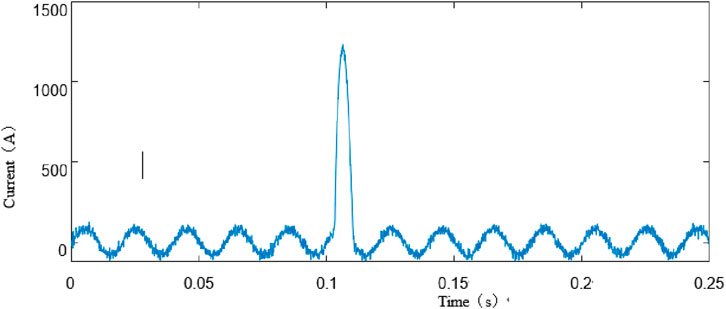
Figure 8. Cable latent fault current waveform after adding white noise.
Table 9 presents the accuracy of the three classification models after adding Gaussian white noise with three different signal-to-noise ratios. As observed from the table, the accuracy of all three classification models decreases with decreasing signal-to-noise ratio. This can be attributed to two main factors. Firstly, a lower signal-to-noise ratio indicates a higher level of noise contamination, resulting in more severe distortion of the original signal waveform and subsequently masking the under-lying features. Secondly, the transient processes of the five fault types already exhibit relatively small differences, and the introduction of noise further reduces the distinguishability among them, leading to a decrease in the discriminative power of the extracted features.
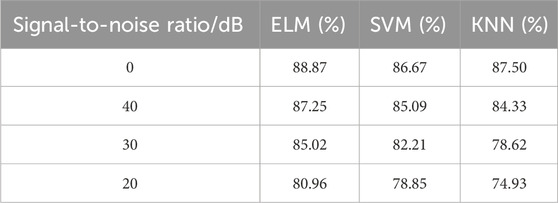
Table 9. Comparison of fault classification models based on ELM, SVM and KNN.
As shown in Table 9, among the three classification models, KNN exhibits the largest decrease in accuracy, with its accuracy dropping below 75% at a signal-to-noise ratio of 20dB. SVM shows a relatively slower decline in classification accuracy, with its accuracy only falling below 80% under the influence of 20dB signal-to-noise ratio. Although ELM also experiences a decrease in accuracy, its classification performance re-mains superior to the other two neural network models under the same level of noise interference, consistently maintaining an accuracy above 80%.
Considering this evaluation metric, the PSO-optimized ELM model demonstrates good identification performance for cable latent faults even in the presence of signal noise interference.
This paper utilizes arc simulation to investigate latent faults in medium-voltage distribution cables. Based on the Kizilcay arc model and utilizing fault samples obtained through batch simulations in PSCAD, the study conducts time-frequency, frequency-domain, and time-frequency domain analyses to extract multi-dimensional and multi-domain fault features. Subsequently, multivariate analysis of variance and Principal Component Analysis are employed to optimize the features. Finally, an intelligent diagnosis model for latent faults in medium-voltage distribution cable networks is established based on Extreme Learning Machine (ELM). The following conclusions are drawn from the analysis and simulation experiments.
(1) The series connection of constant resistors using the Kizilcay arc model effectively simulates the characteristics of latent faults in medium-voltage distribution networks, providing favorable sample conditions for model training.
(2) The optimization and selection of initial feature vectors using multivariate analysis of variance and Principal Component Analysis improve the correlation between features, eliminate redundant information, and reduce the workload of model training and learning.
(3) Particle Swarm Optimization is utilized to optimize the random initial parameters of the ELM model, reducing the number of iterations required for model solution and improving the fitting capability of the model.
(4) Experimental results demonstrate that the Extreme Learning Machine model established in this paper outperforms SVM and KNN models in terms of classification accuracy. Additionally, to simulate actual field data, Gaussian white noise with signal-to-noise ratios of 40dB, 30dB, and 20dB is added to original fault samples to compare the robustness of the three models. The results show that the classification accuracy of the ELM model is consistently higher than that of the SVM and KNN models, confirming the robustness of the fault identification model based on Extreme Learning Machine established in this paper.
Next steps will involve researching fault location on the basis of latent fault identification in cables, aiming to reduce fault repair time and enhance the safety and stability of distribution network operation.
The original contributions presented in the study are included in the article/Supplementary material, further inquiries can be directed to the corresponding author.
FW: Writing–review and editing. PZ: Writing–review and editing. JL: Writing–review and editing. ZL: Writing–original draft, Writing–review and editing. MZ: Writing–review and editing. YL: Writing–original draft, Writing–review and editing. GS: Writing–review and editing. XY: Writing–review and editing.
The author(s) declare financial support was received for the research, authorship, and/or publication of this article. This work was supported by State Grid Shandong Electric Power Company Science and Technology Project Funding (520626230044). The funder was not involved in the study design, collection, analysis, interpretation of data, the writing of this article, or the decision to submit it for publication.
The authors acknowledge the reviewers for providing valuable comments and helpful suggestions to improve the manuscript.
Author JL was employed by State Grid Shandong Electric Power Company.
The remaining authors declare that the research was conducted in the absence of any commercial or financial relationships that could be construed as a potential conflict of interest.
All claims expressed in this article are solely those of the authors and do not necessarily represent those of their affiliated organizations, or those of the publisher, the editors and the reviewers. Any product that may be evaluated in this article, or claim that may be made by its manufacturer, is not guaranteed or endorsed by the publisher.
Faisal, M. F., Mohamed, A., and Shareef, H. (2012). Prediction of incipient faults in underground power cables utilizing S-transform and support vector regression. Int. J. Electr. Eng. Inf. 4, 186–201. doi:10.15676/ijeei.2012.4.2.1
Fothergill, J. C., Dodd, S. J., Dissado, L. A., Liu, T., and Nilsson, U. (2011). The measurement of very low conductivity and dielectric loss in XLPE cables: a possible method to detect degradation due to thermal aging. IEEE Trans. Dielectr. Electr. Insulation 18 (05), 1544–1553. doi:10.1109/tdei.2011.6032823
Gao, L. (2023). Research on reactive power optimization of distribution network with DG based on improved PSO. Electr. Switchg. 61 (02), 18–20+25. doi:10.27733/d.cnki.gsxlg.2023.000045
Huang, J. S., Yao, S., and Shu, H. C. (2021). Fault line selection method for distribution networks based on principal component analysis and SVM model. J. Kunming Univ. Sci. Technol. Nat. Sci. Ed. 46 (04), 64–75. doi:10.16112/j.cnki.53-1223/n.2021.04.451
Huckemann, S., Hotz, T., and Munk, A. (2010). Intrinsic MANOVA for riemannian manifolds with an application to kendall's space of planar shapes. IEEE Trans. Pattern Analysis Mach. Intell. 32 (04), 593–603. doi:10.1109/tpami.2009.117
Idarraga, O. G., Cubillos, D., and Ibanez, L. “Analysis of arcing fault models,” in Proceedings of the 2008 IEEE/PES Transmission and Distribution Conference and Exposition: Latin America, Bogota, Colombia, August 2008, 1–5.
Kizilcay, M., and Pniok, T. (2007). Digital simulation of fault arcs in power systems. Eur. Trans. Electr. Power 1 (1), 55–60. doi:10.1002/etep.4450010111
Li, Y. K. (2021). Detection system-on-chip (SoC) and recognition method for low-voltage AC series arc faults based on hardware discrete wavelet transform. Zhejiang University. doi:10.27461/d.cnki.gzjdx.2021.002031
Liu, K. Y., Zhan, H. Y., and Tan, Y. Y. (2023). Detection of high-resistance ground faults in distribution networks based on improved extreme learning machine. Power Syst. Technol. 47 (05), 1886–1899. doi:10.13335/j.1000-3673.pst.2022.1908
Liu, W. B., Qi, J. Y., and Shao, W. Z. (2022). Topological identification of phase relations in low-voltage distribution networks based on principal component analysis and graph theory. J. Qilu Univ. Technol. 36 (03), 59–65. doi:10.16442/j.cnki.qlgydxxb.2022.03.009
Mousavi, M. J., and Butler-Purry, K. L. (2009). A novel condition assessment system for underground distribution applications. IEEE Trans. Power Syst. 24, 1115–1125. doi:10.1109/tpwrs.2009.2022977
Mousavi, M. J., Butler-Purry, K. L., Gutierrez-Osuna, R., and Najafi, M. (2003). Classification of load change transients and incipient abnormalities in underground cable using pattern analysis techniques. IEEE PES Transm. Distribution Conf. Expo. 1, 175–180. IEEE Cat No 03CH37495. doi:10.1109/TDC.2003.1335177
Mousavi, M. J., and Butler-Purry, K. L. (2010). Detecting incipient faults via numerical modeling and statistical change detection. IEEE Trans. Power Deliv. 25, 1275–1283. doi:10.1109/tpwrd.2009.2037425
Mousavi, M. J., and Butler-Purry, K. L. “A novel condition assessment system for underground distribution applications,” in Proceedings of the IEEE PES T&D 2010, New Orleans, LA, USA, August 2010, 1–1.
Qian, Y. N., Zhao, W., and Zhang, P. C. (2023). Fault localization in distribution networks based on extreme learning machine and wavelet transform. Inf. Technol. 47 (03), 177–183. doi:10.13274/j.cnki.hdzj.2023.03.033
Sidhu, T. S., and Xu, Z. “Detection and classification of incipient faults in underground cables in distribution systems,” in Proceedings of the 2009 Canadian Conference on Electrical and Computer Engineering, St. John's, NL, Canada, May 2009, 122–126.
Sidhu, T. S., and Xu, Z. (2010). Detection of incipient faults in distribution underground cables. IEEE Trans. Power Deliv. 25, 1363–1371. doi:10.1109/tpwrd.2010.2041373
Wang, D., Li, W. H., and Li, S. Z. (2023b). Dynamic optimization method for energy saving and loss reduction in industrial park distribution network based on load measurement. Ind. Heat. 52 (06), 49–53. doi:10.3969/j.issn.1002-1639.2023.06.012
Wang, F., Quan, X. Q., and Ren, L. T. (2021). A comprehensive review of research on detection and identification methods for power quality disturbances. Proc. Chin. J. Electr. Eng. 41 (12), 4104–4121. doi:10.13334/j.0258-8013.pcsee.201261
Wang, P., Cheng, X. L., and Wang, Y. (2023a). Construction of an intelligent distribution network hierarchical planning model based on hybrid particle swarm optimization. Electr. Autom. 45 (03), 68–70+73. doi:10.3969/j.issn.1000-3886.2023.03.021
Wu, C. Y., and Wang, L. T. (2022). Fault location for transmission lines based on stationary wavelet transform. Electr. Autom. 44 (03), 100–102. doi:10.3969/j.issn.1000-3886.2022.03.031
Zhang, W., Xiao, X., Zhou, K., Xu, W., and Jing, Y. (2017a). Multicycle incipient fault detection and location for medium voltage underground cable. IEEE Trans. Power Deliv. 32 (03), 1450–1459. doi:10.1109/tpwrd.2016.2615886
Zhang, W., Xiao, X., Zhou, K., Xu, W., and Jing, Y. (2017b). Multicycle incipient fault detection and location for medium voltage underground cable. IEEE Trans. Power Deliv. 32, 1450–1459. doi:10.1109/tpwrd.2016.2615886
Keywords: cable incipient fault, feature extraction, data-driven, extreme learning machine, particle swarm optimization
Citation: Wang F, Zhang P, Li J, Li Z, Zhao M, Liang Y, Su G and You X (2024) Multi-feature based extreme learning machine identification model of incipient cable faults. Front. Energy Res. 12:1364528. doi: 10.3389/fenrg.2024.1364528
Received: 20 February 2024; Accepted: 18 March 2024;
Published: 10 April 2024.
Edited by:
Rufeng Zhang, Northeast Electric Power University, ChinaReviewed by:
Zhihua Zhang, China University of Petroleum, ChinaCopyright © 2024 Wang, Zhang, Li, Li, Zhao, Liang, Su and You. This is an open-access article distributed under the terms of the Creative Commons Attribution License (CC BY). The use, distribution or reproduction in other forums is permitted, provided the original author(s) and the copyright owner(s) are credited and that the original publication in this journal is cited, in accordance with accepted academic practice. No use, distribution or reproduction is permitted which does not comply with these terms.
*Correspondence: Zhiqi Li, MjAyMjM0NzE0QG1haWwuc2R1LmVkdS5jbg==
Disclaimer: All claims expressed in this article are solely those of the authors and do not necessarily represent those of their affiliated organizations, or those of the publisher, the editors and the reviewers. Any product that may be evaluated in this article or claim that may be made by its manufacturer is not guaranteed or endorsed by the publisher.
Research integrity at Frontiers
Learn more about the work of our research integrity team to safeguard the quality of each article we publish.