 Linjun Cai
 Dongliang Xie
- State Grid Electric Power Research Institute, Nanjing, China
Introduction: In order to promote the consumption of renewable energy, reduce carbon emissions, and take into account the uncertainty of renewable energy output and load fluctuations in the new power system that can affect the normal operation of market mechanism, a two-stage low-carbon optimization scheduling method for power system that considers demand response under multiple uncertainties is proposed in this paper.
Methods: Uncertain scene sets are generated through Latin hypercube sampling and heuristic synchronous backpropagation method is used to reduce scenes to obtain typical scenes and their probabilities. Then, a one-stage optimization model is established with the goal of maximizing energy efficiency and corresponding demand response strategies are obtained. Green certificate carbon trading joint mechanism model consisting of tiered green certificate trading and time-sharing tiered carbon trading are established, and the output of two-stage units are optimized with the goal of minimizing comprehensive operating costs.
Result: The simulation results show that the carbon emissions are decreased by 251.57 tons, the consumption rate of renewable energy is increased by 8.64%, and the total costs are decreased by 124.0612 million yuan.
Discussion: From this, it can be seen that the dual layer low-carbon optimization scheduling strategy for power system considering demand response under multiple uncertainties can effectively reduce the operating costs and carbon emissions of the system, while balancing the economic and environmental aspects of power system operation.
1 Introduction
The growing prevalence of renewable energy (RE) poses numerous challenges for the power system, including issues related to reliability, efficiency, energy loss, and emissions (Jordehi, 2019; Liu et al., 2020a). Simultaneously, with the development of the electricity market, consumer engagement in the demand-side response is increasing. Hence, the achievement of power system optimization dispatch with the consideration of the demand response (DR) under the dual-carbon target requirements has become a current research hotspot (Wang et al., 2018).
The optimal dispatch of a power system is widely employed across various operational scopes, spanning from real-time execution to long-range planning. Liu et al. (2021) considered the interaction between power generation and consumption the basis in a comprehensive optimization dispatch model, and three different scheduling commands were proposed before electric vehicle (EV) charging and discharging, such as stochastic scheduling command, load interruption, and transfer command. Zhang and Zheng (2019) presented a dynamic multiple target optimal scheduling method for the electrical system, including economics, pollutant emissions, and power rejections. Wan et al. (2020) employed an improved MOEA/D algorithm to overcome the optimization dispatch problem of the hierarchical model, in which the load-side demand was considered. Li and Xu (2018) developed a globally optimal scheduling strategy for microgrids under grid connection and islanding conditions. Jiang et al. (2020) established a hierarchical scheduling model based on the boundary variable feasible domain-coordinated power system and district heating system operators. A conservative boundary variable feasible domain-based approximation method was provided for a district heating system based on simplex approximation. Hou et al. (2020) employed a multi-objective optimal method and fuzzy membership function approach to overcome the transferable loads and other distributed generation models in microgrids. Liu J. et al. (2020) proposed a multi-task power scheduling method by introducing a multi-objective multi-factor optimization algorithm. Zhang et al. (2018) established a two-phase robust optimal mold, accounting for the uncertainty associated with distributed RE and DR within power systems. This served as the basis for proposing a coordinated optimal operational strategy. Yang et al. (2021) developed a coordinated interval optimization scheduling method by taking into account the uncertainty of RE. However, the scheduling scheme obtained through the robust approach is too conservative, while interval optimization based on interval mathematics still encounters the limitations of complex model-solving techniques and too large interval values. Therefore, by sampling a considerable number of error scenarios for the assumed probability distributions of random variables, the scenario approach is used to describe the uncertainty, which has a more intuitive model and yields highly accurate computational results.
Moreover, utilizing market mechanisms for carbon dioxide transaction offers advantages of flexibility and benefit. By optimizing the allocation of resources within the carbon emission space and aligning with economic incentives, carbon emission trading mechanisms facilitate the trading of carbon credits while maintaining a constant total carbon emission volume (Hou et al., 2023; Yang et al., 2023; Zhong et al., 2023). Considering the uncertainty of RE generation and customer price responses, a two-stage integrated planning and DR model was proposed by Zeng et al. (2014). The method facilitated the transition from RE generation to low-carbon distribution systems through multiple probability scenario representations, thereby establishing a low-carbon distribution system. To resolve the model, the optimal scheduling approach about suppositional electricity plants incorporated both the carbon dioxide transaction market and green certificate transaction market, alongside the proposal of a self-concluding variational particle swarm optimization approach by Zhang et al. (2023). Considering the generalized electric–heat DR, Cui et al. (2022) proposed a scheduling method of an energy system with source–load coordination. By combining the organic Rankine cycle and DR for electric heating, the difficulty caused by an inadequate carbon capture level over spike load periods in the low-carbon transformation procedure of thermal power units has been improved. Leveraging the enhanced two-stage electric gas operation model and the comprehensive thermoelectric DR model within the constructed electric hydrogen production device, Chen et al. (2023) developed a scheduling method of multiple energy production involving electricity and hydrogen on the basis of short-period wind power forecasting. It is noteworthy that the variational mode decomposition and gated recurrent unit approach enhances the exactitude of very short-period wind power generation prediction. Dong et al. (2022) developed a deep reinforcement learning-based energy scheduling strategy using the double-delay depth-determined strategy gradient approach to resolve low-carbon mathematical and multi-objective optimization models. The model involves cogeneration units, carbon capture systems, and electricity-to-gas units. The prevalent carbon trading mechanisms in current research within carbon and green certificate trading markets solely focus on the carbon emission quota trading system across the entire daily cycle timeframe. The green certificate transaction market solely accounts for the fixed green certificate transaction parameter costing model, limiting its maximal potential efficacy.
DR serves as a pivotal mechanism for ensuring the safety and steadiness of the power system by harmonizing equilibrium between supply and demand. To enhance operational efficiency and alleviate power overload resulting from the integration of large-scale electric vehicles, Ran et al. (2021) proposed a hybrid integer planning model that amalgamates DR operations and policies. By concurrently addressing DR requisites, user comfort regarding electric water heaters, and electricity prices, Song et al. (2022) introduced a deep reinforcement learning strategy for DR optimization, leveraging cloud computing. Wu et al. (2022) introduced a buyer–seller auction model based on the principles of benefit distribution among diverse trading entities in DR transactions. Considering the user-side elastic change inherent in heat construct systems, a numerical optimization difficulty in distribution network planning was delineated by Troitzsch et al. (2020). The problem was structured as a mixed-integer quadratic programming endeavor directed toward minimizing both the capex of the grid and running expenses associated with flexible loads. By introducing two-phase forces to promote the search ability of the particle swarm algorithm, a hybrid peaking optimal method on the basis of regenerative electric heaters and electric vehicle load control constraints was established by Song et al. (2019). To overcome the difficulty of large fluctuations in the magnitude and phase of the voltage of an uncertain system at both ends of the source load, an adaptive cubature Kalman filtering algorithm was proposed by Palaniyappan et al. (2023). The bidirectional long short-period recollection method was utilized to improve the generalization ability of the model in dealing with DR problems, and an excitation-based integrated DR model was constructed by Liu et al. (2023). Nonetheless, the compensation amount for DR in the aforementioned studies predominantly adheres to a fixed value and fails to consider the active response behavior of users, which limits its capacity to substantially incentivize user participation in the response.
In this paper, considering user responsiveness and multiple uncertainties, a two-layer low-carbon optimal scheduling method is proposed to enable low-carbon running for the power system and deal with risks brought through RE and load uncertainty. Initially, scenarios encompassing photovoltaic (PV), wind power, and load are produced by using Latin hypercube sampling (LHS). Then, the scenarios are refined using the heuristic synchronized back generation method. Additionally, a model incorporating both green certificate trading and carbon trading, along with a stepped DR incentive mechanism, is proposed as a joint market mechanism. Subsequently, a two-stage optimization dispatch method for the power system is developed. The model aims to maximize user energy benefit and minimize system operating costs. Then, the rationale and validity of the proposed method are demonstrated through diverse scenario setups.
2 Modeling of uncertainty
External factors frequently result in unpredictable variations in both RE generation and load. These fluctuations can disrupt the normal functioning of market mechanisms and significantly influence the security and solidity of the power system (Su et al., 2023). Addressing the challenge of achieving low-carbon economic dispatch within the green certificate carbon trading mechanism amid uncertain conditions involves employing LHS. This approach generates scenes derived from the probability distributions of wind power, PV output, and load. Subsequently, the heuristic synchronous backpropagation approach is used to refine the generated scenarios.
2.1 Model of source and load uncertainty
The actual values of wind output, PV, and load are regarded as the total of the forecasted value and the forecasted deviation, which can be given by
where
2.2 Latin hypercube sampling
A multidimensional sampling theory is introduced, considering the probability distributions of wind power, PVs, and electric load. LHS is a significant multidimensional stratified sampling approach used to reflect the global distribution of stochastic variables through samples drawing values. LHS effectively enhances sampling efficiency and ensures the coverage of all sampling areas by points, rendering it suitable for power system reliability analysis. This paper uses LHS to generate scenarios encompassing wind power, PVs, and load.
Assume that a hypercube has input random variables
(1) The sampling size is defined as
(2) For any random variable
(3) For the
where
(4) When the sampling process is accomplished, the sampled values of each stochastic variable are organized in a column of the matrix to form the sampling matrix. The sampled values of each column in the matrix are sorted to minimize their correlation. In this paper, the Gram–Schmidt sequence orthogonalization approach is used for sorting. In addition, iterative calculation is used to minimize the correlation between each column. In conclusion, Eqs 1–3 describe the uncertainty model.
3 Timeshare stepped carbon trading mechanism
The carbon transaction market implemented in this strategy operates on a time-sharing basis and considers carbon emission quota trading at an hourly scale. The system divides the hourly carbon dioxide trading volume into multiple intervals. Notably, as the carbon transaction volume range increases, both the unit carbon emission transaction price and necessary operating costs correspondingly increase. Conversely, if the carbon emissions of system decrease to below the initial quota, the surplus quota can be introduced to the carbon transaction market for potential sale, yielding profits based on prevailing selling prices. In essence, higher carbon trading volumes lead to increased unit carbon emission trading prices, thereby augmenting the system benefits. The timeshare stepwise carbon trading market model comprises three primary parts: the initial quota model for carbon emissions, actual carbon emission model, and calculation model of costs associated with timeshare stepped carbon trading.
3.1 Initial quota model of carbon emission rights
At present, the incipient allotment of carbon emission quotas is mainly carried out through free allocation. The time period covered by the carbon emission right quota for each carbon emission source is daily. The corresponding carbon emission right quota is calculated according to the output of equipment in the day-ahead dispatch. The regulatory authority will notify the allocated quota 1 day in advance. The carbon emission sources within the system mainly include thermal power units and gas turbines. Their carbon emission quota calculation model can be given by
where
3.2 Calculation model of actual carbon emissions
The actual carbon emission model in this paper is established according to Chen et al. (2021) and Lu et al. (2023). According to them, the calculation of carbon emission adopts a quadratic function. The constructed actual carbon emission model is given by
where
The calculation of carbon emission trading volume
3.3 Calculation model of the timeshare stepped carbon trading cost
Carbon emission trading is conducted in the hourly scale system, and the stepped carbon trading mechanism is adopted. Additionally, the carbon emission reduction compensation price is introduced to incentivize power generation enterprises to actively save energy and reduce emissions. When the total carbon emissions of power generation enterprises remain lower than the incipient carbon emission right, the institution will provide certain cost compensation. The established timeshare stepped carbon transaction cost calculation formula is as follows:
where
4 The model of a stepped green certificate trading mechanism
The transaction model for stepwise green certificates involves dividing the overall system green certificate quantity into multiple intervals. Greater trading volumes of green certificates within an interval correspond to increased unit green certificate trading prices, resulting in elevated system costs. Likewise, excess green certificates acquired from integrating RE into the system beyond the green certificate quota of the system can be sold within the green certificate market. The resultant revenue is determined by the prevailing daily selling price. Increased trading volumes within intervals yield higher unit green certificate trading prices, consequently boosting the system revenue. The trading mechanism of the stepped green certificate model primarily encompasses three models: the green certificate quota indicator, RE green certificate quantity, and stepped green certificate trading cost calculation models.
4.1 The model of the green certificate quota indicator
According to the regulations of the Chinese government energy department, the sum of the renewable energy consumption (REC) and green certificate trading volume must not be less than the designated consumption responsibility weight. The green certificate quota is given by
where
4.2 The model of renewable energy green certificate quantity
The conversion of REC into the quantity of green certificates is set as 1 kWh, where 1 kWh of settled electricity corresponds to 1 green certificate.
where
4.3 The model of stepped green certificate trading cost calculation
The trading mechanism for gradual green certificates includes using a gradual pricing mechanism to divide the number of certificates into intervals. As the quantity of certificates to be bought or sold increases, the unit green certificate trading price in the corresponding interval increases. The established model for calculating the costs of tiered green certificate trading is as follows:
where
5 Two-stage scheduling model for the power system considering the demand response under multiple uncertainties
5.1 The optimization model of the first stage
5.1.1 Objective function
The side of the load cluster adjusts the response quantity of the electric load based on the DR incentive strategy to maximize energy efficiency.
where
(1) The compensation benefit for demand response
Traditional DR usually uses fixed compensation prices, which can lead to low user responsiveness. To more efficiently stimulate user participation in DR and optimize the running scheme on the basis of demand-side flexibility resources, a model of stepped DR compensation cost calculation is established. According to the DR quantity of users, the model specifies multiple DR intervals, where the compensation price increases with the DR quantity in each interval. The model of stepped DR compensation cost calculation is as follows:
where
Moreover, the model of traditional DR compensation cost calculation is as follows:
(2) The cost of response.
The participation of users in DR will incur discomfort cost, which can be calculated as a quadratic function of the load response amount.
where
5.1.2 Constraint condition
(1) Load-related constraints
The response types considered in this paper for electrical load include transferable load and reducible load.
where
(2) Transferable load constraint
where
(3) Reducible load constraints
Some loads can be reduced while satisfying user demands. The constraint for the reducible electric load can be given by
where
(4) Constraints on the total power involved in DR
Within one scheduling cycle, the total transferred power of transferrable loads entering is equal to the total transferred power of loads exiting. To avoid duplicate compensation, the total response power of transferrable loads is calculated based on the total entering power or the total exiting power. Here, we choose to calculate it based on the total exiting power. Therefore, the total power
In conclusion, Eqs 12–15 describe the objective function., and Eqs 16–19 describe the constraint condition in the optimization model of the first stage.
5.2 The optimization model of the second stage
5.2.1 Objective function
In a typical scenario involving wind power, PVs, and load, the objective function on the basis of the green certificate carbon trading model is as follows:
where
Additionally, the power generation cost calculation expression is given by
where a, b, and c are the cost coefficients of thermal power units.
The expression for calculating device running costs is
where
5.2.2 Constraint condition
5.2.2.1 Power flow calculations
The development of its computational methods is closely linked to the advancement of computer tools. For an
where
Due to the nonlinearity of the power flow equation in Eq. 22, it requires iterative solutions until convergence is achieved. Once the amplitude and the phase angle of node voltages are obtained, the branch power flow can be computed by
where
In the scenario of direct current, Eqs 23, 24 can be simplified, and the simplification procedure is as follows:
(1) The voltage at per hybrid in a running system is generally near the specified voltage, and
(2) The voltage phase angle difference between the two ends of the line is very small, resulting in
(3) In ultra-high voltage networks, the resistance of the line is smaller than the reactance, allowing us to neglect the resistance, represented by
where
The network of
where
5.2.2.2 Energy equipment constraints
1) Wind power
2) Photovoltaic
where
5.2.2.3 Energy conversion equipment output and climbing constraints
1) Gas turbine
where
2) Alkaline electrolyzer
where
3) Methane generator
where
4) Hydrogen fuel cell
where
5) Energy storage
The energy storage equipment model is given by Zhao et al. (2019), Huang et al. (2021)
where
In conclusion, Eqs 20–22 describe the objective function., and Eqs 23–35 describe the constraint condition in the optimization model of the second stage.
5.3 Optimization process of a two-stage model
Considering DR under multiple uncertainties, the architecture of the two-stage scheduling method of the power system is shown in Figure 1. Based on predictive scenarios and load response capabilities, the dispatch center optimizes the load structure in the first phase. The load is divided into fixed and flexible components with the goal of maximizing user energy efficiency. In the second stage, the model introduces green certificate transaction and carbon transaction mechanisms with the goal of minimizing the comprehensive running costs for unit output planning in typical scenarios. The detailed process of scheduling plan formulation is as follows:
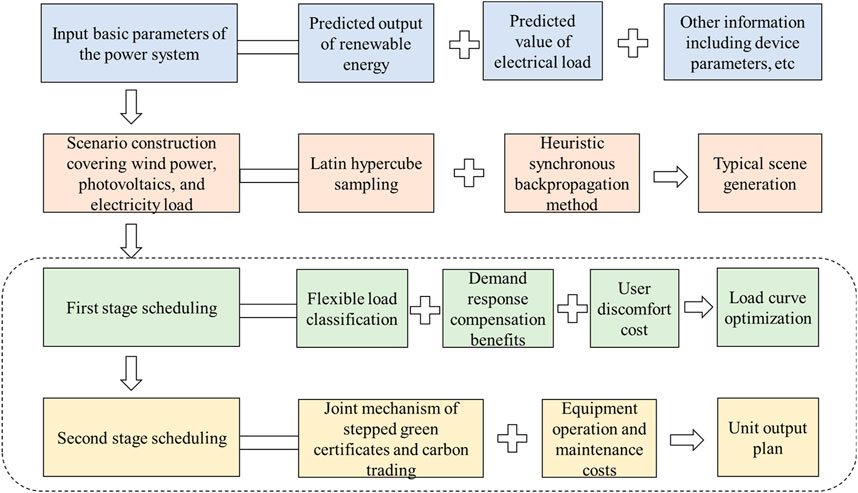
FIGURE 1. Architecture of a two-stage dispatch strategy of the power system considering the demand response under multiple uncertainties.
Step1. The basic information about the system covering PV and wind power output, forecasted electricity load, and equipment parameters is input.
Step2. A large set of sampling scenarios that conform to the probability distributions of load, wind power, and PV is generated using LHS.
Step3. The heuristic synchronous backtracking method is used for scenario reduction to obtain a small number of representative typical scenarios, along with their probabilities.
Step4. Gurobi is used to seek the solution of the first-stage optimal model and determine the corresponding response strategy that maximizes energy efficiency.
Step5. The improved stepped pricing is used to calculate the green certificate trading cost. Then, a stepped green certificate transaction model is introduced, and a green certificate carbon transaction model is jointly built by incorporating a time-of-use stepped carbon trading mechanism. The second-stage unit output plan is optimized with the goal minimizing the overall running costs in typical scenariosl.
6 Case study
6.1 Basic data
An improved IEEE 14-node transmission network is used for analysis and verification. Due to the fact that the power network used in this paper belongs to the transmission network, it can meet the relevant simplification of the DC power flow explained in Section 5.2.2. Therefore, the model established in this paper is applicable to any transmission network that satisfies the simplification of the DC power flow and is not limited to the power grid system model used in the example section. The topology of the power system is shown in Figure 2. The scene reduction outcomes are shown in Figures 3–5. The base value is set as 100 MW. Table 1 outlines the parameters of thermal power units. Table 2 presents the parameters of other equipment. Furthermore, Table 3 delineates the parameters of carbon emissions. The carbon emission quota per unit of electricity generated stands at 0.798 t/(MWh), and for per unit of thermal power generated, it stands at 0.385 t/(MWh). The foundational price for carbon emission compensation stands at 252 yuan/t. The carbon trading price experiences a growth rate of 25%, and the green certificate quota coefficient is fixed at 50%. The foundational price for green certificate transactions is 0.4 yuan, with a growth rate of 25%.
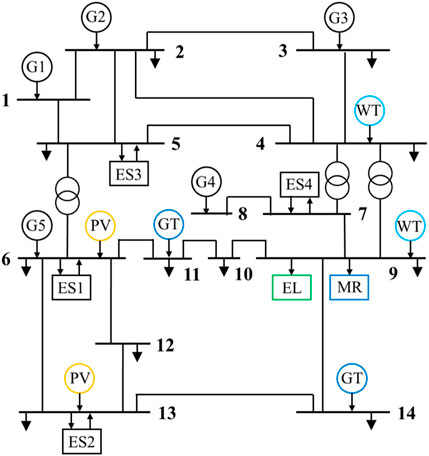
FIGURE 2. Topology of the power system.
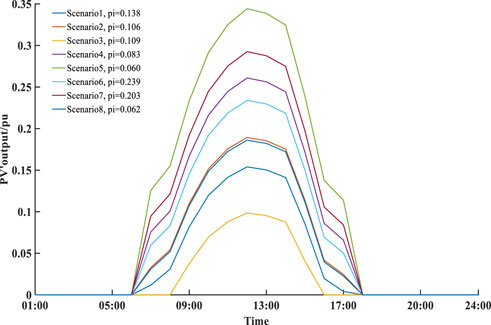
FIGURE 3. Scene reduction results of PV.
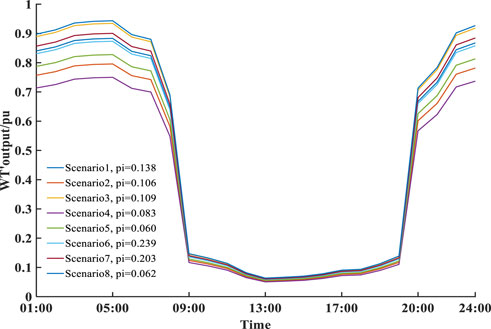
FIGURE 4. Scene reduction results of wind power.
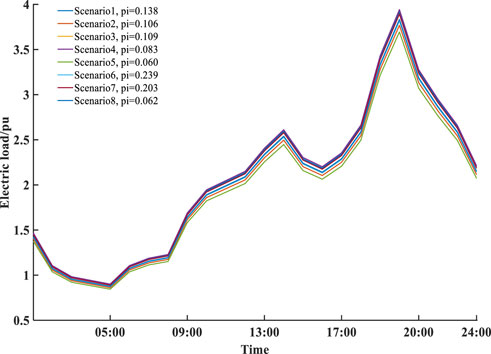
FIGURE 5. Scene reduction results of electric load.
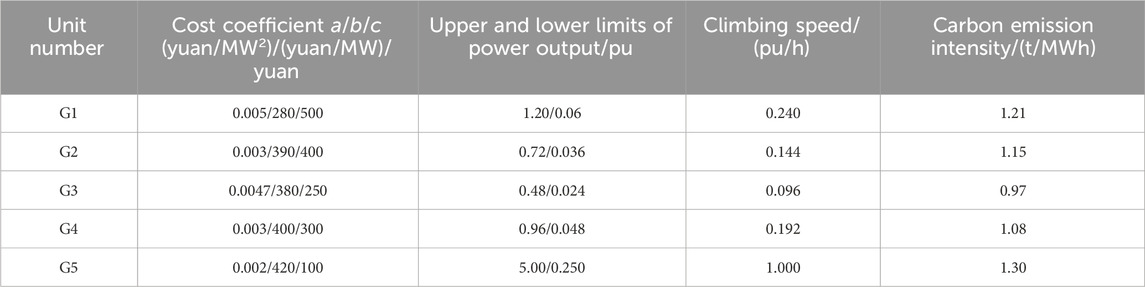
TABLE 1. Parameters of the coal-fired power unit.
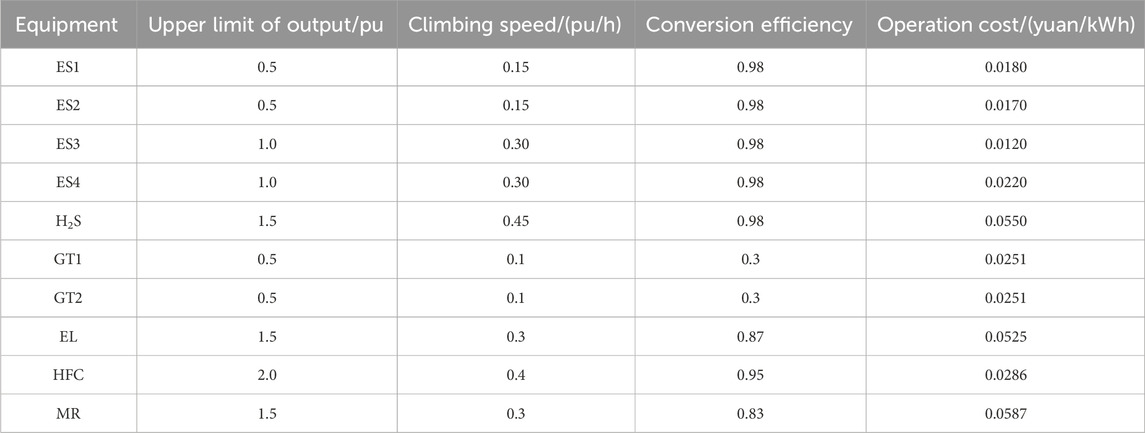
TABLE 2. Parameters of other equipment.
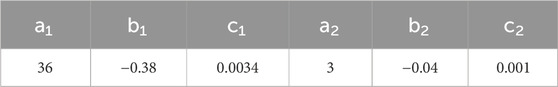
TABLE 3. Parameters of carbon emissions.
6.2 Analysis of the demand response
In this section, the advantages of DR are discussed. Three different scenarios are set up, which are as follows:.
Scenario a. Not considering DR.
Scenario b. Considering traditional DR with a certain compensation price.
Scenario c. Considering ladder-type DR with varying compensation price.
Table 4 shows that scenario b experiences a reduction of 107.199 million yuan in operating costs compared to scenario a, leading to an overall cost decrease of 107.1589 million yuan. Moreover, a decrease of 222.63 metric tons in carbon emissions and a reduction of 38.56 MW in the variance between electric load peaks and valleys occur. This verifies that the incentive mechanism for DR significantly reduces total costs, carbon emissions, and electric load variances.
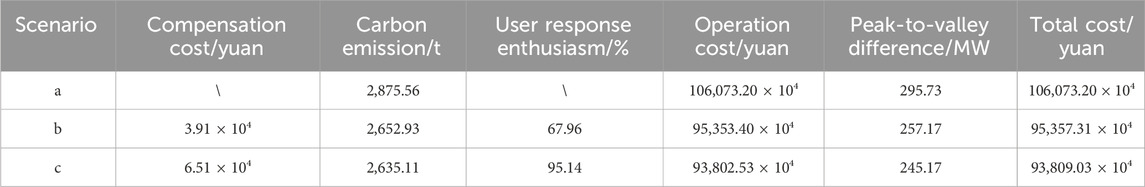
TABLE 4. Dispatch results of three models.
Despite scenario c incurring DR compensation costs exceeding 26,000 yuan, it results in a reduction of 15.4828 million yuan in overall costs and a decrease of 17.82 metric tons in carbon emissions. Regarding the DR rate, scenario b achieves a rate of only 67.96%, whereas scenario c attains a rate of 95.14%, marking a 27.18% increase over scenario b. Additionally, the variance between electric load peaks and valleys decreases by 12 MW, verifying that the incentive mechanism based on a ladder-type structure not only effectively encourages user participation but also considers the economic, low-carbon, and peak load shifting aspects of power system operation.
Figure 6 shows that the peak electric load predominantly occurs between 10:00 and 22:00. Implementing the ladder-type DR incentive mechanism resulted in a reduction in the electric load during this timeframe. Specifically, a shift in the electric load from the periods of 10:00–14:00 and 19:00–22:00 to the period of 24:00–04:00 occurred, coinciding with a lower energy demand. This initiative achieved a reduction of 108 MW in the electric load and a transfer of 165.44 MW, effectively smoothing the electric load curve. Concurrently, this strategy involved transferring electric load from high-priced daytime periods to lower-priced nighttime periods, thereby reducing operational costs within the power system.
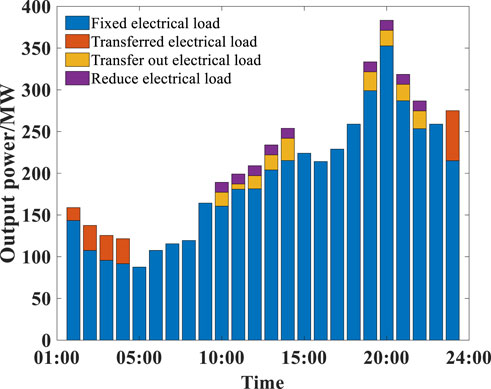
FIGURE 6. Result of the demand response.
6.3 Analysis of low-carbon economy
In this section, so as to effectively analyze the benefits of the proposed model regarding low carbon emissions and economy, four scenarios are arranged.
Scenario 1: The transaction volume of green certificates is not divided, and DR is not considered. The setting of the certificate transaction price is unified. Objectives are optimized by considering the costs of purchasing energy, equipment running, and green certificate trading.
Scenario 2: Green certificate transaction is divided. DR is not considered. Objectives are optimized by considering the costs of energy purchase, equipment running, and green certificate trading.
Scenario 3: Stepped green certificate transaction and time-sharing stepped carbon transaction are considered. DR is not considered. Objectives are optimized by considering the costs of purchasing energy, equipment running, green certificate trading, and carbon transaction.
Scenario 4: Stepped green certificate transaction and time-sharing stepped carbon transaction are taken into account. DR is considered. Objectives are optimized by considering the costs of purchasing energy, equipment running, green certificate trading, and carbon transaction.
Table 5 shows the scheduling results of power system in different scenarios. The benefits of tiered green certificate trading are compared and analyzed through scenario 1 and scenario 2. As is shown in Table 5 Scenario 2 exhibits a reduction of 16.85 metric tons in carbon emissions compared to scenario 1. Additionally, scenario 2 records a decrease of 67,000 yuan in carbon transaction costs relative to scenario 1. Conversely, the transaction costs for green cards in scenario 2 escalate by 66.72 million yuan compared to scenario 1. This increase is attributed to the adoption of a ladder-type green card trading mechanism featuring a pricing structure with higher unit green certificate transaction prices within corresponding intervals. Notably, scenario 2 demonstrates a 6.60% increase in REC compared to scenario 1. These findings support the assertion that the implementation of stepped green certificate transactions offers superior advantages over traditional methods in reducing system carbon emissions and enhancing REC rates.
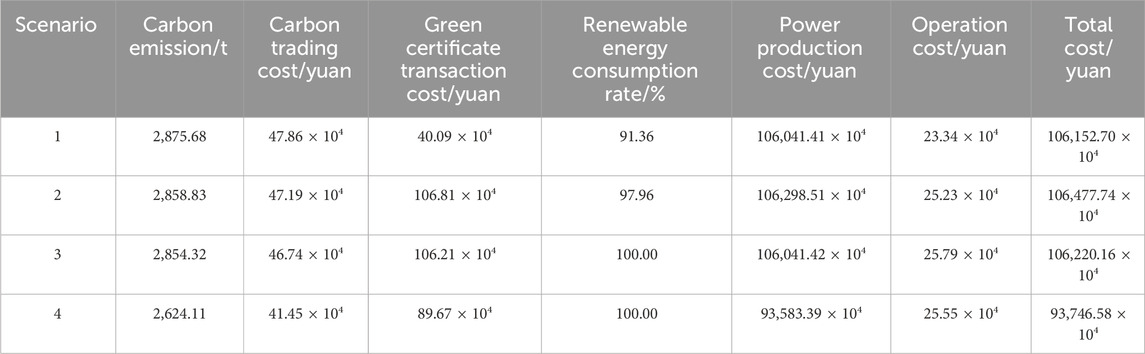
TABLE 5. Power system scheduling results in different scenarios.
The case examines the advantages of the joint mechanism involving green certificates and carbon trading using scenarios 2 and 3. Scenario 3 exhibits a 4.51-ton reduction in carbon emissions compared to scenario 2. Moreover, it exhibits a decrease of 45,000 yuan in carbon transaction costs, and a reduction of 6,000 yuan in green certificate transaction expenses relative to scenario 2. Overall, scenario 3 demonstrates a notable decrease of 2.5758 million yuan in total costs in contrast to scenario 2. This analysis suggests that incorporating carbon transaction costs into the objective function led to a reduction in system carbon emissions. Furthermore, it resulted in decreased carbon and green certificate transaction expenses, contributing to a whole diminution in entire costs.
Analysis of benefits derived from the DR mechanism is conducted in relation to scenarios 3 and 4. Scenario 4 demonstrates a reduction of 230.21 metric tons in carbon emissions compared to scenario 3. Additionally, scenario 4 displays a decrease in carbon transaction costs by 52,900 yuan and a reduction in the transaction cost of green certificates by 165.4 thousand yuan compared to scenario 3. The overall cost difference illustrates a decrease of 124.7358 million yuan between scenario 4 and scenario 3. Evidently, the incorporation of the DR mechanism effectively mitigates carbon emissions within the power system. Furthermore, the optimization of DR, in conjunction with green certificate and carbon trading mechanisms, aligns with the objective of achieving a low-carbon economy in power system dispatching.
7 Conclusion
In pursuit of low carbon emissions and promoting the absorption of RE while addressing risks posed by multiple uncertainties to the system, a management approach considering uncertainties and DR for the power system was proposed. The primary aim was to facilitate enhanced low-carbon economic operations. First, taking the multiple uncertainties of RE and electric load into account, a large number of scenarios were formed using LHS. By using the heuristic synchronous back substitution approach to achieve centralized reduction, multiple typical scenarios and their probabilities of PV and load were obtained. Furthermore, a joint market mechanism model of green certificate transaction and carbon transaction was developed, which was applied to promote REC, thus reducing carbon emission. Considering the active response of users, a stepped DR incentive mechanism was constructed on the basis of the transferable and reducible characteristics of electric load. Subsequently, a two-stage optimization dispatch model was constructed with the objective function of both maximizing user energy efficiency and minimizing system operating cost. Finally, the case results showed that carbon dioxide emissions were decreased by 251.57 metric tons, the REC rate was increased by 8.64%, and the total cost was reduced by 124.0612 million yuan. Compared with the model that only considers the traditional green certificate mechanism, the method developed here could significantly promote the economy and low-carbon operation of the power system.
With the ongoing expansion of the energy market, the threshold for engaging in energy trading is progressively diminishing, leading to the continual emergence of diverse market trading models and varieties. The focus will shift toward optimizing the representation of energy commodity attributes, enabling seamless and extensive transactions among diverse entities. This stands as the forthcoming research trajectory.
Data availability statement
The original contributions presented in the study are included in the article/Supplementary Material; further inquiries can be directed to the corresponding author.
Author contributions
LC: conceptualization, data curation, formal analysis, funding acquisition, investigation, methodology, project administration, resources, software, supervision, validation, visualization, writing–original draft, and writing–review and editing. DX: formal analysis, investigation, methodology, project administration, writing–original draft, and writing–review and editing. FX: data curation, investigation, project administration, supervision, writing–original draft, and writing–review and editing. HZ: data curation, methodology, resources, visualization, writing–original draft, and writing–review and editing.
Funding
The author(s) declare that financial support was received or the research, authorship, and/or publication of this article. This study was funded by the Science and Technology Project of the State Grid Corporation of China (5100-202205277A-2-0-XG).
Acknowledgments
The authors acknowledge the Science and Technology Project of the State Grid Corporation of China for contribution of research fund. The authors also thank the reviewers for their constructive comments and careful revision of this paper. The authors would like to thank the Science and Technology Project of State Grid Corporation of China (5100-202205277A-2-0-XG).
Conflict of interest
The authors declare that the research was conducted in the absence of any commercial or financial relationships that could be construed as a potential conflict of interest.
Publisher’s note
All claims expressed in this article are solely those of the authors and do not necessarily represent those of their affiliated organizations, or those of the publisher, the editors, and the reviewers. Any product that may be evaluated in this article, or claim that may be made by its manufacturer, is not guaranteed or endorsed by the publisher.
References
Baharvandi, A., Aghaei, J., Niknam, T., Shafie-Khah, M., Godina, R., and Catalão, J. (2018). Bundled generation and transmission planning under demand and wind generation uncertainty based on a combination of robust and stochastic optimization. IEEE Trans. Sustain. Energy. 9, 1477–1486. doi:10.1109/TSTE.2018.2789398
Chen, H., Wu, H., Kan, T., Zhang, J., and Li, H. (2023). Low-carbon economic dispatch of integrated energy system containing electric hydrogen production based on VMD-GRU short-term wind power prediction. Int. J. Electr. Power Energy Syst. 154, 109420–109438. doi:10.1016/j.ijepes.2023.109420
Chen, J., Hu, Z., Chen, J., Chen, Y., Gao, M., and Lin, M. (2021). Optimal dispatch of integrated energy system considering ladder-type carbon trading and flexible double response of supply and demand. High. Volt. Eng. 47, 3094–3106. doi:10.13336/j.1003-6520.hve.20211094
Cui, Y., Gu, C., Fu, X., Deng, G., Zhao, Y., and Tang, Y. (2022). Low-carbon economic dispatch of integrated energy system with carbon capture power plants considering generalized electric heating demand response. Proc. Chin. Soc. Electr. Eng. 42, 8431–8445. doi:10.13334/j.0258-8013.pcsee.211942
Dong, J., Wang, H., Yang, J., Gao, L., Wang, K., and Zhou, X. (2022). Low carbon economic dispatch of integrated energy system considering power supply reliability and integrated demand response. CMES-Computer Model. Eng. Sci. 132, 319–340. doi:10.32604/cmes.2022.020394
Gupta, N. (2020). Probabilistic optimal reactive power planning with onshore and offshore wind generation, EV, and PV uncertainties. IEEE Trans. Ind. Appl. 56, 1–4213. doi:10.1109/TIA.2020.2985319
Hou, H., Xue, M., Xu, Y., Xiao, Z., Deng, X., Xu, T., et al. (2020). Multi-objective economic dispatch of a microgrid considering electric vehicle and transferable load. Appl. Energy 262, 114489–114499. doi:10.1016/j.apenergy.2020.114489
Hou, J., Yuan, Z., Wang, W., and He, S. (2023). Optimization method of wind power consumption based on thermal storage tanks against the background of stepped carbon trading. Front. Energy Res. 10. 10506451-10506462. doi:10.3389/fenrg.2022.1050641
Huang, Y., Lin, Z., Liu, X., Yang, L., Dan, Y., Zhu, Y., et al. (2021). Bi-level coordinated planning of active distribution network considering demand response resources and severely restricted scenarios. J. Mod. Power Syst. Clean. Energy. 9, 1088–1100. doi:10.35833/MPCE.2020.000335
Jiang, T., Min, Y., Ge, W., Chen, L., Chen, Q., Xu, F., et al. (2020). Hierarchical dispatch method for integrated heat and power systems based on a feasible region of boundary variables. CSEE J. Power Energy Syst. 6, 543–553. doi:10.17775/CSEEJPES.2019.02930
Jordehi, R. (2019). Optimisation of demand response in electric power systems, a review. Renew. Sustain. Energy Rev. 103, 308–319. doi:10.1016/j.rser.2018.12.054
Li, Z., and Xu, Y. (2018). Optimal coordinated energy dispatch of a multi-energy microgrid in grid-connected and islanded modes. Appl. Energy 210, 974–986. doi:10.1016/j.apenergy.2017.08.197
Liu, J., Li, P., Wang, G., Zha, Y., Peng, J., and Xu, G. (2020b). A multitasking electric power dispatch approach with multi-objective multifactorial optimization algorithm. IEEE Access 8, 155902–155911. doi:10.1109/ACCESS.2020.3018484
Liu, S., Chen, C., Jiang, Y., Lin, Z., Wang, H., Waseem, M., et al. (2023). Bi-Level coordinated power system restoration model considering the support of multiple flexible resources. IEEE Trans. Power Syst. 38, 1583–1595. doi:10.1109/TPWRS.2022.3171201
Liu, S., Lin, Z., Zhao, Y., Liu, Y., Ding, Y., Zhang, B., et al. (2020c). Robust system separation strategy considering online wide-area coherency identification and uncertainties of renewable energy sources. IEEE Trans. Power Syst. 35, 3574–3587. doi:10.1109/TPWRS.2020.2971966
Liu, S., Zhang, T., Lin, Z., Liu, Y., Ding, Y., and Yang, L. (2022). Controlled islanding strategy considering uncertainty of renewable energy sources based on chance-constrained model. J. Mod. Power Syst. Clean. Energy. 10, 471–481. doi:10.35833/MPCE.2020.000411
Liu, S., Zhao, Y., Lin, Z., Liu, Y., Ding, Y., Yang, L., et al. (2020a). Data-driven event detection of power systems based on unequal-interval reduction of PMU data and local outlier factor. IEEE Trans. Smart Grid. 11, 1630–1643. doi:10.1109/TSG.2019.2941565
Liu, Z., Xiao, Z., Wu, Y., Hou, H., Xu, T., Zhang, Q., et al. (2021). Integrated optimal dispatching strategy considering power generation and consumption interaction. IEEE Access 9, 1338–1349. doi:10.1109/ACCESS.2020.3045151
Lu, Q., Guo, Q., and Zeng, W. (2023). Optimal dispatch of community integrated energy system based on Stackelberg game and integrated demand response under carbon trading mechanism. Appl. Therm. Eng. 219, 119508. doi:10.1016/j.applthermaleng.2022.119508
Mahdavi, M., Jurado, F., Schmitt, K., and Chamana, M. (2023). Electricity generation from cow manure compared to wind and photovoltaic electric power considering load uncertainty and renewable generation variability. IEEE Trans. Ind. Appl., 1–11. doi:10.1109/TIA.2023.3330457
Palaniyappan, B., Vinopraba, T., and Chandrasekaran, G. (2023). Solving electric power distribution uncertainty using deep learning and incentive-based demand response. Util. Policy 82, 101579–101589. doi:10.1016/j.jup.2023.101579
Ran, C., Zhang, Y., and Yin, Y. (2021). Demand response to improve the shared electric vehicle planning: managerial insights, sustainable benefits. Appl. Eenergy 292, 116823–106841. doi:10.1016/j.apenergy.2021.116823
Song, C., Han, G., and Zeng, P. (2022). Cloud computing based demand response management using deep reinforcement learning. IEEE Trans. Cloud Comput. 10, 72–81. doi:10.1109/TCC.2021.3117604
Song, Z., Zhang, J., Zheng, Z., and Xiao, X. (2019). Peak dispatching for wind power with demand-side energy storage based on a particle swarm optimization model. Util. Policy 56, 136–148. doi:10.1016/j.jup.2018.12.003
Su, Y., Liu, F., Wang, Z., Zhang, Y., Li, B., and Chen, Y. (2023). Multi-stage robust dispatch considering demand response under decision-dependent uncertainty. IEEE Trans. Smart Grid. 14, 2786–2797. doi:10.1109/TSG.2022.3228700
Troitzsch, S., Sreepathi, B., Huynh, T., Moine, A., Hanif, S., Fonseca, J., et al. (2020). Optimal electric-distribution-grid planning considering the demand-side flexibility of thermal building systems for a test case in Singapore. Appl. Energy. 273, 114917–114929. doi:10.1016/j.apenergy.2020.114917
Wan, X., Lian, H., Ding, X., Peng, J., and Wu, Y. (2020). Hierarchical multi-objective dispatching strategy for the microgrid system using modified MOEA/D. J. Math. 647, 1–19. doi:10.1155/2020/4725808
Wang, S., Du, W., Lin, L., Li, J., Chen, W., and Gao, X. (2018). Optimal allocation of photovoltaic energy storage microgrid under the demand side response based on cooperative game. Power Syst. Prot. Control 46, 129–137. doi:10.7667/PSPC162051
Wu, Y., Lin, Z., Liu, C., Chen, Y., and Uddin, N. (2022). A demand response trade model considering cost and benefit allocation game and hydrogen to electricity conversion. IEEE Trans. Ind. Appl. 58, 2909–2920. doi:10.1109/TIA.2021.3088769
Yang, D., Zhang, C., Jiang, C., Liu, X., and Shen, Y. (2021). Interval method based optimal scheduling of regional multi-microgrids with uncertainties of renewable energy. IEEE Access 9, 53292–53305. doi:10.1109/ACCESS.2021.3070592
Yang, P., Jiang, H., Liu, C., Kang, L., and Wang, C. (2023). Coordinated optimization scheduling operation of integrated energy system considering demand response and carbon trading mechanism. Int. J. Electr. Power Energy Syst. 147, 108902–108915. doi:10.1016/j.ijepes.2022.108902
Zeng, B., Zhang, J., Yang, X., Wang, J., Dong, J., and Zhang, Y. (2014). Integrated planning for transition to low-carbon distribution system with renewable energy generation and demand response. IEEE Trans. Power Syst. 29, 1153–1165. doi:10.1109/TPWRS.2013.2291553
Zhang, C., Xu, Y., Dong, Z., and Wong, K. (2018). Robust coordination of distributed generation and price-based demand response in microgrids. IEEE Trans. Smart Grid 9, 4236–4247. doi:10.1109/TSG.2017.2653198
Zhang, L., Liu, D., Cai, G., Lyu, L., Koh, L., and Wang, T. (2023). An optimal dispatch model for virtual power plant that incorporates carbon trading and green certificate trading. Int. J. Electr. Power Energy Syst. 144, 108558–108568. doi:10.1016/j.ijepes.2022.108558
Zhang, X., and Zheng, L. (2019). Coordinated dispatch of the wind-thermal power system by optimizing electric vehicle charging. Clust. Computing-the J. Netw. Softw. Tools Appl. 22, 8835–8845. doi:10.1007/s10586-018-1974-9
Zhao, Y., Lin, Z., Wen, F., Ding, Y., Hou, J., and Yang, L. (2019). Risk-constrained day-ahead scheduling for concentrating solar power plants with demand response using info-gap theory. IEEE Trans. Ind. Inf. 15, 5475–5488. doi:10.1109/TII.2019.2899003
Keywords: power system, uncertainty, demand response, low carbon, optimal scheduling
Citation: Cai L, Xie D, Xue F and Zhang H (2024) Two-stage low-carbon optimal dispatch of the power system considering demand response to defend large uncertainties and risks. Front. Energy Res. 12:1361919. doi: 10.3389/fenrg.2024.1361919
Received: 27 December 2023; Accepted: 05 February 2024;
Published: 20 February 2024.
Edited by:
Shengyuan Liu, State Grid Zhejiang Electric Power Co., Ltd., ChinaReviewed by:
Lili Hao, Nanjing Tech University, ChinaDawei Zhao, Nanjing University of Science and Technology, China
Copyright © 2024 Cai, Xie, Xue and Zhang. This is an open-access article distributed under the terms of the Creative Commons Attribution License (CC BY). The use, distribution or reproduction in other forums is permitted, provided the original author(s) and the copyright owner(s) are credited and that the original publication in this journal is cited, in accordance with accepted academic practice. No use, distribution or reproduction is permitted which does not comply with these terms.
*Correspondence: Linjun Cai, Y2FpbGluanVuQHNnZXByaS5zZ2NjLmNvbS5jbg==