 Mengyuan Lin
 Liyuan Peng
 Tingting Liu
95% of researchers rate our articles as excellent or good
Learn more about the work of our research integrity team to safeguard the quality of each article we publish.
Find out more
ORIGINAL RESEARCH article
Front. Energy Res. , 08 February 2024
Sec. Process and Energy Systems Engineering
Volume 12 - 2024 | https://doi.org/10.3389/fenrg.2024.1361803
This article is part of the Research Topic Design, Simulation, and Optimization of Hybrid Energy Systems View all 5 articles
Buildings account for a significant portion of total energy consumption, and the introduction of intelligent buildings represents a significant step forward in efficiently managing energy utilization. The proposed solutions represent a significant step forward in the development of intelligent residential environments. Beginning the process of achieving improved building intelligence necessitates a thorough evaluation and prediction of the necessary heating and cooling energy requirements, taking into account all relevant influencing factors. This study describes methodologies for using data mining models to predict the heating and cooling energy requirements of intelligent buildings during the construction phase. Data mining techniques, specifically Support Vector Machines (SVM) and Random Forest, are used, demonstrating their superior efficiency over alternative methods. Metaheuristic algorithms, particularly the Owl Search Algorithm (OSA), are described as effective tools for optimizing results across a wide range of problem resolutions. OSA is described and proposed alongside novel data mining methods, demonstrating that this combination of algorithms improves the performance of Random Forest and SVM-based models by 11% and 24%, respectively. The proposed models can generate predictions with a small number of parameters, eliminating the need for complex software and tools. This user-friendly approach makes the prediction process more accessible to a wider audience. While specialized equipment and professional-grade tools will be used, the proposed models are accessible to a wide range of individuals interested in participating in the prediction process.
Based on statistics from various organizations, such as the World Energy Organization, approximately 30% of global energy consumption occurs in the domestic and commercial sectors (González-Torres et al., 2022). A significant portion of this quantity is allocated towards the cooling and heating of buildings, particularly in regions with high temperatures and humidity (Elnagar et al., 2023; Nikbakht Naserabad et al., 2023). As living standards have improved, there has been a corresponding increase in the human desire for comfortable conditions. Individuals desire optimal comfort in every setting. The growth in population has led to an increase in the demand for energy in the construction and welfare sectors, and it is certain that this trend is going upwards (Babayomi et al., 2023; Liao et al., 2023). This surge reflects an interconnected web where societal advancements, population dynamics, and energy requirements converge, painting a comprehensive picture of the intricate relationship between human wellbeing and the need for sustainable energy solutions (Ependi et al., 2023). Given these trends, understanding and addressing the factors driving escalating energy demand, especially in the context of building cooling and heating, is imperative for devising effective strategies to promote energy efficiency and environmental sustainability (Hafez et al., 2023).
The aforementioned cases have prompted extensive research on energy conservation in buildings. In the past, fossil fuels were widely favored and popular as a source of energy worldwide, surpassing other alternatives (Ilham et al., 2022; Bian et al., 2023). However, the negative consequences resulting from their excessive consumption have shifted the focus towards exploring alternative energy sources and implementing strategies to decrease energy consumption (Taner, 2021; Misbah Inayat et al., 2023). The depletion of fossil fuel reserves, environmental considerations, economic expansion, increased demand, and political and economic turmoil have necessitated the need to reduce energy consumption in order to mitigate these risks and crises to the greatest extent possible (Molajou et al., 2021; Tajfar et al., 2023).
Addressing the intricate challenge of enhancing energy efficiency in building operations necessitates a comprehensive understanding of the myriad variables that influence energy consumption. The complexities inherent in this domain are underscored by a notable impediment, namely, the inadequate comprehension of the multifaceted factors dictating the energy dynamics within a building (Hu et al., 2023). Recognizing that the energy consumption of a building is subject to a diverse array of variables is pivotal in formulating effective strategies to optimize energy usage. These variables encompass a wide spectrum of influences, spanning meteorological conditions, the efficacy of insulation and building materials, construction and maintenance activities, the design and functionality of building energy systems, the behavior and activities of occupants, and the overall indoor environmental quality of the building, as elucidated (Zhao and Magoulès, 2012). Weather conditions, including temperature, humidity, and seasonal variations, exert a profound impact on a building’s energy demands (He et al., 2023). The effectiveness of insulation and the choice of building materials influence the retention or dissipation of energy, further shaping the overall energy footprint. Concurrently, construction and maintenance practices, along with the intricacies of building energy systems, play a pivotal role in determining operational efficiency (Alhamami et al., 2023).
The advancement and widespread adoption of information technology has led to a new way of addressing the crucial human need to optimize energy consumption (Apanavičienė and Shahrabani, 2023; Raihan et al., 2023). Given that a significant portion of human lifespan is dedicated to occupying administrative, residential, and commercial buildings, experts have prioritized the need to optimize energy consumption in these structures (Ejidike et al., 2022). Furthermore, alongside the focus on enhancing energy efficiency, the integration of information technology into buildings has prompted numerous companies to develop and offer products aimed at creating a more conducive living environment for humans (Esmaeilian et al., 2016).
A smart building is a structure that efficiently utilizes various fundamental elements, such as its design, systems, and management services, to create a cost-effective and suitable environment. Within the intelligent infrastructure, numerous habitual and involuntary actions carried out by residents are automated by smart systems, resulting in time and labor cost savings (Ali and Zorlu Partal, 2022). Smart homes are comprised of many interconnected communication networks that interface with the primary electrical equipment and services. This integration allows for remote control and monitoring of those services. Furthermore, the subsequent information highlights that the benefits of smart buildings encompass the management of energy consumption, control over ventilation, and the efficiency of heating devices, among others (Aliero et al., 2022). Nowadays, there is a growing emphasis on improving the performance of building management and automation systems (Himeur et al., 2023). This is done to reduce costs in the construction industry and to make optimal use of technology, communication, and computer technology. By doing so, energy can be saved, resulting in overall cost savings. The systems quickly offset the associated expenses (Selvaraj et al., 2023).
Recent research has created ways to estimate energy consumption, aiming to improve energy savings and reduce environmental impact. Typically, these technologies employ machine learning to develop a forecast model using previous energy use statistics. Azkune et al. (2015) proposed a methodology that employed data-driven learning techniques to extract activity models based on knowledge. The mentioned approach incorporates a novel clustering procedure that enhances incomplete initial models via knowledge engineering. This method utilizes prior knowledge to identify the active cluster and assign it the suitable label. The learning algorithm trains clusters to discover activity models for various users. The support vector machine (SVM) is a commonly utilized tool in the field of energy modeling for buildings. Ma et al. (2018) have effectively utilized SVM to forecast the energy consumption of buildings in China. Another approach employed in forecasting energy consumption in buildings is the utilization of integrated methodologies, which involves combining various prediction models. Wang et al. (2018) employed the random forest technique to forecast the hourly energy usage of structures. Shao et al. (2020) investigated the energy consumption of hotel structures by constructing a SVM model for energy consumption prediction. As input variables, the weather parameters and operational parameters of the hotel air conditioning system are utilized by the support vector machine model. By developing an SVM model, Liu et al. (2020) are able to predict and diagnose the energy consumption of public buildings in China. The model makes use of eleven input parameters. Historical energy consumption data, meteorological conditions, and time-cycle components comprise the inputs.
Wu and Chu (2021) employed data-mining techniques to predict energy consumption in cottages, residences, and office buildings. They examined the influence of variables such as population size, household size, construction duration, architectural design, and electrical appliances in winter and summer. The results showed that decision tree exhibits superior accuracy. An algorithm for dynamic anomaly detection in the analysis of building energy consumption data was introduced by Lei et al. (2023). The algorithm exhibits the ability to detect anomalies that manifest collectively as well as anomalies that manifest individually. By merging an unsupervised clustering algorithm and a supervised algorithm, the algorithm generates a matching mechanism that is semi-supervised. The results indicate that the algorithm successfully detects building energy consumption with a clustering accuracy of over 80%. Liu et al. (2022) utilized cutting-edge intelligence algorithms to achieve the goal of data mining. They employed cluster analysis and identified association rules to explore the relationships between different types of energy. The analyzed database consists of authorized energy building models. The results indicate that both the apriori and k-shape algorithms successfully extracted the energy information from the concealed dataset of patterns. Sami Khafaga et al. (2023) presented a method for predicting energy consumption. This method utilizes a new optimization algorithm that combines the dipper-throated optimization and stochastic fractal search algorithm. Additionally, a new forecasting model is introduced, which comprises a collection of long short-term memory units. The findings demonstrated that their proposed model can precisely predict the energy use. In their study, Youssef et al. (2023) introduced an algorithm designed to optimize the scheduling of electrical appliances in smart homes. The primary goals of this algorithm are to minimize power costs, enhance network efficiency, promote customer comfort, and mitigate peak demand. This study employs load conversion as a means to alter the load’s structure. Load conversion is a specific type of demand side management method known as elite evolutionary strategy artificial ecosystem-based optimization. The utilization of this algorithm yields a decrease in electricity expenses, enhances the efficiency of the network, optimizes customer satisfaction, and mitigates the occurrence of peak demand.
This paper introduces prediction models that employ SVM and Random Forest data mining approaches. These models are evaluated in comparison to previous approaches. In addition, a novel hybrid model has been provided to further optimize the effectiveness of the suggested model. This model utilizes the cutting-edge metaheuristic optimization technique of the owl search algorithm (OSA). The efficacy of this model has been appraised and analyzed.
Data mining can be employed to find patterns and acquire fundamental natural behaviors. In order to enhance recognition, it is necessary to employ a sequential algorithm and incorporate rounds for pattern extraction. Due to the progress made in data collection and storage technologies, scientists across various disciplines are now confronted with enormous volumes of data. Owing to their exorbitant expenses and protracted execution times, conventional statistical techniques are unsuitable for data analysis. As a result, the application of contemporary techniques for data analysis, such as data mining, is imperative. In contrast to alternative approaches, particularly conventional statistical methods, data mining possesses four primary attributes and benefits (Chen et al., 2023). Data mining significantly enhances the adaptability of time series analysis by revealing relationships between multiple parameters that occur concurrently or influence one another through distinct delays. Data mining, to put it another way, is a methodology utilized to determine the correlation between multiple variables or parameters. The rules and models generated by algorithms and techniques for data mining are readily interpretable. In other words, its models and regulations are simultaneously practical and straightforward. By employing data mining techniques, scientists are able to gain a comprehensive understanding of the interconnections among various parameters, facilitating their comprehension of the underlying physics of the issue. Data mining techniques can be applied to problems involving voluminous data and multiple variables, as well as to the monitoring of extreme events and incidents with a high threshold limit (Pouladi et al., 2020). The method proposed in this study (based on an optimized hybrid model and data mining) is described in the following.
The support vector machine (SVM) is a machine learning system that classifies data by utilizing support vectors, which represent the patterns within the data (Kunkcu et al., 2022). In order to categorize the data into two groups, it is necessary to determine the function f(X), such that yi = f(xi) for N data points. The function f can be defined as Eq. 1.
where, xi represents the support vectors, yi∈{−1,1} is a positive integer, and C is a constant. When dealing with non-linear classification functions, a kernel function k(xi,x) is employed to transform the data into higher dimensions, making the separation linear. The kernel function introduces complexity due to its types and subdivisions, with many being linear and struggling to differentiate distinct data features. To address this, weights are incorporated into the kernel function to account for the impact of different features (Eq. 2). These weights play a crucial role in determining the influence of each feature, enhancing the SVM’s performance in handling diverse datasets. SVM, being a precise and potent machine learning algorithm, primarily focuses on binary classification, making it advantageous for categorizing behavior as normal, abnormal, or suspicious.
Because of its mathematical complexity, the kernel function is challenging to express in terms of its possible types and subdivisions into distinct groups. The majority of kernel function types are linear and fail to distinguish between distinct data features. As stated in the preceding section, the function in question is a linear function that applies the same treatment to all data characteristics. The level of uniformity exhibits a detrimental impact on the performance and accuracy of the SVM. It appears that the solution to this problem is to incorporate weight into the kernel function. The impact of features is determined by these weights. In contemporary machine learning applications, the SVM is among the most precise and potent machine learning algorithms. One of the evaluated learning techniques utilized for classification, prediction, and regression is the SVM. SVMs are immensely well-liked on account of their exceptional classification performance and superiority over alternative regression and classification algorithms. In reality, the primary purpose of SVM is binary classification. Hence, its methodology proves to be highly advantageous in resolving prevailing challenges associated with classifying behavior as normal, abnormal, or suspicious. SVM is a machine learning technique that assigns its corresponding layer to each learning vector drawn in spaces with high feature dimensions. SVM clustering is predicated on linear data clustering, and within the linear portion of the data, the selected line with the highest confidence margin is of the utmost importance. QP methods are utilized to determine the optimal linear equation for the data, whereas conventional methods have limitations when it comes to problem-solving.
To facilitate the classification of more intricate information, Phi operations are employed to transfer the data to a higher dimensional space prior to linear segmentation operations. Higher-dimensional problems may be resolved by employing Lagrange’s binary problem, which involves the conversion of the minimization problem under consideration into a binary format. By employing this approach, one can substitute a convoluted method like Phi with more straightforward operations like kernel, which is a Phi multiplicative vector. The SVM model is developed in the following three stages: data pre-processing, model development, model extraction, and model implementation. The performance of this algorithm remains unaffected by the volume of data present, as it is scalable. Therefore, the spatial dimensions of the features have no bearing on the complexity of the classification. Hence, in contrast to neural networks, this approach enables the acquisition of a substantial collection of models. The risk is minimized through the design of this structure-based algorithm, which has found widespread application and achieved remarkable success.
Utilizing the proposed method of the SVM algorithm, the relevant features are chosen. SVM data segmentation is one of the well-known techniques for data classification; however, it requires the configuration of parameters and does not require fundamental data knowledge. The training data set D comprises n points (Eq. 3).
where, yi is either 1 or -1, every xi represents a real p-dimensional vector. The objective is to identify the separating hypersurface that divides the points with yi = 1 from the points with yi = −1 by the greatest distance from the edge points. Every super-page can be expressed as a collection of x-points that satisfy the Eq. 4.
x represents a point vector and w represents a weight vector in this equation. Therefore, in order to separate the data, it must consistently exceed zero. When considering the entire set of potential hypersurfaces, the SVM opts for the one with the greatest possible hypersurface distance. If the test data follows a logical pattern and every test vector is situated within a radius of r around the training vector. Maximizing the margins requires positioning the selection page at the greatest distance from the data. To achieve this, the lines connecting the closest data points in the convex hull of the two sets will be halved. By maximizing x (x is located on the hypersurface), the distance between the origin and the point closest to the hypersurface is determined. We employ an analogous approach for the remaining ancillary points. The sum of the two distances can be calculated to determine the total distance of the supersurface. In order to obtain the separator page, the nearest points are utilized.
Optimising the quadratic constant prism for all linear bounds is necessary for all points
where, the solution is based on Eqs 7, 8. The optimization process involves solving a quadratic programming problem with Lagrange coefficients (ai). The solution, represented by Eqs 7, 8, provides the weight vector (w) and bias (b), facilitating the classification function f(x).
The supported axis includes non-zero ai that are equal to xi. Following the classification process, it is represented by Eq. 9.
This comprehensive explanation of the SVM model elucidates its intricacies, providing a more thorough understanding of the algorithm’s application in the context of energy consumption estimation in smart homes.where, depends on an inner product between the test point x and the support vectors xi. Solving the optimization problem includes calculating the inner products xiTxj between all pairs of training points. The equation find w and b so that Φ(w) = ½ wTw reaches the minimum and for all {(xi,yi)}, yi (wTxi + b) ≥ 1. The Eq. 10 provides an explanation of the SVM model for penetration detection, focusing on the training and testing phases.
The SVM model is trained by optimizing the parameters ai and b to minimize the loss function, often involving a regularization term (Eq. 11).
where, ϵ is the epsilon-tube parameter. The SVM regression model learns to map input features to heating or cooling load values by finding a hyperplane in the feature space. The use of kernel functions allows SVM to capture non-linear patterns in the data, making it suitable for predicting complex load patterns in buildings. The training process involves optimizing parameters to minimize the error between predicted and actual load values.
The SVM model evolves through three key stages:
• Data Pre-processing: In this initial stage, the relevant features are selected, and any necessary data transformations are performed. The SVM algorithm remains scalable, ensuring its performance is unaffected by the volume of data and the spatial dimensions of features.
• Model Development: The SVM model’s core involves the identification of the optimal separating hypersurface that maximizes the distance between points with yi = 1 and yi = −1. This is achieved through quadratic programming methods, ensuring the SVM selects the hypersurface with the greatest confidence margin.
• Model Extraction and Implementation: Post-development, the SVM model is extracted, and the classification process is implemented. The model’s design minimizes risk and allows for the acquisition of a substantial collection of models, offering flexibility and robustness.
The random forest model efficiently classifies a large number of data sets at a rapid rate. One of the classification algorithms that employs the bagging method is this one. This approach is a composite of multiple decision trees, wherein a number of input variables are arbitrarily incorporated into the construction of each tree and comprises bootstrap samples of data. A substantial quantity of n samples is sampled from the primary observation data set utilizing the bootstrap method. Bootstrapping is utilized to determine the estimator’s error (variance) through the iterative process of sampling and estimation. In each iteration, the estimator in question is computed using a resampling of the data. Variable m is selected at random from among all 𝑀 independent variables to be divided along the process tree line in each branch. In regression mode, the ratio m/𝑀 is configured to be one-third, whereas in classification mode (
Random Forest is a robust ensemble learning technique applied to predict heating and cooling load patterns in buildings through regression. Representing input features as
The ensemble prediction (
where, is the total number of trees in the Random Forest. During training, each decision tree is constructed using a bootstrapped sample of the training data and a random subset of features at each split. Recursive splitting of data based on feature values results in the creation of trees that collectively predict the target variable. This approach enables random forest to effectively capture complex load patterns, making it a powerful technique for regression tasks in heating and cooling load estimation for buildings.
The OSA is a meta-heuristic algorithm that draws inspiration from nature. OSA is a population-based method that mimics the hunting behavior of owls in low-light conditions. This algorithm utilizes the search behavior of owls, allowing for efficient exploration of the search space. This algorithm is specifically designed to strike a balance between search and exploitation, thereby enabling rapid convergence towards optimal solutions (Jain et al., 2018). The OSA is a global optimization algorithm capable of efficiently seeking the global optimum without becoming confined to local optima. The advanced OSA is well-suited for solving intricate optimization problems that involve multiple peaks. It exhibits resilience against noise and uncertainty in the objective function. This algorithm possesses the capability to adjust and accommodate itself in environments that are characterized by noise and constant change. This adaptability renders it well-suited for practical applications where the objective function may undergo alterations over time. This algorithm will possess a reduced number of control parameters in comparison to other optimization algorithms, thereby streamlining the adjustment process. This will decrease the computational burden and facilitate its implementation and utilization in various domains. Furthermore, this algorithm has demonstrated its rapid convergence rate in numerous optimization problems. This algorithm exhibits rapid convergence towards nearly optimal solutions, thereby minimizing the computational time required to identify satisfactory solutions.
Similar to other algorithms, the OSA operates in a random manner and initiates its execution by selecting the population at random. As a search space, the population in this algorithm displays the location of owls among the forest trees. Eq. 14 illustrates the stochastic distribution of owl positions within an n × d matrix, where n is the number of owls and d is the subsequent search space (Yuan et al., 2023).
where, the matrix element Oi,j defines the j-th parameter (dimension) of the i-th owl. To create an initial state of uniform distribution, Eq. 15 has been used.
U(0,1) is a random and uniform integer between [0,1], and Ou and Ol are the upper and lower limits of the i-th owl in the j-dimension (Ren et al., 2021).
The expenditure associated with owl detection in the forest is calculated utilizing a cost function, which is represented by Eq. 16.
The expense associated with the owl’s location is proportional to the intensity of the auditory stimuli received. The owl that is closest to the target and therefore receives the greatest sound intensity is considered the best owl in this situation. The location will be updated using the data of the normalized intensity value of the i-th owl, which can be derived from Eq. 17.
The calculation of prey distance for each owl is accomplished via Eq. 18.
where, L represents the prey locations determined by employing the most appropriate owl. It is assumed by the OSA that prey exists in the forest. As they pursue their prey, owls fly slowly during the hunt. Eq. 19 represents the intensity of change caused by the i-th owl.
Equation 19 incorporates
Equation 20 represents the probability of a prey location change as denoted by ppm, while α and β represent random numbers that follow a uniform distribution and fall within the intervals of 0–0.5 and 0 to 1.9, respectively. The OSA has only one variable (β), which makes it more reliable than other algorithms.
The OSA occasionally becomes trapped in the local optimum. This flaw results in the provision of solutions that achieve early convergence. Modifications have been implemented in the OSA with the aim of enhancing its performance. In recent times, there has been an increase in the application of chaos theory due to the growing utilization of nonlinear dynamic effects in modeling. Chaos theory can have an impact on the field of optimization. In the standard OSA, the variable β is the sole stochastic value present. The utilization of variable β in every iteration leads to premature convergence. In order to avoid the system reaching a stable state too quickly, a method known as Singer mapping is employed, which introduces chaos. This method employs the unidentified variable β as a conventional equation (Eq. 21) (Verma et al., 2021).
Utilizing Lévy flight is an additional method to enhance early convergence in the OSA. Random scanning is an essential component of this approach to effectively oversee local search Eqs 22–24.
where, τ represents the LV index, which is in the rang of [0,2], A ˜ N (0, σ2), B ˜ N (0, σ2), and w represents the step size and Γ(0) describes the gamma function. A/B ˜ N (0, σ2) defines that the samples are generated from a Gaussian distribution whose mean is zero and its variance is σ2. Based on the said relationship, the new location of the owls is obtained by using Eq. 25 (Asmussen and Rosiński, 2001).
In this section, first, the statistical features of the provided dataset are reviewed, and then the results of using different models are presented and compared with each other.
Table 1 provides a concise overview of the input and output variables in this study. It presents the mathematical representation for each variable and indicates the quantity of values associated with each variable. Simulating building energy features is a commonly used strategy in researching the heating load and cooling load of a structure as specific characteristics of interest. However, the accurate simulated outcomes offer insight into the percentage variation of the likelihood and any underlying factors of the actual data process, enabling the comparison of building energy levels. One method of acquiring fundamental natural behaviors is through the utilization of data mining techniques to discern patterns. In order to enhance recognition, it is necessary to employ a sequential algorithm and incorporate rounds for pattern extraction.
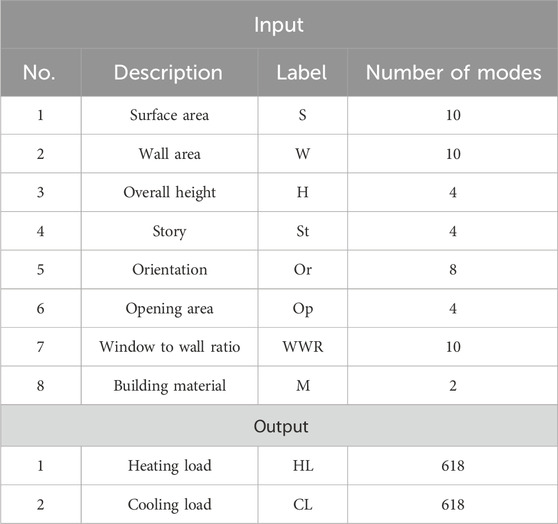
TABLE 1. Effective parameter in the study.
Following the normalization of the dataset, has been generated to illustrate the potential distribution of values for each input and output variable (Figure 1). It is evident that the input and output data do not conform to a normal distribution. Furthermore, the input data for Surface area, wall area, orientation, opening area, window to wall ratio, and building material exhibit a uniform distribution. The statistical distribution of combined cooling and heating output data is uniformly distributed. In contrast, height data do not follow a normal or uniform distribution and can be categorized as data with a random distribution. The non-normality of data distribution can be influenced by factors such as seasonal variations, special occurrences, or interference from other distributions.
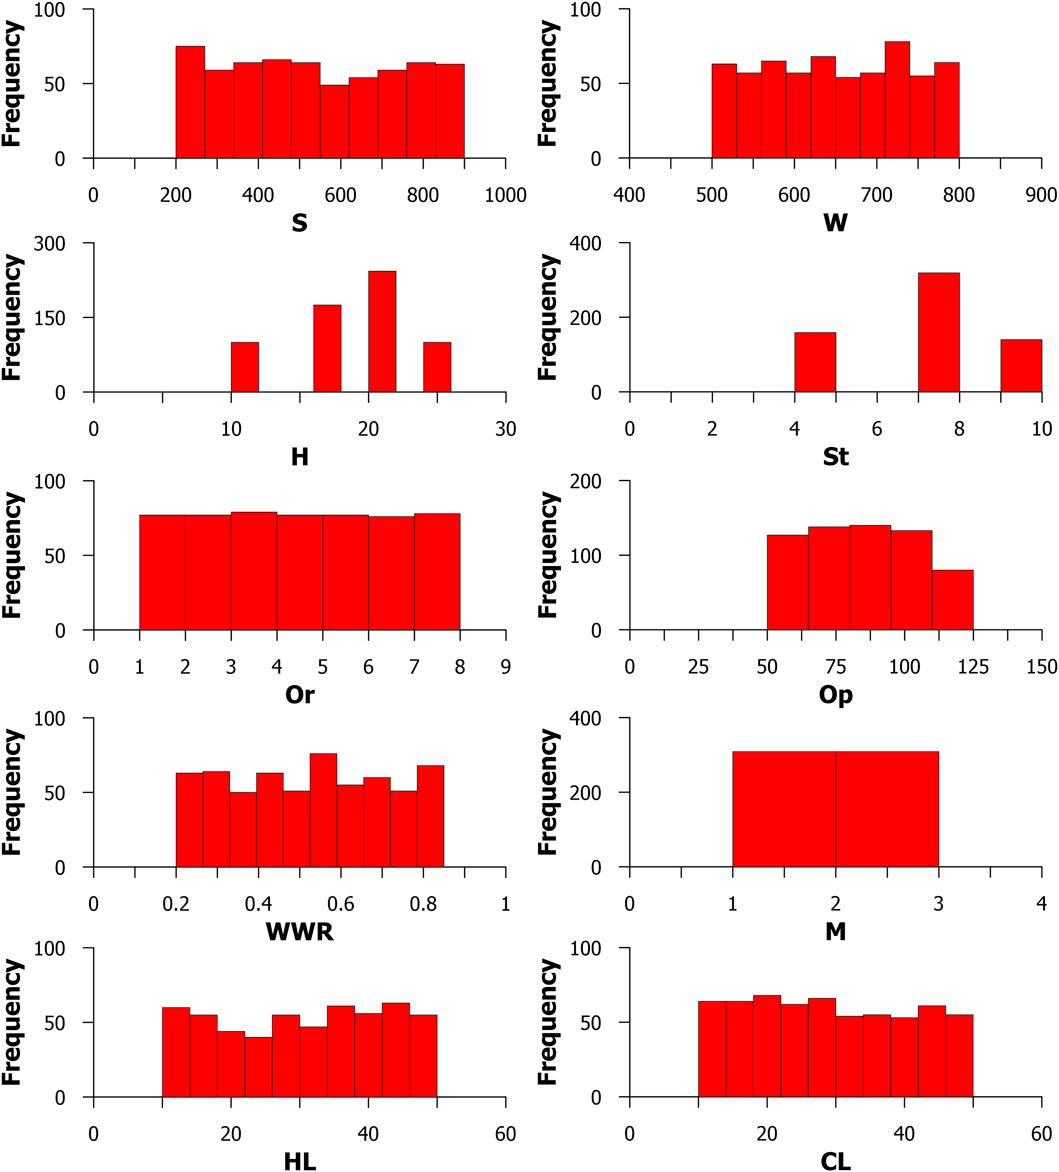
FIGURE 1. Probability distribution of input and output variables.
Figure 2 shows the relationship between the input variables and each of the heating and cooling load outputs. The results have shown that none of the variables have a specific relationship with the objective value. Therefore, due to this particular reason, it is advisable to utilize data mining techniques instead of relying on simple linear forecasting models such as linear regression to address this issue. The key observation from the results is that none of the variables exhibit a specific and straightforward relationship with the target objective value (heating and cooling load). The lack of a clear and linear association suggests that traditional linear forecasting models, such as linear regression, may not be suitable for effectively capturing the complexities within the data. As a result, it is recommended that the utilization of data mining techniques to address this issue. This implies that the dataset possesses non-linear patterns, interactions, or complexities that require more sophisticated modeling approaches beyond the capabilities of simple linear models. Data mining techniques, which encompass a range of advanced algorithms, are proposed as a more appropriate means to uncover and model the intricate relationships within the data, allowing for a more accurate and robust prediction of heating and cooling loads. The structure of Figure 2A, which illustrates the correlation between the input variables and the heating load, indicates that there is no discernible linear or non-linear relationship between this variable and the input data in issue. Figure 2B exhibits the identical problem, as does the cooling load variable of the building.

FIGURE 2. The relationship between the input variables and (A) heating load, (B) cooling load.
The correlation coefficient criterion has been utilized to assess the interdependence of the input variables (Table 2). To achieve this objective, their reliance is assessed and, if required, the dependent variables are minimized.
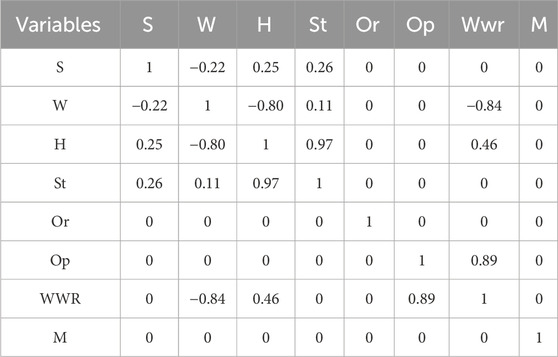
TABLE 2. Input variables dependency.
The results of examining the dependence between the variables show that the variables of compression rate and area are dependent on each other. There is no mathematical relationship between these two variables. Examining the dependency of input data reveals that certain input data are entirely independent from other data. For instance, variables such as orientation and substance are entirely autonomous from other data. The data on openings and wall-to-window ratio are just correlated. Nevertheless, both of these might be regarded as input data owing to their distinct characteristics. Furthermore, the wall size, surface area, total height, and number of levels of the building exhibit interdependence rather than complete independence. The negative symbol in the table denotes the inverse correlation between the data.
To assess the significance and impact of each variable on the output, the correlation coefficient has been utilized to examine their level of dependence on the output variables. The results of this analysis can be found in Table 3.
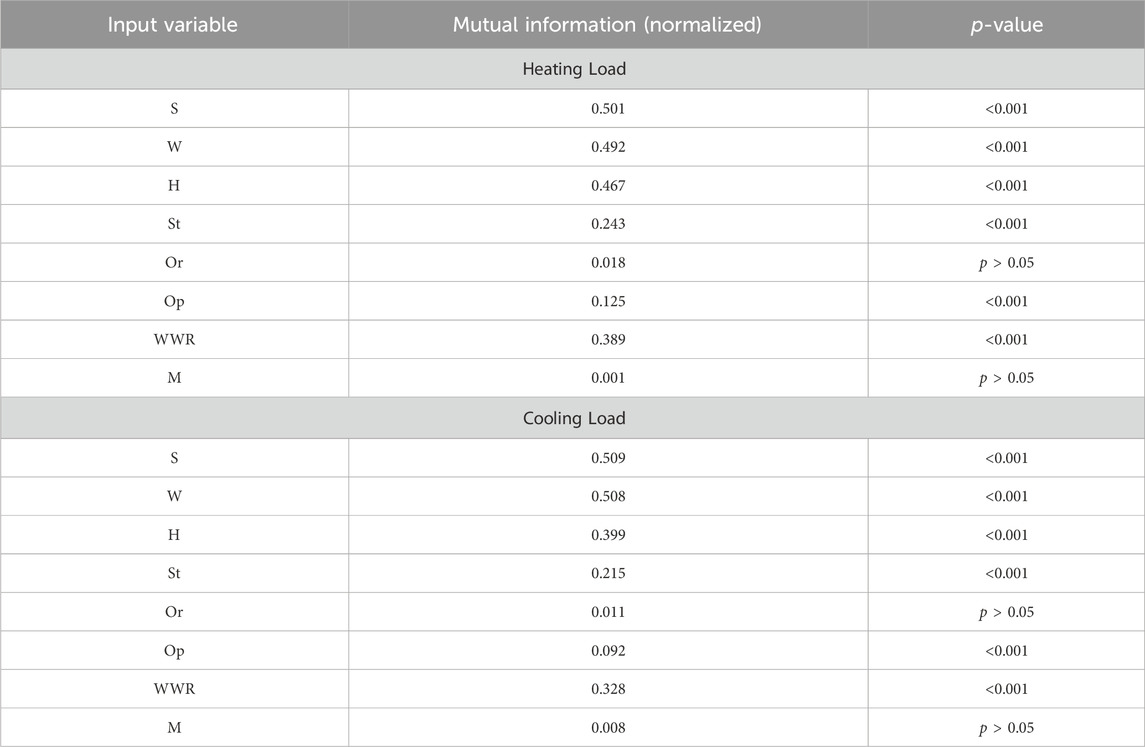
TABLE 3. Output variables dependency.
The evaluation results indicate a highly significant correlation between the variables (excluding orientation and material) and the output variables. The subsequent analysis focuses on the outcomes derived from the implementation of several models, as well as the proposed model. According to the Table 3, the variables that have the most significant influence on the building’s heating and cooling usage are surface area, wall area, and overall height. There is a direct correlation between building energy use and these three characteristics. Surface area and wall are the primary factors that contribute to energy consumption among these three variables. Indeed, augmenting the surface area results in a rise in the energy requirements for both cooling and heating the structure. Moreover, by enlarging the surface area of the building walls, the heat transfer with the external surroundings intensifies, thus impacting the energy consumption of the buildings.
A comparison is made between the fundamental model that Tsanas and Xifara (2012) presented and the outcomes that were achieved by putting the suggested models into action. According to Table 4, the results of applying support vector machine, random forest, and the hybrid models that were provided in order to forecast the required heating energy and cooling energy variables are presented.
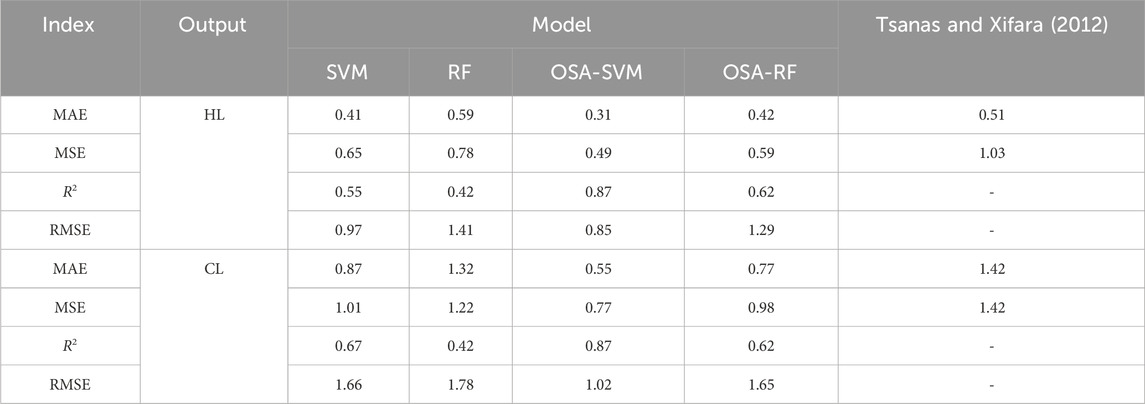
TABLE 4. Models performance results.
It is clear from the results that are shown in Table 4 that the random forest model is not as effective as the results that were obtained by Tsanas and Xifara (2012) from their research. Compared to the random forest model and Tsanas and Xifara (2012), the results that were reported for the model that was based on support vector machines indicate that its performance is greater. When it comes to estimating the amounts of energy that are necessary for heating and cooling a building, the model that was just discussed demonstrates an increased capacity and proficiency.
The outcomes of the integrated model’s implementation, which were generated by sending the weights of the input data to the integrated data mining models, have been displayed. As previously stated, the weights (coefficients of the input variables) are determined at random using this method. Therefore, in order to derive the error parameters, it is necessary to execute a minimum of 20 iterations of the algorithm and calculate the mean value, assuming the initial population is stochastic.
For comparison, the result will subsequently be disclosed. The model evaluation indices presented in Table 4 demonstrate that the models optimized using the OSA are superior. The MAE, MSE, R2, and RMSE indices for the traditional SVM model are 0.41, 0.65, 0.55, and 0.97, respectively. The MAE, MSE, R2, and RMSE indicators in the OSA-SVM model are 0.31, 0.49, 0.87, and 0.85, respectively for heating load prediction.
OSA-RF, which a hybrid model of the random forest and metaheuristic algorithm, is the second hybrid model. The model evaluation indices show that the random forest model has MAE, MSE, R2, and RMSE indices of 0.59, 0.78, 0.42, and 1.41, respectively. The MAE, MSE, R2, and RMSE indicators for the OSA-RF model are 0.42, 0.59, 0.62, and 1.29, respectively for heating load prediction.
The outcomes of the integrated OSA-SVM model indicate that this algorithm outperforms SVM by 24% and contributes to the model’s efficiency. Based on the findings, the integration of a metaheuristic algorithm with the random forest model yields comparable performance to the prior model, with an additional 11% efficiency increase for the random forest model.
This section commenced with a statistical analysis of the data prepared for this problem. Subsequently, a comparison was made between the outcomes of the newly proposed models and those of the models previously employed in the problem. The outcomes indicate that the performance of the proposed SVM-based model is superior to that of the random forest model. To enhance the performance of the metaheuristic model of OSA is conducted and a hybrid models are introduced. The findings indicate that the integrated model exhibits superior performance and can be relied upon to address the challenge of predicting the building’s cooling and heating energy requirements.
The substantial role of buildings in global energy consumption underscores the importance of advancing energy management practices, and smart buildings stand out as a pivotal evolution in this realm. This study proposes a noteworthy solution that marks a significant stride in the development of intelligent residential environments. The journey towards building intelligence commences with a meticulous evaluation and prediction of the requisite heating and cooling energy for a building, considering the myriad factors influencing it. This study introduces innovative methodologies employing data mining models to forecast the cooling and heating energy demands of smart homes. Notably, SVM and Random Forest techniques are utilized as powerful data mining tools. In this context, the improved predictive accuracy and efficiency achieved by these models compared to alternative approaches were compared.
Furthermore, metaheuristic algorithms, exemplified by the OSA, are incorporated as effective tools for optimizing outcomes across diverse problem resolutions. OSA is introduced and proposed alongside novel data mining methods, displaying its potential to enhance the performance of Random Forest and SVM-based models by 11% and 24%, respectively. A distinctive feature of the proposed models lies in their capacity to generate predictions with minimal parameters, eliminating the need for intricate software and tools. The proposed models offer a more inclusive and accessible avenue for engaging with predictive analytics in the domain of intelligent buildings.
The original contributions presented in the study are included in the article/supplementary material, further inquiries can be directed to the corresponding author.
ML: Conceptualization, Data curation, Methodology, Software, Validation, Writing–original draft, Writing–review and editing. LP: Conceptualization, Data curation, Methodology, Software, Validation, Writing–original draft, Writing–review and editing. TL: Conceptualization, Formal Analysis, Investigation, Methodology, Validation, Writing–original draft, Writing–review and editing. LZ: Data curation, Investigation, Resources, Software, Visualization, Writing–original draft, Writing–review and editing.
The author(s) declare that no financial support was received for the research, authorship, and/or publication of this article.
The authors declare that the research was conducted in the absence of any commercial or financial relationships that could be construed as a potential conflict of interest.
All claims expressed in this article are solely those of the authors and do not necessarily represent those of their affiliated organizations, or those of the publisher, the editors and the reviewers. Any product that may be evaluated in this article, or claim that may be made by its manufacturer, is not guaranteed or endorsed by the publisher.
Alhamami, A. H., Dodo, Y. A., Naibi, A. U., Alviz-Meza, A., and Mokhtarname, A. (2023). Energy-carbon emission nexus in a residential building using BIM under different climate conditions: an application of multi-objective optimization. Front. Energy Res. 11. doi:10.3389/fenrg.2023.1326967
Ali, A. I., and Zorlu Partal, S. (2022). Development and performance analysis of a ZigBee and LoRa-based smart building sensor network. Front. Energy Res. 10. doi:10.3389/fenrg.2022.933743
Aliero, M. S., Asif, M., Ghani, I., Pasha, M. F., and Jeong, S. R. (2022). Systematic review analysis on smart building: challenges and opportunities. Sustainability 14, 3009. doi:10.3390/su14053009
Apanavičienė, R., and Shahrabani, M. M. N. (2023). Key factors affecting smart building integration into smart city: technological aspects. Smart Cities 6, 1832–1857. doi:10.3390/smartcities6040085
Asmussen, S., and Rosiński, J. (2001). Approximations of small jumps of Lévy processes with a view towards simulation. J. Appl. Probab. 38, 482–493. doi:10.1239/jap/996986757
Azkune, G., Almeida, A., López-De-Ipiña, D., and Chen, L. (2015). Extending knowledge-driven activity models through data-driven learning techniques. Expert Syst. Appl. 42, 3115–3128. doi:10.1016/j.eswa.2014.11.063
Babayomi, O. O., Olubayo, B., Denwigwe, I. H., Somefun, T. E., Adedoja, O. S., Somefun, C. T., et al. (2023). A review of renewable off-grid mini-grids in Sub-Saharan Africa. Front. Energy Res. 10. doi:10.3389/fenrg.2022.1089025
Bian, X., Chen, P., Gao, Z., and Fang, G. (2023). How to promote the energy transition? —an analysis based on the size and technology effect in new energy industry. Front. Energy Res. 10. doi:10.3389/fenrg.2022.1082368
Chen, T. C., Najat Rashid, Z., Theruvil Sayed, B., Sari, A., Kateb Jumaah Al-Nussairi, A., Samiee-Zenoozian, M., et al. (2023). Evaluation of hybrid soft computing model’s performance in estimating wave height. Adv. Civ. Eng. 2023, 1–13. doi:10.1155/2023/8272566
Ejidike, C. C., Mewomo, M. C., and Anugwo, I. C. (2022). Assessment of construction professionals’ awareness of the smart building concepts in the Nigerian construction industry. J. Eng. Des. Technol., doi:10.1108/JEDT-05-2022-0263
Elnagar, E., Gendebien, S., Georges, E., Berardi, U., Doutreloup, S., and Lemort, V. (2023). Framework to assess climate change impact on heating and cooling energy demands in building stock: a case study of Belgium in 2050 and 2100. Energy Build. 298, 113547. doi:10.1016/j.enbuild.2023.113547
Ependi, U., Rochim, A. F., and Wibowo, A. (2023). An assessment model for sustainable cities using crowdsourced data based on general system theory: a design science methodology approach. Smart Cities 6, 3032–3059. doi:10.3390/smartcities6060136
Esmaeilian, B., Behdad, S., and Wang, B. (2016). The evolution and future of manufacturing: a review. J. Manuf. Syst. 39, 79–100. doi:10.1016/j.jmsy.2016.03.001
González-Torres, M., Pérez-Lombard, L., Coronel, J. F., Maestre, I. R., and Yan, D. (2022). A review on buildings energy information: trends, end-uses, fuels and drivers. Energy Rep. 8, 626–637. doi:10.1016/j.egyr.2021.11.280
Hafez, F. S., Sa’di, B., Safa-Gamal, M., Taufiq-Yap, Y. H., Alrifaey, M., Seyedmahmoudian, M., et al. (2023). Energy efficiency in sustainable buildings: a systematic review with taxonomy, challenges, motivations, methodological aspects, recommendations, and pathways for future research. Energy Strategy Rev. 45, 101013. doi:10.1016/j.esr.2022.101013
He, Q., Tapia, F., and Reith, A. (2023). Quantifying the influence of nature-based solutions on building cooling and heating energy demand: a climate specific review. Renew. Sustain. Energy Rev. 186, 113660. doi:10.1016/j.rser.2023.113660
Himeur, Y., Elnour, M., Fadli, F., Meskin, N., Petri, I., Rezgui, Y., et al. (2023). AI-big data analytics for building automation and management systems: a survey, actual challenges and future perspectives. Artif. Intell. Rev. 56, 4929–5021. doi:10.1007/s10462-022-10286-2
Hu, L., Hu, J., and Huang, W. (2023). Evolutionary analysis of the solar photovoltaic products trade network in belt and road initiative countries from an economic perspective. Energies 16, 6371. doi:10.3390/en16176371
Ilham, Z., Saad, N. A. I., Imad Wan-Mohtar, W. A.Al Q., and Jamaludin, A. A. (2022). Multi-criteria decision analysis for evaluation of potential renewable energy resources in Malaysia. Prog. Energy Environ. 21, 8–18. doi:10.37934/progee.21.1.818
Jain, M., Maurya, S., Rani, A., and Singh, V. (2018). Owl search algorithm: a novel nature-inspired heuristic paradigm for global optimization. J. Intelligent Fuzzy Syst. 34, 1573–1582. doi:10.3233/JIFS-169452
Kunkcu, H., Koc, K., and Gurgun, A. P. (2022). “A review of machine learning methods in building energy performance assessment,” in Proceedings of the 7th World Congress on Civil, Structural, and Environmental Engineering, Virtual Conference, April, 2022. doi:10.11159/icsect22.174
Lei, L., Wu, B., Fang, X., Chen, L., Wu, H., and Liu, W. (2023). A dynamic anomaly detection method of building energy consumption based on data mining technology. Energy 263, 125575. doi:10.1016/j.energy.2022.125575
Liao, H., Ren, R., and Li, L. (2023). Existing building renovation: a review of barriers to economic and environmental benefits. Int. J. Environ. Res. Public Health 20, 4058. doi:10.3390/ijerph20054058
Liu, X., Sun, H., Han, S., Han, S., Niu, S., Qin, W., et al. (2022). A data mining research on office building energy pattern based on time-series energy consumption data. Energy Build. 259, 111888. doi:10.1016/j.enbuild.2022.111888
Liu, Y., Chen, H., Zhang, L., Wu, X., and Wang, X. (2020). Energy consumption prediction and diagnosis of public buildings based on support vector machine learning: a case study in China. J. Clean. Prod. 272, 122542. doi:10.1016/j.jclepro.2020.122542
Ma, Z., Ye, C., Li, H., and Ma, W. (2018). Applying support vector machines to predict building energy consumption in China. Energy Procedia 152, 780–786. doi:10.1016/j.egypro.2018.09.245
Misbah Inayat, S., Rafay Zaidi, S. M., Ahmed, H., Ahmed, D., Kausar Azam, M., and Ahmad Arfeen, Z. (2023). Risk assessment and mitigation strategy of large-scale solar photovoltaic systems in Pakistan. Int. J. Industrial Eng. Manag. 14, 105–121. doi:10.24867/IJIEM-2023-2-327
Molajou, A., Afshar, A., Khosravi, M., Soleimanian, E., Vahabzadeh, M., and Variani, H. A. (2021). A new paradigm of water, food, and energy nexus. Environ. Sci. Pollut. Res. 30, 107487–107497. doi:10.1007/s11356-021-13034-1
Nikbakht Naserabad, S., Akbari Vakilabadi, M., and Ahmadi, M. H. (2023). Commercial building integrated energy system: sizing and energy-economic assessment. Int. J. Low-Carbon Technol. 18, 714–726. doi:10.1093/ijlct/ctad050
Pouladi, P., Afshar, A., Molajou, A., and Afshar, M. H. (2020). Socio-hydrological framework for investigating farmers’ activities affecting the shrinkage of Urmia Lake; hybrid data mining and agent-based modelling. Hydrological Sci. J. 65, 1249–1261. doi:10.1080/02626667.2020.1749763
Raihan, A., Pavel, M. I., Muhtasim, D. A., Farhana, S., Faruk, O., and Paul, A. (2023). The role of renewable energy use, technological innovation, and forest cover toward green development: evidence from Indonesia. Innovation Green Dev. 2, 100035. doi:10.1016/j.igd.2023.100035
Ren, X., Wu, Y., Hao, D., Liu, G., and Zafetti, N. (2021). RETRACTED: analysis of the performance of the multi-objective hybrid hydropower-photovoltaic-wind system to reduce variance and maximum power generation by developed owl search algorithm. Energy 231, 120910. doi:10.1016/j.energy.2021.120910
Sami Khafaga, D., El-kenawy, M., Ali Alhussan, A., and Eid, M. (2023). Forecasting energy consumption using a novel hybrid dipper throated optimization and stochastic fractal search algorithm. Intelligent Automation Soft Comput. 37, 2117–2132. doi:10.32604/iasc.2023.038811
Selvaraj, R., Kuthadi, V. M., and Baskar, S. (2023). Smart building energy management and monitoring system based on artificial intelligence in smart city. Sustain. Energy Technol. Assessments 56, 103090. doi:10.1016/j.seta.2023.103090
Shao, M., Wang, X., Bu, Z., Chen, X., and Wang, Y. (2020). Prediction of energy consumption in hotel buildings via support vector machines. Sustain. Cities Soc. 57, 102128. doi:10.1016/j.scs.2020.102128
Tajfar, I., Pazoki, M., Pazoki, A., Nejatian, N., and Amiri, M. (2023). Analysis of heating value of hydro-char produced by hydrothermal carbonization of cigarette butts. Pollution 9, 1273–1280. doi:10.22059/poll.2023.335704.1293
Taner, T. (2021). The novel and innovative design with using H2 fuel of PEM fuel cell: efficiency of thermodynamic analyze. Fuel 302, 121109. doi:10.1016/j.fuel.2021.121109
Tsanas, A., and Xifara, A. (2012). Accurate quantitative estimation of energy performance of residential buildings using statistical machine learning tools. Energy Build. 49, 560–567. doi:10.1016/j.enbuild.2012.03.003
Verma, P., Alam, A., Sarwar, A., Tariq, M., Vahedi, H., Gupta, D., et al. (2021). Meta-heuristic optimization techniques used for maximum power point tracking in solar PV system. Electronics 10, 2419. doi:10.3390/electronics10192419
Wang, Z., Wang, Y., Zeng, R., Srinivasan, R. S., and Ahrentzen, S. (2018). Random Forest based hourly building energy prediction. Energy Build. 171, 11–25. doi:10.1016/j.enbuild.2018.04.008
Wu, Z., and Chu, W. (2021). “Sampling strategy analysis of machine learning models for energy consumption prediction,” in 2021 IEEE 9th International Conference on Smart Energy Grid Engineering (SEGE), Oshawa, Canada, August, 2021, 77–81. doi:10.1109/SEGE52446.2021.9534987
Xiao, Z., Fan, C., Yuan, J., Xu, X., and Gang, W. (2021). Comparison between artificial neural network and random forest for effective disaggregation of building cooling load. Case Stud. Therm. Eng. 28, 101589. doi:10.1016/j.csite.2021.101589
Youssef, H., Kamel, S., Hassan, M. H., and Nasrat, L. (2023). Optimizing energy consumption patterns of smart home using a developed elite evolutionary strategy artificial ecosystem optimization algorithm. Energy 278, 127793. doi:10.1016/j.energy.2023.127793
Yuan, K., Ma, Y., Zhang, H., Razmjooy, N., and Ghadimi, N. (2023). Optimal parameters estimation of the proton exchange membrane fuel cell stacks using a combined owl search algorithm. Energy Sources, Part A Recovery, Util. Environ. Eff. 45, 11712–11732. doi:10.1080/15567036.2023.2252672
Keywords: building energy consumption, smart home, metaheuristic methods, data mining, support vector machine, random forest, owl search algorithm
Citation: Lin M, Peng L, Liu T and Zhang L (2024) Novel approach to energy consumption estimation in smart homes: application of data mining and optimization techniques. Front. Energy Res. 12:1361803. doi: 10.3389/fenrg.2024.1361803
Received: 26 December 2023; Accepted: 22 January 2024;
Published: 08 February 2024.
Edited by:
Mohammad Hossein Ahmadi, Shahrood University of Technology, IranReviewed by:
Mojtaba Mirzaei, Energy Institution of Higher Education, IranCopyright © 2024 Lin, Peng, Liu and Zhang. This is an open-access article distributed under the terms of the Creative Commons Attribution License (CC BY). The use, distribution or reproduction in other forums is permitted, provided the original author(s) and the copyright owner(s) are credited and that the original publication in this journal is cited, in accordance with accepted academic practice. No use, distribution or reproduction is permitted which does not comply with these terms.
*Correspondence: Mengyuan Lin, bGlubWVuZ3l1YW43N0AxMjYuY29t
Disclaimer: All claims expressed in this article are solely those of the authors and do not necessarily represent those of their affiliated organizations, or those of the publisher, the editors and the reviewers. Any product that may be evaluated in this article or claim that may be made by its manufacturer is not guaranteed or endorsed by the publisher.
Research integrity at Frontiers
Learn more about the work of our research integrity team to safeguard the quality of each article we publish.