 Xin Kuo
 Zhang Hongxuan
- Dispatching and Control Center, China Southern Power Grid, Guangzhou, Guangdong, China
Introduction: In order to dispatch frequency regulation resources in regional power grids efficiently and promote the development of spot markets, China Southern Power Grid (CSG) established the unified frequency regulation control area. However, the existing regional control performance standards (CPS) for evaluating the performance of frequency control in bulk power systems is no longer suitable for the unified frequency control mode.
Method: This paper proposed an innovative frequency control performance standard, named tertiary control performance standards (TCPS) and used Gaussian mixture model (GMM) and folded normal distribution (FND) to describe the distributions of frequency deviations and power deviations of tie line.
Result and Discussion: Based on these probability models, the parameters of the proposed TCPS can be determined optimized. Finally, case studies were carried out with the practical data from CSG and indicated that the parameters of proposed TCPS index could be calculated and improved the control performance for the real time power balance of the regional power grid with spot markets.
1 Introduction
Nowadays, the controllable generators with large capacities in China are dispatched by dispatch and control centers at different levels, such as the dispatch and control center of China Southern Power Grid (CSG) and provincial dispatch and control centers. These generators with large capacities are valuable resources for the frequency control of power systems and are dispatched by different dispatch and control centers. The frequency control system of power systems consists of three loops: a primary frequency control loop, a secondary frequency control loop, and a tertiary frequency control loop. The secondary and tertiary frequency control tasks are primarily conducted by the provincial dispatch and control center and the dispatch and control center of CSG (Jaleeli and Vanslyck, 1999; Yao et al., 2000; Power system frequency regulation and automatic generation control committee, 2006; Wang, 2015a). Such a traditional operation method has some drawbacks. First, the decentralized frequency regulation strategy for all regulation resources may cause local optimization in the provincial power grids rather than global optimization in regional power grids. Second, under the environment of regional spot markets, the frequency regulation services provided by the generators in different provinces need to compete in the same market, which does not meet the requirements of market fairness (Wang, 2015b). In order to establish a more efficient mechanism for dispatching frequency regulation resources and promote the construction of the regional spot market, CSG has established a unified frequency control area in 2018. The frequency regulation resources were allocated by a unified control module, ensuring the global optimization of frequency regulation resources and fair competition in the market environment.
The control performance standard (CPS) for regional power grids, initially proposed in North America (Chang et al., 2016), has become one of the most widely used evaluation indices of reliability for real-time power balance (Wang, 2012; Xiong, 2012; Zhang et al., 2015; Zhao et al., 2016a). China has made some improvements to the North American CPS (Wang, 2000; Yu et al., 2012; Weng et al., 2013). Some literature studies have investigated the impacts of wind power integration on the CPS and proposed concepts such as wind-to-fuel-equivalent power plants (Li et al., 2016) and improvements in CPS assessment and settlement methods (Jing et al., 2011; Yu et al., 2011; Chen, 2014; Yan, 2014; Zhao et al., 2016b; Zhang, 2016; Lu, 2018; Wei et al., 2019; Zhao, 2019; Zhao et al., 2019). Some literature studies have improved the CPS and proposed new evaluation indices such as the ES index (Wang, 2019), DT index (Wang, 2019), and C index (Zhang et al., 2016) to address the performance evaluation problems of AGC control under complex scenarios (Shan et al., 2015; Chang et al., 2019; Cao et al., 2023). For the evaluation of the power control performance of the tie-line, researchers have proposed an innovative T2 index (Yang et al., 2015; Liu et al., 2017).
Although the above indices have improved the traditional CPS, they are still insufficient to adapt to the unified frequency control zone of CSG and the environment of the regional spot markets. There are two major limitations. First, the CPS indices are widely applied to evaluate the performance of secondary frequency control for provincial dispatch and control centers in China. However, the establishment of the unified frequency control zone in CSG improved the traditional operation method of implementing secondary frequency control within each provincial dispatch and control center. The short-term power balance within 1 min to 10 min in the unified frequency control zone in CSG was maintained and controlled by a unified control module. Second, the CPS indices focus on the control accuracy of the area control error (ACE) for the provincial dispatch and control centers in the short term. As a consequence, the system operators need to adjust the output power of all generators frequently. Such an operation method could not be adopted within the competitive trading mechanism; it contributes to the development of the power spot market, including auxiliary services.
Considering the various factors of power system operation, including grid security, efficiency, and spot market construction, this paper proposes a set of innovative indices for evaluating the performance of frequency control, named tertiary control performance standards (TCPS) (Jaleeli and Vanslyck, 1999; Yao et al., 2000; Power system frequency regulation and automatic generation control committee, 2006), to facilitate the development of spot markets and improve the control performance of power balance in real time.
2 The TCPS index system
In order to improve the CPS indices, which cause excessive and frequent adjustments in the short-term time scale of 1–10 min, the proposed TCPS indices are represented with details in this section.
2.1 Limitations to the CPS index system
The CPS was proposed by the North American Electric Reliability Council (NERC) in 1997 and is currently the most widely used evaluation indices for frequency control in China. In CSG, the CPS indices consist of two indices: CPS1 and CPS2.
2.1.1 CPS1 index
The CPS1 index can be represented in Eqs 1, 2 as follows:
Here,
When
To expand CPS1 for evaluating the control performance during the assessment period, the following requirements should be satisfied, the details are represented in Eq. 4 as follows,
Here,
2.1.2 CPS2 index
The CPS2 index requires that the average absolute value of
In the above equation,
2.1.3 The evaluation of control performance based on CPS indices
The control performance of each control area should meet both CPS1 and CPS2 standards. The details are represented in Table 1 as follows:
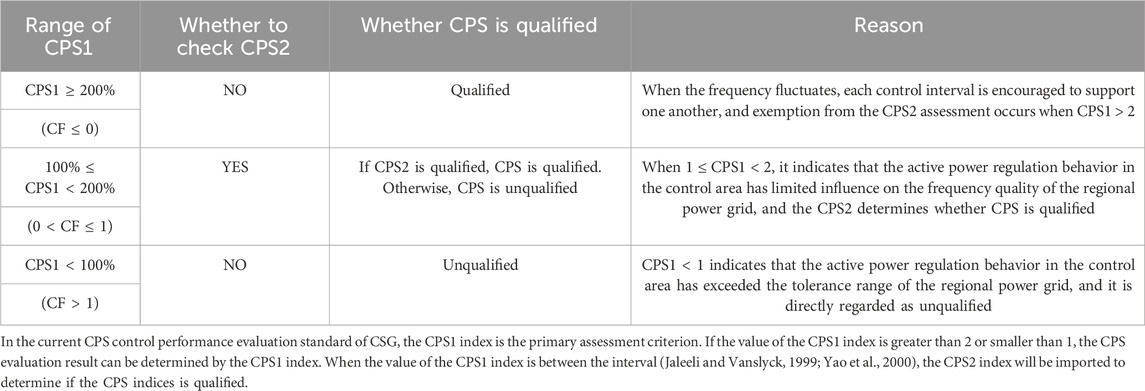
Table 1. Standard of CPS.
2.1.4 Limitations to the CPS index system
Since the implementation of the CPS indices in 2007, the quality of frequency control has improved in CSG. However, with the implementation of the unified frequency control area in CSG and the establishment of regional spot markets, the CPS indices encounter some limitations as follows:
1. Before the establishment of the unified frequency control area in the CSG, the CPS indices were primarily used to evaluate the frequency control performance of each control area within 1–10 min, which aligns with the time scale of secondary frequency control. After the establishment of the unified frequency control area in CSG, the coordinated flat frequency control (CFFC) system was applied to coordinate and allocate the secondary frequency control set points for various provincial dispatch and control centers. However, the compatibility between the CPS evaluation indices and the new secondary frequency control architecture of CSG is insufficient (Song, 2015).
2. Under the current clearing rules of the spot and auxiliary service markets, the secondary frequency regulation of the units only responds to the frequency deviation Δf during real-time operation and does not respond to the power deviation of the inter-provincial tie-line. Therefore, it is in conflict with the ACE component of CPS indices (Shi, 2016).
3. There are some inherent defects in CPS indices. For example, the parameters of the CPS indices are calculated based on the assumption that both ACE and Δf follow normal distributions. It may cause large errors when the distributions of ACE and Δf are not normal. Moreover, the assessment method that takes short-term averaging values to calculate CPS indices reduces the evaluation result of CPS indices (Ge et al., 2001).
Taking the above factors into consideration, the CPS assessments were canceled for the provincial dispatch and control centers in the early stages of the frequency regulation auxiliary service market of CSG. However, after the cancellation of the assessments, the quality of frequency control was reduced, and the frequency deviation could not be controlled back to zero in some periods. Therefore, it is necessary to propose new evaluation indices for frequency control in power systems with tie-line connections.
2.2 The TCPS index system
To ensure that the new indices can be compatible with the unified frequency control architecture of CSG and adapt to the regional spot markets, the design of indices should be guided by the following three objectives: first, the new indices need to maintain the frequency quality for the whole power grid, ensure the security of the regional grid, and implement dispatch schedules. Second, considering the needs of regional spot market construction, the new indices should reduce the times of manual adjustment by dispatch and control centers, ensure a fair market competition environment, and reduce the operation costs of the power grid. Third, the new indices can overcome the defects of the traditional decentralized dispatch mode of frequency regulation resources and improve the efficiency of resource allocation. The TCPS index system has been proposed in this paper to achieve these objectives. For the proposed index system, the main highlights are listed as follows:
1. Compared with the time interval of 10 min for the traditional CPS indices, the time scale was increased to 15/30 min in this paper to evaluate the active power balance in the tertiary frequency control loop for the power grids.
2. Following the design ideas of CPS1 and CPS2, this paper improves the method of determining the key parameters for the improved TCPS1 and TCPS2 indices. It also proposes a new method for determining the optimal threshold for the TCPS indices.
3. Improvements are made to the exemption mechanism of the operation data, along with the formulation of detailed exemption rules under some situations, such as the cases of bad weather and recoveries from complex accidents, ensuring these data were deleted for the evaluation and take no effect for the calculations with the indices.
The proposed TCPS indices consisted of TCPS1, TCPS2, and a minute-level TCPS index.
2.2.1 TCPS1 index
The TCPS1 index is similar to the CPS1 index, and its definition was given in Eq. 8 as follows:
Compared with CPS1, the assessment time scale for TCPS1, as shown in Eq. 9, was increased to 30 min, which was represented by n = 30 in Eq. 6. Increasing the assessment time scale could avoid situations where the CPS1 index becomes unqualified under the time scale of 10 min due to the actions caused by the secondary frequency control. As a result of increasing the assessment period of TCPS1 to 30 min, the proposed TCPS1 index focuses on the control actions of active power in the 10–30-min time scale.
2.2.2 TCPS2 index
During the assessment period of 30 min, the TCPS2 index requires controlling the average absolute value of the power deviations of the tie-line to be lower than the threshold, which is expressed as follows:
Here,
However, the distributions of the power deviations of the tie-lines do not follow normal distributions, and there is no significant linear relationship between the B parameter and the power deviations of the tie-lines in some practical cases. Therefore,
2.2.3 Minute-level and 30-min-level TCPS indices
The TCPS indices mainly focus on the performance of tertiary frequency control in the power systems. In order to prevent provincial dispatch and control centers excessively pursuing a negative average of the ACE in a 30-min period, which can result in overregulation or reverse regulation, this paper proposes minute-level TCPS scores, denoted as
According to Eqs 12–14, if tertiary frequency control in the control area results in
In general,
2.2.4 Performance evaluation system based on TCPS indices
The CPS mainly comprises three indices: TCPS1, TCPS2, and
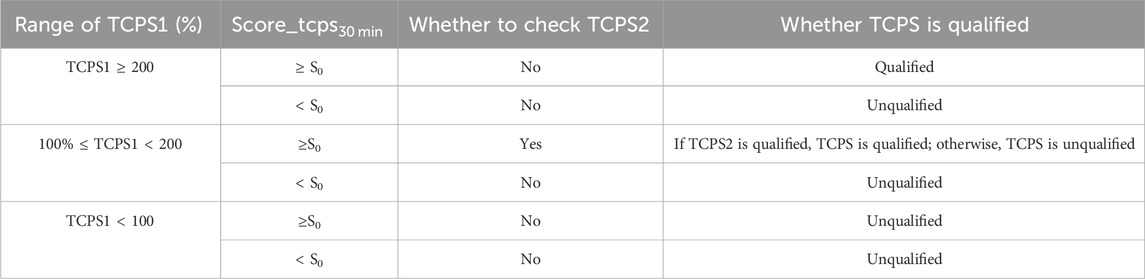
Table 2. Criteria for the assessment with TCPS indices.
The reason for using TCPS1 as the dominant index is that the regional power grid encourages each control area to maintain a negative ACE within a 30-min time scale to ensure the security of frequency control. The reason for using
3 The calculation method of the key parameters for the TCPS index system
3.1 The calculation method of the L_30 parameter in the TCPS index system
The
1. As shown in Figure 1, due to the existence of the dead zones of primary and secondary frequency control, the frequency deviations
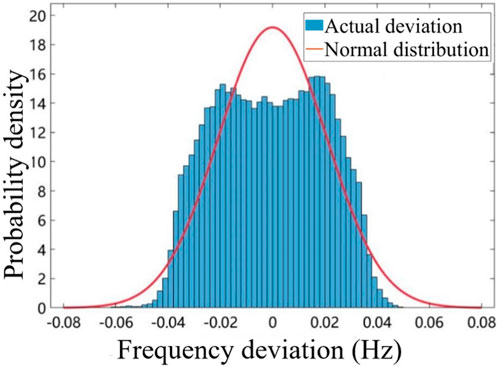
Figure 1. Actual frequency distribution of the central and eastern main networks of China Southern Power Grid.
Here,
The GMM, as described in Eqs 16, 17, can be applied to describe the non-unimodal distribution shown in Figure 1 for the frequency deviations
As shown in Figure 2, the distributions of
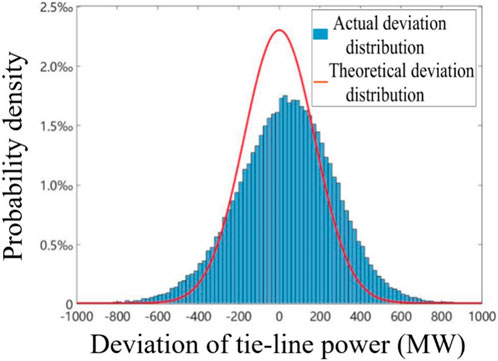
Figure 2. Actual deviation distribution of the tie-line and theoretical deviation distribution of tie-line power.
In order to satisfy the needs of the operation of the power grid and consider the scenarios of the TCPS2 index, where the TCPS2 index was applied only when 1 < TCPS1 < 2, the dataset C of
1. In the time scale of minutes, the dataset of
2. Based on C1, the samples of
3.
The cumulative distribution function of
The result can be represented in Eq. 20 as follows:
Finally, we can get Eq. 21:
Thus, the analytical expression for the cumulative distribution of

Figure 3. Actual distribution of the 30-min absolute mean value of tie-line power.
A percentile of 90 was chosen to determine the value of
3.2 The calculation method of S_0 in the TCPS index system
The purpose of setting the 30-min TCPS index
The calculation method of the
1. Obtain the annual data on
2. Calculate
3. Calculate
The
4 Examples of dispatching the control performance evaluation based on the TCPS indicator system
4.1 Frequency quality evaluation in the early stages of the frequency regulation auxiliary service market
Since September 2018, the frequency regulation auxiliary service market has started the trial operation of settlements in Guangdong province. In the early stages of setting up the auxiliary service market, the CSG’s central dispatching canceled the CPS assessment of the provincial dispatch and control centers. During this period, the RMS of the minute-average frequency deviations of CSG increased by approximately 0.001 Hz, which equals to approximately 4%, and the frequency quality was reduced.
Moreover, the frequency was maintained at some specified value for a long time, several times. As shown in Figure 4, on a certain early morning during this period, the frequency was kept at approximately 50.04 Hz for more than 30 min. After canceling the CPS assessment, the dispatch and control centers did not implement effective tertiary frequency controls, resulting in continuous deployment and even exhaustion of the secondary frequency regulation reserves in some periods. As a result, similar cases occurred during the same period. Therefore, it is necessary to design reasonable evaluation indices for tertiary frequency control.
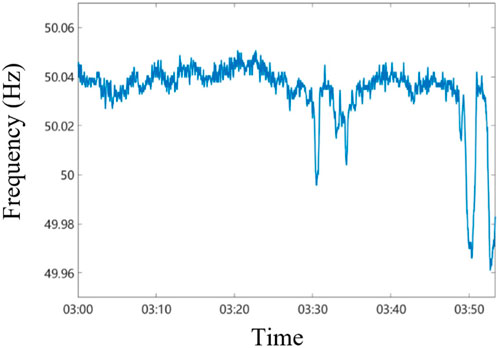
Figure 4. Frequency data on the early morning of the specified day.
4.2 Comparison of frequency control performance with TCPS and CPS indices
The calculation results of

Figure 5. Calculation of the L30 parameter.
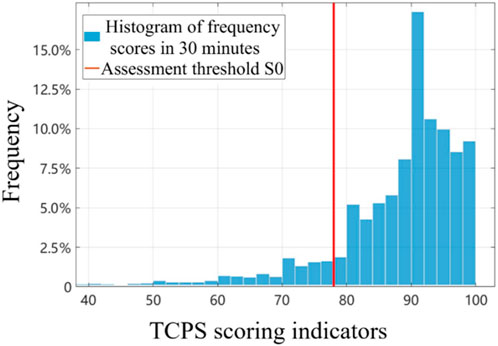
Figure 6. Calculation of the S0 parameter.
To calculate the analytical expression of the GMM represented in Section 3.1, the following steps should be followed:
1. Calculate the log likelihood function of the GMM.
where the specific normal distribution
Eq. 26 indicates the lower bound of Eq. 23. Obtaining the value of
Based on the Bayes’ formula, it can be obtained as follows:
Eq. 28 can be solved using maximum likelihood estimation. The result is represented in Eq. 29 as follows:
The best estimation results of the GMM can be obtained by calculating the partial derivative of each parameter. According to the best estimation results, the quantile results of the GMM can be obtained. In practical cases, the optimal result of
After the establishment of the TCPS index system, the dispatch and control center of CSG conducted the TCPS assessments for all provincial dispatch and control centers within the unified frequency control area of CSG from May to September 2020. Meanwhile, the traditional CPS indices were also calculated as a reference. As shown in Tables 3, 4, TCPS1 of dispatch and control center A was kept within the interval (Jaleeli and Vanslyck, 1999; Yao et al., 2000) in more than 90% of the operation periods, indicating effective control over the power deviations of the tie-line. The comprehensively qualified rate was 86.09%. For the dispatch and control center B, the number of periods for TCPS1 > 2 is relatively high, which indicates that the dispatch and control center responded to the frequency deviations actively, providing inter-provincial power support. However, in the 30-min average score index,
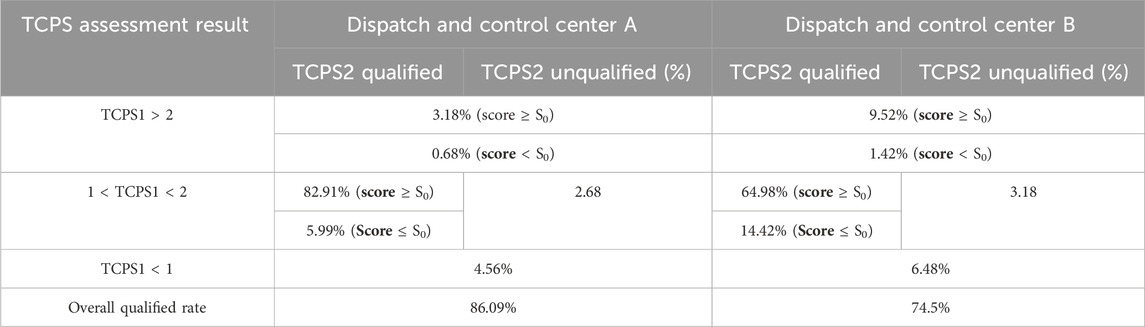
Table 3. TCPS results of dispatch and control centers A and B.
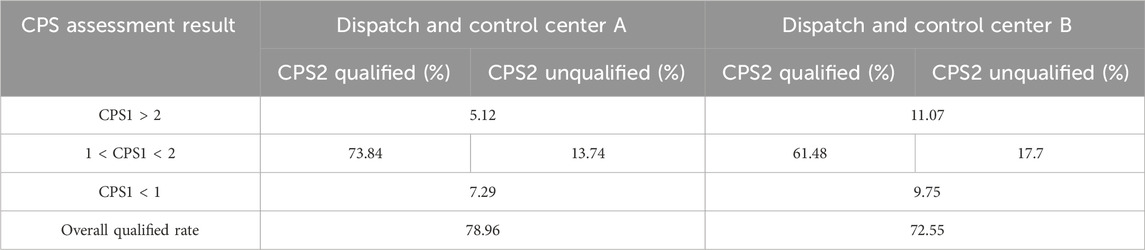
Table 4. CPS assessment results of dispatch and control centers A and B.
Comparing Tables 3, 4, the comprehensive qualified rates of both dispatch and control centers A and B were reduced under the traditional CPS indices with shorter evaluation periods. After the unified frequency control mode replaced the traditional mode, the traditional CPS indices were not suitable to evaluate the frequency quality, and the proposed TCPS indices could coordinate the generation units more effectively.
5 Conclusion and prospect
With the establishment of the unified frequency control zone in CSG and the development of the regional spot markets, the traditional CPS indices have encountered some limitations. The authors proposed an innovative frequency control performance index system called TCPS and methods for calculating the key parameters. The findings of this paper can be summarized as follows:
(1) The practical operation data on CSG were collected to verify the evaluation results of the TCPS indices. The results showed that the TCPS indices can effectively evaluate the frequency control quality at the 30-min level for provincial dispatch and control centers.
(2) Moreover, since the dispatch and control center of CSG implemented the TCPS indices with a longer evaluation time period of 30 min, the RMS value of frequency deviations has decreased by approximately 0.002 Hz in June 2020 compared with 2019. The occurrences of the frequency deviations that could not be controlled back to zero have been significantly reduced by 70%.
(3) The construction of the unified frequency control area by CSG adapts to the development of the regional auxiliary service market and the power spot markets, improving the dispatch efficiency of frequency regulation resources. It breaks the barriers of inter-provincial frequency regulation resources and establishes a new technical framework.
(4) In accordance with the unified frequency control zone, the dispatch and control center of CSG has innovatively proposed a TCPS index system. Currently, the system could evaluate the control quality of tertiary frequency control effectively and improve the operation security of the bulk power system of CSG.
In the future, the TCPS index and assessment system could improve the control quality for all provincial dispatch and control centers and be compatible with the autopilot systems for CSG.
Data availability statement
The original contributions presented in the study are included in the article/Supplementary material; further inquiries can be directed to the corresponding author.
Author contributions
XK: writing–original draft and writing–review and editing. ZH: writing–original draft and writing–review and editing. WW: writing–original draft and writing–review and editing. CJ: writing–original draft and writing–review and editing. LQ: writing–original draft and writing–review and editing.
Funding
The author(s) declare that no financial support was received for the research, authorship, and/or publication of this article.
Conflict of interest
Authors XK, ZH, WW, CJ, and LQ were employed by China Southern Power Grid.
Publisher’s note
All claims expressed in this article are solely those of the authors and do not necessarily represent those of their affiliated organizations, or those of the publisher, the editors, and the reviewers. Any product that may be evaluated in this article, or claim that may be made by its manufacturer, is not guaranteed or endorsed by the publisher.
References
Cao, Y., Zhou, B., Chung, C. Y., Shuai, Z., Hua, Z., and Sun, Y. (2023). Dynamic modelling and mutual coordination of electricity and watershed networks for spatio-temporal operational flexibility enhancement under rainy climates. IEEE Trans. Smart Grid 14 (5), 3450–3464. doi:10.1109/tsg.2022.3223877
Chang, Y, Li, W., Ba, Y, Liu, Y, and Wang, H (2019). A new method for frequency control performance assessment on operation security. Trans. China Electrotech. Soc. 34 (6), 1218–1228. doi:10.19595/j.cnki.1000-6753.tces.180240
Chang, Y., Liu, R., Ba, Y., Li, W., Teng, X., et al. (2016). Analysis of balancing authority ACE limit standard of North America. Power Syst. Technol. 40 (1), 256–268. (in Chinese). doi:10.13335/j.1000-3673.pst.2016.01.035
Chen, R. (2014). Analysis of power grid frequency control based on CPS2 standard. Yunnan Electr. Power 42 (3), 29–46.
Ge, J., Tong, L., Geng, J., and Han, G. (2001). Research on thyristor conduction angle characteristics in transient process of TCSC. Power Syst. Technol. 25 (7), 18–22. (in Chinese). doi:10.13335/j.1000-3673.pst.2001.07.006
Jaleeli, N., and Vanslyck, L. S. (1999). NERC's new control performance standards. IEEE Trans. Power Syst. 14 (3), 1092–1099. doi:10.1109/59.780932
Jing, L, Ying, Q., Caixia, W., Zongxinag, L., and Kai, B. (2011). Lmpact of large-scale wind power integration on CPS. South. Power Syst. Technol. 8 (6), 98–103. doi:10.13648/j.cnki.issn1674-0629.2014.06.020
Li, Z., Huang, Y., Zhang, P., Ji, M., and Fang, C. (2016). A study about the automatic generation control strategy of large scale wind-gas coordinating equivalent power plant. Power Syst. Prot. Control 44 (4), 44–50.
Liu, X., Yan, F., Xu, W., Hu, W., and Zhang, Y. (2017). T2 criteria for evaluating interchange power error on tie lines of an interconnection. Power Syst. Technol. 41 (6), 1880–1887. (in Chinese). doi:10.13335/j.1000-3673.pst.2016.2245
Lu, X. (2018). Research on control standard of tie-line overload. Dalian: Dalian University of Technology.
Power system frequency regulation and automatic generation control committee (2006). Power system frequency regulation and automatic generation control (Beijing: Beijing China Power). (in Chinese).
Shan, M., Yang, S., Yong, T., and Yong, J. (2015). An active power control performance evaluation model for interconnected power grid adapted to the large-scale wind power integration. Proc. CSEE 35 (13), 3221–3230. doi:10.13334/j.0258-8013.pcsee.2015.13.004
Shi, J. (2016). Coordinate control of boiler, turbine and grid for the primary frequency regulation. Harbin: Harbin Institute of Technology.
Song, X. (2015). Research on regional power grid's automatic generation control performance assessment improvement based on control performance standard. Shanghai: Shanghai Jiao Tong University.
Wang, D. (2000). Study of CPS standards in East China power grid. Automation Electr. power Syst. 24 (8), 41–44. (in Chinese).
Wang, D. (2012). Academic discussions on CPS application. Automation Electr. Power Syst. 36 (15), 73–79.
Wang, H. (2015a). Multi-objective strategy for smart generation control and equilibrium reinforcement learning theory. Guangzhou: South China University of Technology. (in Chinese).
Wang, W. (2015b). Research on automatic generation control strategy based on CPS. Dalian: Dalian University of Technology.
Wang, Y. (2019). Research on active power control performance index of subarea power grid under complex operating scenarios. Baoding: North China Electric Power University.
Wei, F., Bowen, Z., Xin, Z., and Yukun, L. (2019). Optimization research on CPS assessment of interconnected grid under high penetration of wind power. Northeast Electr. Power Technol. 40 (5), 10–12.
Weng, Y., Deng, C., Huang, W., Xiao, Y., and Yan, X. (2013). Research of CPS based on statistical theory for interconnected power grid with wind power. Automation Electr. Power Syst. 31 (19), 79–84.
Xiong, W. (2012). An applicability analysis on CPS assessment of different load scales automation of electric power systems 36 (15), 78–81.
Yan, W. (2014). Application of the synthesis of bacterial foraging algorithm and particle swarm in power grid CPS economic assessment. Proc. CSU-EPSA 26 (10), 7–13.
Yang, Y., Ba, Y, Wu, Y., Li, W., and Cheng, K. (2015). Lmplementation mode of tie-line power control performance assessment standard. Automation Electr. Power Syst. 39 (10), 100–109.
Yao, M., Shoults, R. R., and Kelm, R. (2000). AGC logic based on NERC’s new control performance standard and disturbance control standard. IEEE Trans. Power Syst. 15 (2), 852–857. doi:10.1109/59.867184
Yu, Ba, Liu, R., Li, W., et al. (2012). Comparison of CPS and lts assessment between North America and China. Automation Electr. Power Syst. 36 (15), 63–72.
Yu, T., Wang, Y., Ye, W., and Liu, Q. (2011). Multi-objective dynamic optimal dispatch method for CPS order of lnterconnected power grids using improved hierarchical reinforcement learning. Proc. CSEE 31 (19), 90–96. doi:10.13334/j.0258-8013.pcsee.2011.19.013
Zhang, R. (2016). The improved dynamic optimization models for AGC generators dispatch in a power system with renewable energies under CPS. Chongqing: Chongqing University.
Zhang, X., Yu, T., and Tang, J. (2016). Dynamic optimal allocation algorithm for control performance standard order of interconnected power grids using synergetic learning of multi-agent CEQ(入). Trans. China Electrotech. Soc. 31 (8), 125–133. doi:10.19595/j.cnki.1000-6753.tces.2016.08.016
Zhang, X., Yu, T., Tang, J., et al. (2015). Optimization algorithm of CPS instruction allocation based on hierarchical correlation equilibrium reinforcement learning. Automation Electr. Power Syst. 39 (8), 80–86.
Zhao, M. (2019). Load frequency control based on improved fruit fly algorithm with wind power interconnection network. Xi'an: Xi'an University of Technology.
Zhao, W., Li, B., Wei, H., Wei, C., and Deng, J. (2016a). The optimal AGC control strategy considering the primary frequency regulation under the control performance standard for the interconnected power grid. Proc. CSEE 36 (10), 2656–2657. doi:10.13334/j.0258-8013.pcsee.2016.10.009
Zhao, X., Ye, X., Yang, L., Yu, W., and Yan, W. (2019). Lmproved method for dynamic optimal dispatch of AGC units under CPS. Proc. CSU-EPSA 31 (10), 31–44. doi:10.19635/j.cnki.csu-epsa.000172
Keywords: regional spot market, control performance standards, frequency control performance, regional power grid, distribution models
Citation: Kuo X, Hongxuan Z, Wenzu W, Jingpeng C and Qixing L (2024) The design of an improved index system for frequency control in China Southern Power Grid. Front. Energy Res. 12:1360272. doi: 10.3389/fenrg.2024.1360272
Received: 22 December 2023; Accepted: 08 February 2024;
Published: 19 March 2024.
Edited by:
Bin Zhou, Hunan University, ChinaReviewed by:
Xin Cui, The University of Hong Kong, Hong Kong SAR, ChinaJiazuo Hou, National University of Singapore, Singapore
Wenqian Yin, Nanjing Tech University, China
Copyright © 2024 Kuo, Hongxuan, Wenzu, Jingpeng and Qixing. This is an open-access article distributed under the terms of the Creative Commons Attribution License (CC BY). The use, distribution or reproduction in other forums is permitted, provided the original author(s) and the copyright owner(s) are credited and that the original publication in this journal is cited, in accordance with accepted academic practice. No use, distribution or reproduction is permitted which does not comply with these terms.
*Correspondence: Liu Qixing, bGl1cXhAY3NnLmNu