- 1Institute of Electric Power Engineering, Shanghai University of Electric Power, Shanghai, China
- 2China Coal Technology and Engineering Group Shanghai Research Institute, Shanghai, China
- 3Hangzhou Power Supply Company of State Grid Zhejiang Electric Power Company, Hangzhou, China
As a new generation of transportation, electric vehicles play an important role in carbon-peak targets. The development of electric vehicles needs the support of a charging network, and improper planning of charging stations will result in a waste of resources. In order to expand the charging network of electric vehicles and give full play to the low-carbon and efficient characteristics of electric vehicles, this paper proposed a charging station planning method that considers the characteristics of carbon emission trends. This paper combined the long short-term memory (LSTM) network with the stochastic impacts by regression on population, affluence, and technology (STIRPAT) model to predict the carbon emission trend and quantified the correlation between the construction speed of a charging station and the evolution characteristics of carbon emission by Pearson’s correlation coefficient. A multi-stage charging station planning model was established, which captures the dynamic characteristics of the charging demand of the transportation network and determines the station deployment scheme with economic and low-carbon benefits on the spatiotemporal scale. The Pareto frontier was solved by using the elitist non-dominated sorting genetic algorithm. The model and solution algorithm were verified by the actual road network in a certain area of Shanghai. The results showed that the proposed scheme can meet the charging demand of regional electric vehicles in the future, improve the utilization rate of charging facilities, and reduce the carbon emission of transportation networks.
1 Introduction
Road traffic carbon emission is the key object of energy saving and carbon reduction. Electric vehicles (EVs) are being promoted because of their low carbon emission and high efficiency (Li et al., 2019). By the end of 2022, the number of new energy vehicles in China had reached 13.1 million. As the number of EVs continues to increase, EV charging stations also need to match it. Reasonable allocation of the location and capacity of charging stations is conducive to the development of EVs, reducing transportation carbon emissions and achieving the goal of carbon peak.
In the face of carbon peak target requirements, the policy promotes the development of EVs and charging facilities to reduce transportation carbon emissions. At the same time, the evolution of carbon emissions affects the promotion of EVs and the construction of charging facilities. Therefore, it is necessary to consider the evolution characteristics of carbon emissions in the planning process of charging stations. EV charging station planning not only involves EV users, charging station investors, and distribution networks but is also restricted by many influencing factors. EVs are characterized by both transportation loads and power loads, and the planning of their charging stations involves both the transportation and power aspects. The electricity-related factors include the interaction between the power system and charging facilities, the current status of the distribution network, charging configuration, and charging mode. The transportation-related factors include urban road network planning, traffic flow, and the scale of EV development (Kavianipour et al., 2021; Frade et al., 2011; Huang et al., 2018). Most of the charging station planning models in the existing literature consider the construction cost of a charging station, user time cost, and distribution network loss (Lin et al., 2019; Meng et al., 2020; Pal et al., 2021).
Xie et al. (2018) established a model with the goal of minimizing the construction and operation cost of charging stations and the time cost of users. Zhong and Xiong (2021) established a charging station planning model considering the impact of the charging station planning scheme on the safety and efficiency of the distribution network. Zhu et al. (2017) considered the EV users, distribution network, and charging station investors to establish a planning model to obtain the optimal planning scheme with the minimum comprehensive cost. The above studies consider different utilization subjects for planning, but they ignore the constraint requirements on carbon emissions.
Few studies consider carbon emission reduction, and most of them consider carbon emission in terms of economic benefits (Wu et al., 2022; De Lima et al., 2023; Wu et al., 2023). Saber and Venayagamoorthy (2011) established an approximate linear model to calculate the emission reduction benefits of EVs and pointed out that the coordinated scheduling of EV charge and discharge and clean energy can reduce carbon emissions. Amer et al. (2021) established a charging station planning model with the goal of minimizing the carbon emission generated by EVs during the journey to the charging station. In essence, the service distance of the charging station is still considered, but carbon emission is not directly considered. Although carbon emissions are considered in the planning process of charging stations in the above literature, the sources of carbon emissions are not comprehensive, and the relationship between carbon emissions and the construction of charging facilities is ignored.
Existing studies on carbon emissions in the planning process of charging stations only focus on carbon emissions at a single point in time without considering the evolution trend and characteristics of transportation carbon emissions over a long time scale. For finding the evolution trend of carbon emissions, the main method is the traditional stochastic impacts by regression on population, affluence, and technology (STIRPAT) model (Kong et al., 2023) and Kaya identity (Lin et al., 2023). Neural network models (Niu et al., 2022), support vector regression machine model (Jiang and Yu, 2023), and other new methods are also used.
The STIRPAT model is an improved IPAT model, which overcomes the defect that independent variables affect the dependent variables equally in the IPAT model, and it can also be customized to add other factor analyses according to research needs to determine the influencing factors more rigorously. The long short-term memory (LSTM) model can explore the nonlinear relationship between variables through deep neural networks to improve the accuracy of the evolution trend of transportation carbon emissions. The LSTM model can obtain the carbon emission trend change with high accuracy when the data sample is small, but it is limited to a short period of time, and the later results will be affected by the earlier prediction errors, resulting in error accumulation.
The purpose of this paper is to improve the rationality and low-carbon effect of the planning and layout of EV charging stations by considering the relationship between the evolution characteristics of carbon emissions and the construction scale of charging facilities and taking into account the economic cost of the construction of charging stations. In order to achieve this goal, we establish a new multi-objective programming model to resolve the conflict between carbon emissions and economic costs. The model takes into account a number of factors, including carbon emissions from transportation and distribution networks, dynamic demand changes for EVs, and the scale of charging stations. Finally, the improved genetic algorithm is used to solve the model to ensure the rationality and low carbon emission of the planning layout of charging stations in the process of dynamic changes in EV charging demand. The contributions of this paper are as follows:
(1) We propose a new EV charging station planning model that takes into account the correlation of carbon emissions from transportation networks and distribution networks to the scale of the construction of charging stations and their internal facilities. One of the key objective functions in the model is the carbon emission of the network, which directly affects the planning results. The model determines the location and capacity of charging stations by minimizing economic costs and carbon emissions and takes into account the dynamic changes in charging demand based on a multi-stage planning process.
(2) In order to improve the accuracy of the future carbon emission evolution trend, a combined model combining the advantages of different models was proposed to predict the traffic carbon emission under a small data sample. By improving the accuracy of the evolution trend of carbon emissions, the evolution characteristics were analyzed, and the correlation between carbon emissions and the construction of charging facilities was analyzed according to the constructed two-dimensional evaluation index.
(3) We take a regional road network in Shanghai as the case study, compare the layout results under different planning methods, and analyze and discuss them, and the comparison results show that the method proposed in this paper has good economic and low-carbon effects.
The rest of this paper is structured as follows: Section 2 introduces the prediction model of the carbon emission evolution trend and the evaluation index of the carbon emission evolution characteristics; Section 3 presents the multi-stage planning model; case studies are provided in Section 4; and Section 5 concludes this paper.
2 Evolution characteristics of road traffic carbon emissions
The carbon emission of urban road traffic is mainly measured by the carbon dioxide emitted by the burning fuel during the driving process of the vehicle. Considering that the LSTM model has more advantages in short-term trend inference, and there is error accumulation in long-term inference results, this chapter combines the short-term results of the LSTM model with the long-term trend of STIRPAT inference to obtain the future evolution trend of transportation carbon emissions and analyzes the evolution characteristics of carbon emissions.
2.1 Carbon emission measurement methods
Due to the poor availability of data such as vehicle mileage and combustion consumption per unit mileage, this paper adopts the “top–down” method to calculate the carbon emissions of the highway traffic network, which is as follows:
where C is the transportation carbon emission, i represents the ith energy source, Ci represents the carbon emissions from the consumption of energy i, Ei represents the consumption of the ith energy, and CVi is the average low heating value, expressed in kJ/kg or kJ/m3. CCF is the carbon content of energy, and the unit is kg/106 kJ. COF is the carbon oxidation rate of energy. The ratio of the molecular weight of CO2 to carbon is 44/12.
The carbon emissions generated by fuel consumption caused by coal electricity in the charging capacity of EVs are calculated as driving carbon emissions. The carbon emissions of EVs are calculated as follows:
where Cev is the annual carbon emissions per electric vehicle, unit kg; fc is the carbon emission factor of coal power, unit kg·(kW·h)−1; PCev is the 100-km power consumption of electric vehicles, unit kW·h·(100 km)−1; Q is the ratio of the coal power station, unit %; W is the average annual mileage of electric vehicles, unit km·year−1; a is the charging efficiency of EVs; and b is the power transmission and distribution loss.
2.2 Carbon emission evolution trend model
2.2.1 Factor identification and trend analysis based on STIRPAT
The carbon emission of urban road traffic is affected by many factors, and quantifying the influence of the factors on the carbon emission of road traffic is the focus of studying the evolution characteristics of carbon emission. The setting of a typical IPAT model only contains three influencing factors. The STIRPAT model adopted in this paper is an extended form of the IPAT model. After improvement, a variety of new variables can be introduced to analyze the related factors affecting carbon emissions more comprehensively.
where I, P, A, and T represent the environmental, population, economic, and technical factors, respectively; a, b, c, and d are the parameters to be estimated; and e is a random error term. The STIRPAT model is a concrete decomposition or improvement of the three variables P, A, and T.
2.2.2 Evolution trend model of carbon emission based on LSTM
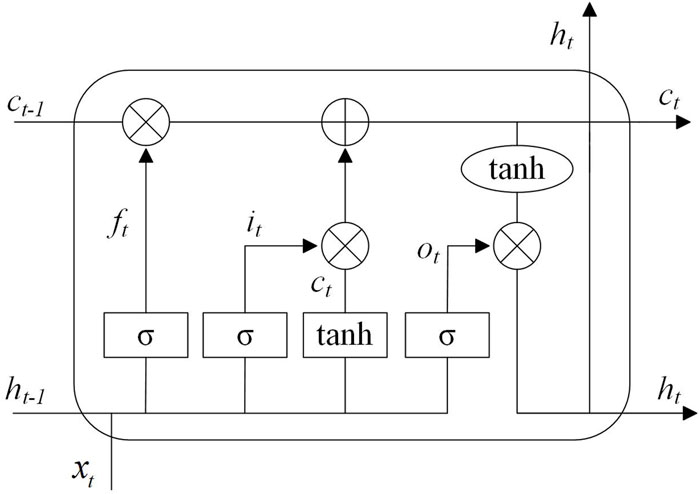
The LSTM model has excellent performance in predicting the future trend of time series, and the road traffic carbon emission and its influencing factors have obvious time series characteristics, so this method is adopted to show the evolution characteristics of road traffic carbon emission. The LSTM model uses the input gate, forget gate, and output gate control network to realize the function of long-term memory. The main structure is shown in Figure 1.
As shown in the figure, the output ht-1 at the previous moment and the current state xt at the same time serve as the input, and after obtaining the ratio of storage deletion to output, the critical-state information is selected to update the storage unit based on the forgetting ratio and memory ratio. The output ht at the current time is obtained based on the output proportion, and the model can be obtained by reducing the error through several iterations.
2.3 Carbon emission evolution characteristic evaluation index
Carbon emission evolution has temporal characteristics; carbon emission time series Ct is generated, and the carbon emission change rate FCt considering temporal timing is defined. Cosine distance Dc is used to describe the fluctuation degree of 2 adjacent years in the carbon emission time series, as shown in Eq. 4:
Since stage planning is conducted in advance based on the change trend of the time period, the weighted average of the whole stage is obtained, and the closer the planning year is, the greater the weight is.
where ψt represents the weight factor for year t.
The change in the average growth rate of carbon emissions in the stage can be expressed as follows:
On the basis of the above formula, the carbon emission growth index composed of the carbon emission mutation rate and growth rate at the stage is defined, as shown in the following formula:
2.4 Correlation between charging facilities and carbon emission trends
The evolution of carbon emissions affects the promotion policy of EVs, thus stimulating the change in the demand for charging facilities and placing requirements on the quantity and speed of the construction of charging facilities. Based on Spearman’s correlation coefficient, the correlation between the evolution characteristics of carbon emissions and charging facilities is analyzed.
The construction speed of the charging facilities is as follows:
The correlation coefficient is as follows:
where N is the number of charging piles, oi is the difference between the position values of the ith data pair, and n is the number of points in the sequence.
3 Multi-stage planning model of an electric vehicle charging station
3.1 Optimization objective
This paper assumes that the interests of multiple parties are equally important, and the model considers the minimum total cost and carbon emissions in the planning stage as the objective function, as shown in the following equation:
where Fsi is the total cost in the planning stage, t represents the stage of planning, si represents the planning scenario, F1,si,t is the annualized cost of investors, F2,si,t is the loss cost of connecting to the grid, C1,si,t is the carbon emissions of fuel-powered vehicles in the planning area, and C2,si,t is the carbon emissions of EVs going to charging stations in the planning area.
3.1.1 Annualized cost of investors
The annualized cost of investors mainly includes the construction, operation, and maintenance cost of EV charging stations and the cost of different charging piles in charging stations. The calculation formula is as follows:
where T is the planning stage of a charging station, N is the number of charging stations for EVs, r0 is the average depreciation rate of EV charging stations, ys is the maximum service life of the EV charging station, and yti,si are 0–1 variables used to determine whether a charging station is built at a site. If a station is built, yti,si = 1; otherwise, yti,si = 0. fi,si,t is the annual construction cost of the ith EV charging station; fpi,si,t is the purchase cost of the charging pile of the ith charging station; and fOMi,si,t is the annual operation and maintenance cost of the ith EV charging station. The analysis and explanation of fpi,si,t and fOMi,si,t are as follows.
The different types of charging piles in EV charging stations make their purchase costs different.
where fhp and flp are the unit prices of fast- and slow-charging piles, respectively; Nhpi,si,t and Nlpi,si,t refer to the number of fast-charging and slow-charging piles, respectively, in the ith EV charging station.
The operation and maintenance cost of EV charging stations is related to the daily operating capacity of the charging stations, which is as follows:
where Ccap,pi,si,t is the 1-year operating capacity of the ith charging station, p is the proportional coefficient of labor cost, q is the ratio coefficient of the grid-connected cost, Td is the average running time of the charging pile in 1 day, Php is the fast-charging pile power, Nhpi,si,t is the number of fast-charging piles in the ith charging station, Plp is the power of the slow-charging pile, Nlpi,si,t is the number of slow-charging piles in the ith charging station, and 365 indicates the number of days in a year.
3.1.2 Network loss
where ce is the price of electricity; d indicates the number of days, i.e., 365 days, in a year; τ is the number of hours, and there are 24 h in a day; L is the number of branches; Ik(τ) is the magnitude of the k branch current at τ; and Rk is the resistance corresponding to branch k.
3.1.3 Carbon emissions from fuel vehicles
where xsi,t is the number of vehicles in the area planned by t in the scenario i stage, Ssi,t is the proportion of EVs in the planning area t in stage i of the scenario, Lg,av is the average annual mileage of fuel-powered vehicles, and eg,co2 is the carbon emission coefficient per unit driving distance of the fuel-powered vehicle.
3.1.4 Carbon emissions from electric vehicles
where Le,av is the average annual mileage of EVs, Eav is the power consumption per unit mileage of EVs, and Icoal,si,t is the proportion of coal power in the charge amount of t in stage i of the scenario. ecoal,co2 is the carbon emission factor of coal. Lrun is the annual mileage of EVs, and Lch is the mileage of EVs to charging stations. ηch is the charging efficiency of the charging station, J is the charging demand set, λij is the nonlinear coefficient of an urban road, and lij is the linear distance between demand point j and charging station i.
3.2 Constraint condition
3.2.1 Charging demand constraint
The capacity of the charging station cannot be less than the total demand of EV users in the planned area, which is as follows:
where ξsi,t is the proportion of vehicles in the average charging demand, Dsi,t refers to the daily total charging demand in the planning area, Ccap is the capacity of EVs, and SOCref is the threshold value of the state of charge of the EV. SOCc is the average remaining capacity of EVs, and Esi,t refers to the total number of EVs in the planning area, where Esi,t = xsi,ty3,si,t.
3.2.2 Charging station distance constraints
Considering the timeliness of EV charging and the planned areas being within the service range of charging stations, the distance between adjacent charging stations is required to be as follows:
where Rcs is the service area of the charging station; L (Di+1, Di) is the distance between adjacent charging stations.
3.2.3 Limiting the number of charging stations
where ceil (.) is an integer upward function, dmax,si,t is the capacity upper limit of the charging station, dmin,si,t is the lower limit of the capacity of the charging station, and Nmin,si,t and Nmax,si,t are the upper and lower limits of the number of charging stations, respectively.
3.2.4 Charging pile construction speed constraints
The higher the growth rate of phase carbon emissions, the faster the construction speed of the charging facility, and the two are positively correlated.
3.2.5 Carbon emission constraint
where Cmax and Cmin are the maximum and minimum values of carbon emission, respectively.
3.2.6 Planning temporal constraint
In the multi-stage planning process, the built charging stations always exist, and the number of charging piles inside them is not lower than the planned number in the previous stage. Therefore, the planning timing constraints are expressed as follows:
where yti,si are the 0–1 variables for t to judge whether a station should be built at node i. If a station is built, yti,si = 1; otherwise, yti,si = 0. dti,si is the number of charging piles built in t node i; dmin and dmax are the minimum and maximum construction capacities of charging stations, respectively.
3.3 Solution method
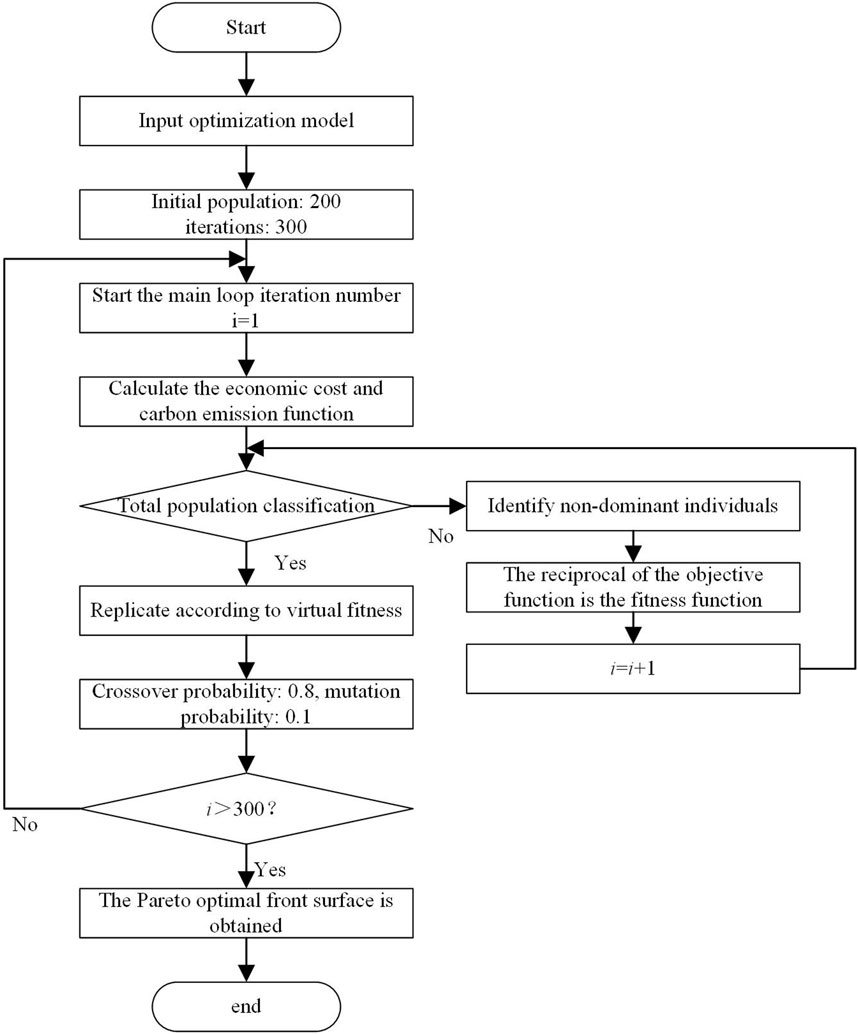
The objective of this model is to minimize the economic cost and carbon emission, which are different in dimensions. In this paper, a genetic algorithm based on a non-dominant sorting elite strategy is used to solve the Pareto optimal frontier. The steps are shown in Figure 2. First, the Pareto solution set of the model is calculated, and the relationship of all the solutions is clarified. Then, the non-dominant solution is determined, and the relationship of the residual solution is determined. The above steps are repeated to obtain the optimal non-dominant solution.
After finding the Pareto optimal frontier surface, the solution of the optimal frontier surface is normalized as follows:
where μFsiz and μCsiz are the normalized values of the z solution of the two objective functions on the optimal front surface, respectively, and Fsiz and Csiz represent the actual values. Considering the economic cost priority, weights are introduced to the two objective functions, and the membership degrees of each solution on the optimal front surface are calculated as follows:
where Z is the number of solutions on the Pareto optimal front surface; ω1 and ω2 are the weight factors of the economic cost and carbon emission, respectively, where ω1 > ω2. The Pareto solution is optimal when μsi,z is maximum.
4 Results and discussion
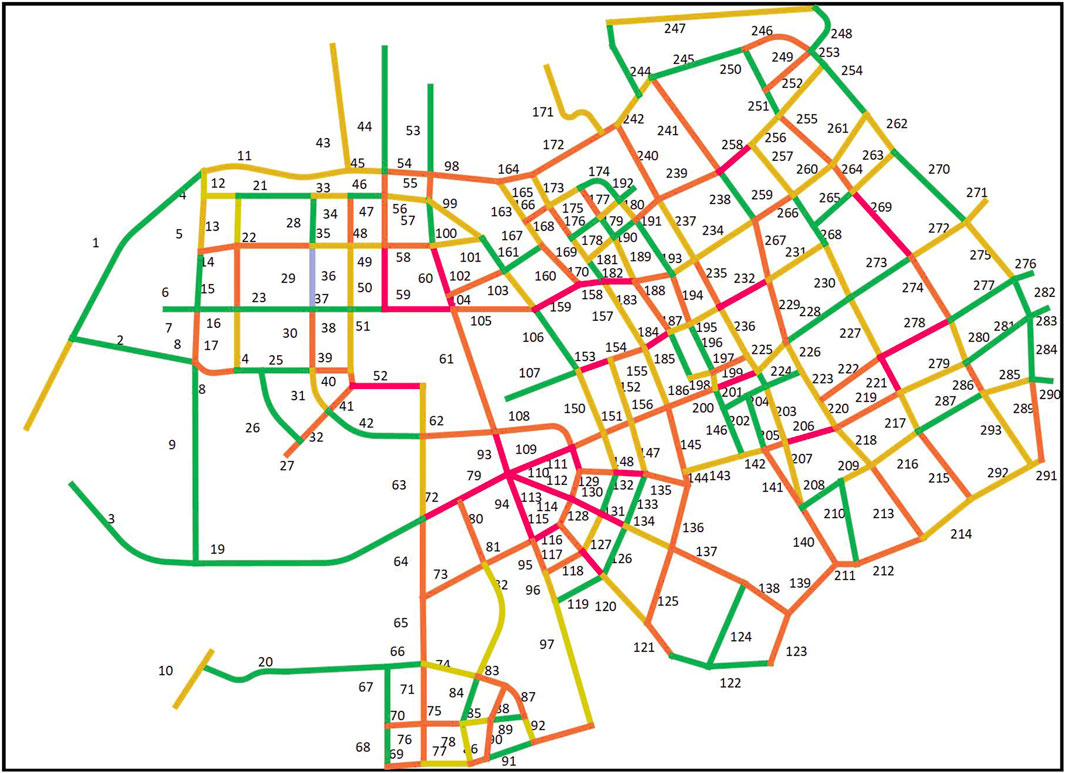
The calculation takes Yangpu District of Shanghai as an example to optimize the planning of the address and capacity allocation of the charging station. The planning area selected by the simulation case is shown in Figure 4, which covers a total area of 60.61 km2 and contains 293 main traffic sections. It is assumed that the planning cycle of the charging station is divided into three stages, and the duration of each stage is 5 years.
4.1 Data sources and scenarios
The relevant data used in this paper are obtained from the China Energy Statistical Yearbook and Shanghai Statistical Yearbook, and the reference coefficient and average low calorific value in the Chinese national standard GB/T2589-2008 are adopted. The relevant data on energy carbon emissions are from the China Provincial Greenhouse Gas Inventory Compilation Guide. The parameter settings of the charging station location and capacity model in this paper are shown in Table 1.
In view of the analysis of the influencing factors of urban road traffic carbon emissions, this paper analyzes road traffic GDP, vehicle ownership, EV proportion, coal electricity proportion of charging amount, road freight turnover, and passenger traffic turnover as the influencing factors. Based on the historical changes of each factor and national policies, the specific scenario is given in Table 2. The baseline scenario changes the least, followed by policy constraints, and the low-carbon scenario changes the most because the three scenarios have different requirements for the time of carbon emission peaking.
4.2 Result analysis
4.2.1 Evolution trend of transportation carbon emissions
The STIRPAT and LSTM models were, respectively, trained and tested using historical carbon emission data. After the logarithm is taken from Formula 3, and multivariate linear fitting is performed according to the collected data to obtain the regression equation, the STIRPAT prediction model can be determined as follows:
where X1, X2, X3, X4, X5, and X6 represent the road traffic GDP, vehicle ownership, EV proportion, coal electricity proportion of charging amount, road freight turnover, and passenger traffic turnover considered in this paper, respectively.
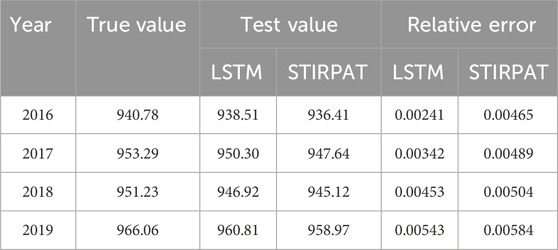
Based on the results of the repeated experiments, the LSTM parameters were determined by setting the number of hidden layers to 3 and the number of neurons contained in each layer to 100, 80, and 50. The model conducted training sets and test sets for 90% and 10% of the historical data, respectively. The errors between the obtained results and the actual values are shown in Table 3.
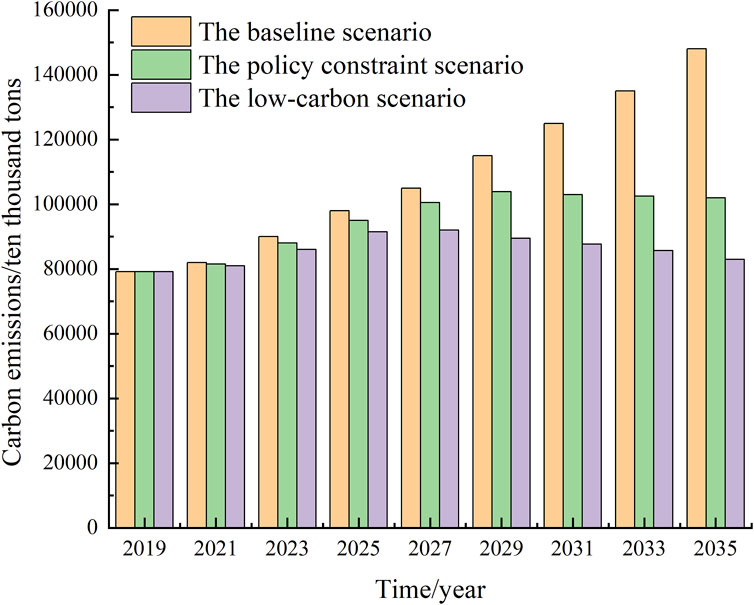
As shown in Table 3, LSTM has a higher precision in the short-term carbon emission evolution trend, but with time, it is affected by the accumulation of errors, resulting in a larger error in the subsequent trend. Therefore, this paper combines the two methods to analyze the trend of carbon emissions, and in the process of trend analysis, the result with higher precision is taken as the final output. The evolution trend of carbon emission is shown in Figure 3.
As shown in Figure 3, there are obvious differences in the evolution trend and fluctuation range of carbon emissions in different scenarios: carbon emissions in the baseline scenario continue to increase during the planned year. Under the policy constraint scenario, carbon emissions will peak from 2032 to 2033 and then start to decrease. Carbon emissions in the low-carbon scenario will peak in 2030 and start to decrease each year. Although the low-carbon scenario can achieve the goal of peaking traffic carbon as soon as possible, the structure of the urban traffic power system and people’s travel mode are too high, and the speed of change is too fast, which does not meet the actual development level of production and life. Therefore, this paper mainly carries out multi-stage planning for charging stations according to the evolution trend of carbon emissions under the policy constraint scenario.
4.2.2 Electric vehicle charging demand distribution
This paper takes the policy constraint scenario as an example, considering the evolution characteristics of carbon emissions for the planning of EV charging stations in the target region. The scale of EVs in different stages is analyzed from the evolution trend of carbon emissions, as shown in Table 4.
Given the number of vehicles and the proportion of EVs in the region, road flow and charging demand distribution are obtained after the vehicles running in the region are distributed on each road based on the traffic equilibrium model (Zhou et al., 2021). Figure 4 shows the distribution of road charging demand in stage 1. The darker the color, the greater the charging demand.
4.2.3 Charging station planning results
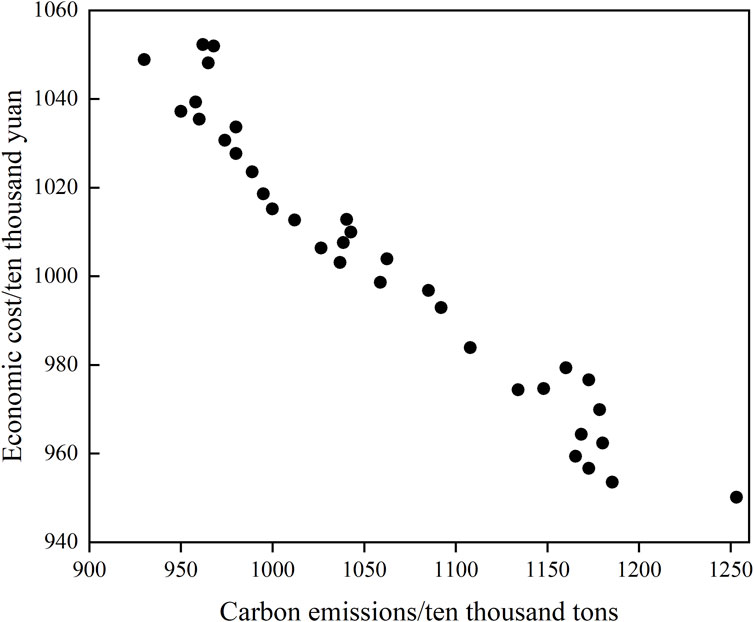
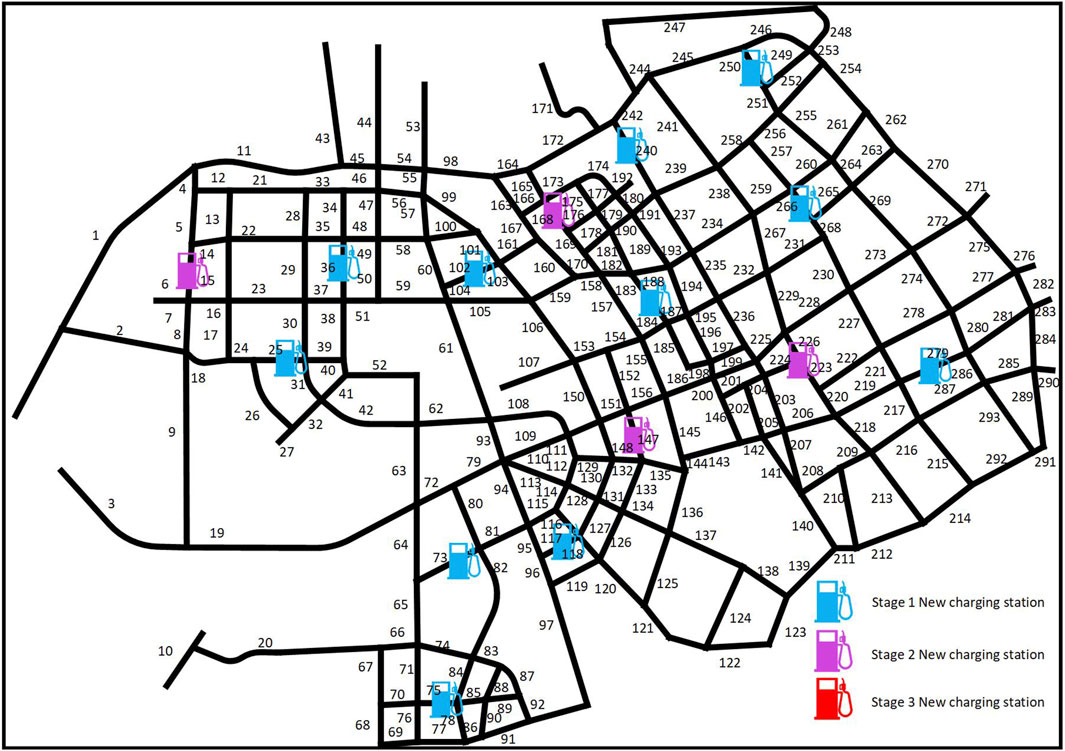
The optimal front surface obtained by the Pareto multi-objective optimization method is shown in Figure 5, and the obtained Pareto solution cannot make the two planning objectives reach the optimum at the same time. In the planning process, the weight factors of the economic cost and carbon emission are set to be 0.6 and 0.4, respectively, based on the cost priority, and the scheme with the maximum value of μz is taken as the optimal scheme. The resulting scheme planning results are shown in Figure 6.
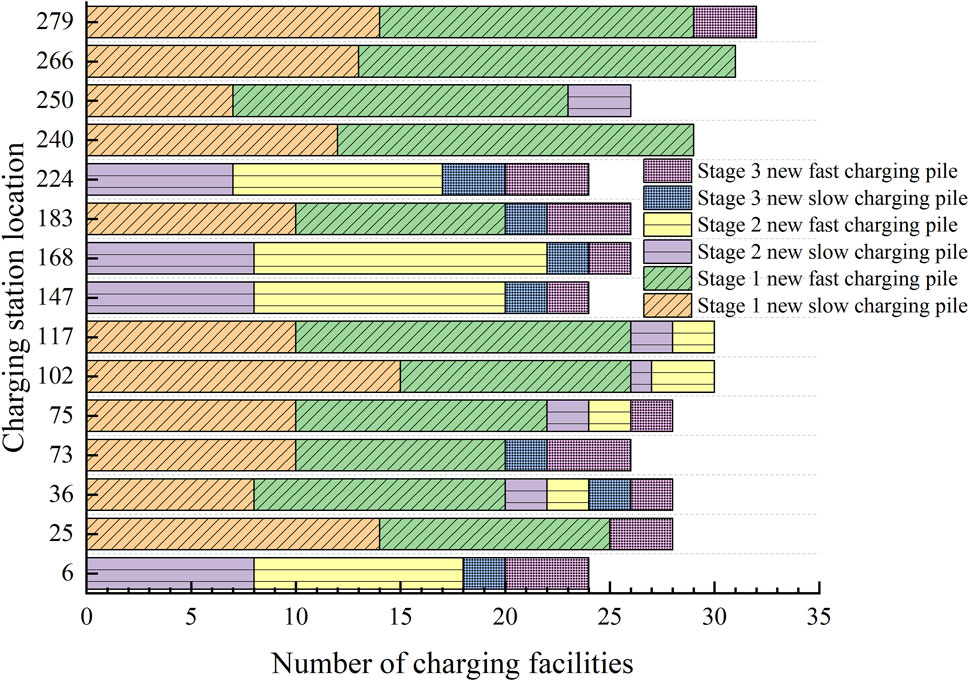
Figure 6 shows the changes in the time sequence of the construction of charging stations. As shown in Figure 6, only stages 1 and 2 have new charging stations, and stage 3 does not need new charging stations. This is because stage 3 only needs to expand each charging station on the basis of existing charging stations to meet the requirements. Figure 7 shows the changes in the capacity of each charging station.
As shown in Figure 7, no charging stations were established in some sections of the road during planning stage 1, and the difference in the number of fast-charging and slow-charging facilities in the charging stations established during this stage was not large, but fast-charging was the main focus, which was because the scale of EVs and the charging demand were small. In the process of planning stage 2, new charging stations were established in sections 6, 147, 168, and 224, and fast-charging facilities were used as the main equipment. At the same time, the charging stations on roadway sections 250, 117, 102, 75, and 36 were expanded. The remaining charging stations remain unchanged, indicating that the capacity of these charging stations is still sufficient for the charging demand at this stage. No new charging stations were built in planning stage 3, and only the capacity was expanded on the basis of the existing charging stations, indicating that the current planning layout is in line with the distribution of the traffic flow and the charging demand of EVs, which verifies the validity of the planning results of this paper. Figure 7 shows that the charging stations are first expanded in the dynamic planning process, and then, new charging stations are built if they cannot meet the charging demand after expansion. This is because the cost of expanding the charging stations is lower than that of building new charging stations, and the expansion of the charging stations can meet the charging demand of EVs in the region, which can realize the effective reduction of cost and carbon emission. If we do not consider the carbon emission and construction schedule and only pursue the lowest cost, the comparison of the planning results is shown in Table 5.
As shown in the figures above, when considering the evolution of traffic carbon emissions, charging stations are selected to be built near roads with a large charging demand, which satisfies the road network traffic balance, effectively reduces the mileage anxiety of users, and, at the same time, alleviates traffic congestion and reduces traffic carbon emissions. If carbon emission and construction timing are not considered and only the lowest cost is pursued, the resulting planning results are shown in Table 5.
Scheme 1 is the planning method of this paper, scheme 2 only takes cost as the target, scheme 3 is independently planned in stages, and scheme 4 is the traditional planning option. As shown in Table 5, compared with scheme 2, the economic cost of scheme 1 increases by 9.6%, the operation and maintenance cost is similar, the network loss cost is reduced by 21.5%, and the carbon emission is reduced by 3.609 million tons. This is because the capacity of charging stations in schemes 1 and 2 is similar, but scheme 1 has more charging stations and a wider range of charging services, which equalizes the charging load and eases the traffic flow. A comparison of schemes 1 and 3 shows that the sum of the number of charging stations planned in multiple phases is less than the sum of the charging stations planned individually in each phase, reducing the economic cost by 41.4%. A comparison with scheme 4 shows that scheme 1 can effectively reduce carbon emissions while saving costs. The reason for the global cost reduction is that the optimal scheme proposed in this paper prioritizes the expansion of charging stations before considering new charging stations, which improves the utilization rate of charging stations and avoids overinvestment to increase the economic cost.
5 Conclusion
In order to solve the problem of the limited consideration of carbon emission in the existing charging station planning, a low-carbon planning method for charging stations considering the evolution characteristics of transportation carbon emission and dynamic demand is proposed to realize low-carbon planning for charging stations in the context of coupling the transportation network and electric power network. This paper comprehensively considers urban transportation carbon emission, traffic flow, user mileage anxiety, and other factors and constructs a multi-stage site selection and capacity allocation model for charging stations. Through comparative analysis of numerical examples, the effectiveness of this method is proved, and the conclusions are as follows:
(1) The carbon emission evolution trend analysis model proposed here can more accurately analyze the evolution trend of road traffic carbon emissions over a long period of time. The model combines the characteristics and advantages of the long short-term memory network and the STIRPAT model for carbon emission trend analysis under small samples, and the improved LSTM–STIRPAT model has better prediction accuracy than the traditional model.
(2) The proposed planning model can balance economic benefits and carbon emissions, and through rational planning of charging stations, network losses can be effectively reduced and load pressure relieved. The layout of charging stations simultaneously guides user path choices in the transportation network, thus improving traffic flow and reducing carbon emissions from urban transportation.
(3) In the planning process of charging stations at each stage, this paper first considers the expansion of existing charging stations and then considers whether new charging stations are needed to meet the regional charging demand. This can improve the utilization rate of charging stations and alleviate the range anxiety and queuing time of EV users. The proposed program is superior to traditional planning methods
Data availability statement
The raw data supporting the conclusion of this article will be made available by the authors, without undue reservation.
Author contributions
RJ: writing–original draft and writing–review and editing. XX: writing–review and editing. YX: writing–review and editing. ZS: writing–review and editing. YG: writing–review and editing. SQ: writing–review and editing.
Funding
The author(s) declare that no financial support was received for the research, authorship, and/or publication of this article.
Conflict of interest
Authors YX and ZS were employed by Hangzhou Power Supply Company of State Grid Zhejiang Electric Power Company.
The remaining authors declare that the research was conducted in the absence of any commercial or financial relationships that could be construed as a potential conflict of interest.
Publisher’s note
All claims expressed in this article are solely those of the authors and do not necessarily represent those of their affiliated organizations, or those of the publisher, the editors, and the reviewers. Any product that may be evaluated in this article, or claim that may be made by its manufacturer, is not guaranteed or endorsed by the publisher.
References
Amer, A., Azab, A., Azzouz, M., and Awad, A. (2021). A stochastic program for siting and sizing fast charging stations and small wind turbines in urban areas. IEEE Trans. Sustain. Energy 12 (2), 1217–1228. doi:10.1109/tste.2020.3039910
De Lima, T., Soares, J., Lezama, F., Franco, J., and Vale, Z. (2023). A risk-based planning approach for sustainable distribution systems considering EV charging stations and carbon taxes. IEEE Trans. Sustain. Energy 14 (4), 2294–2307. doi:10.1109/TSTE.2023.3261599
Frade, I., Ribeiro, A., Gonçalves, G., and Antunes, A. (2011). Optimal location of charging stations for electric vehicles in a neighborhood in Lisbon, Portugal. Transp. Res. Rec. 2011 (2252), 91–98. doi:10.3141/2252-12
Huang, X., Chen, J., Yang, H., Cao, Y., Guan, W., and Huang, B. (2018). Economic planning approach for electric vehicle charging stations integrating traffic and power grid constraints. IET generation, Transm. distribution 12 (17), 3925–3934. doi:10.1049/iet-gtd.2018.5456
Jiang, W., and Yu, Q. (2023). Carbon emissions and economic growth in China: based on mixed frequency VAR analysis. Renew. Sustain. Energy Rev. 183, 113500–120321. doi:10.1016/j.rser.2023.113500
Kavianipour, M., Fakhrmoosavi, F., and Singh, H. (2021). Electric vehicle fast charging infrastructure planning in urban networks considering daily travel and charging behavior. Transp. Res. Part D Transp. Environ. 2021, 93. doi:10.1016/j.trd.2021.102769
Kong, D., Dai, Z., Tang, J., and Zhang, H. (2023). Forecasting urban carbon emissions using an Adaboost-STIRPAT model. Front. Environ. Sci. 11. doi:10.3389/fenvs.2023.1284028
Li, Z., Khajepour, A., and Song, J. (2019). A comprehensive review of the key technologies for pure electric vehicles. Energy 182, 824–839. doi:10.1016/j.energy.2019.06.077
Lin, Y., Ma, L., Li, Z., and Ni, W. (2023). The carbon reduction potential by improving technical efficiency from energy sources to final services in China: an extended Kaya identity analysis. Energy 263, 125963–135442. doi:10.1016/j.energy.2022.125963
Lin, Y., Zhang, K., Shen, Z., Ye, B., and Miao, L. (2019). Multistage large-scale charging station planning for electric buses considering transportation network and power grid. Transp. Res. Part C Emerg. Technol. 107, 423–443. doi:10.1016/j.trc.2019.08.009
Meng, X., Zhang, W., Bao, Y., Yan, Y., Yuan, R., Chen, Z., et al. (2020). Sequential construction planning of electric taxi charging stations considering the development of charging demand. J. Clean. Prod. 259, 120794. doi:10.1016/j.jclepro.2020.120794
Niu, H., Zhang, Z., Xiao, Y., Luo, M., and Chen, Y. (2022). A study of carbon emission efficiency in Chinese provinces based on a three-stage SBM-undesirable model and an LSTM model. Int. J. Environ. Res. Public Health 19 (9), 5395. doi:10.3390/ijerph19095395
Pal, A., Bhattacharya, A., and Chakraborty, A. (2021). Allocation of electric vehicle charging station considering uncertainties. Sustain. Energy, Grids Netw. 2021, 25.
Saber, A., and Venayagamoorthy, G. (2011). Plug-in vehicles and renewable energy sources for cost and emission reductions. IEEE Trans. Industrial Electron. 58 (4), 1229–1238. doi:10.1109/TIE.2010.2047828
Wu, T., Li, Z., Wang, G., Zhang, X., and Qiu, J. (2023). Low-carbon charging facilities planning for electric vehicles based on a novel travel route choice model. IEEE Trans. Intelligent Transp. Syst. 24 (6), 5908–5922. doi:10.1109/TITS.2023.3248087
Wu, T., Wei, X., Zhang, X., Wang, G., Qiu, J., and Xia, S. (2022). Carbon-oriented expansion planning of integrated electricity-natural Gas systems with EV fast-charging stations. IEEE Trans. Transp. Electrification 8 (2), 2797–2809. doi:10.1109/TTE.2022.3151811
Xie, F., Liu, C., Li, S., Li, S., Lin, Z., and Huang, Y. (2018). Long-term strategic planning of inter-city fast charging infrastructure for battery electric vehicles. Transp. Res. Part E Logist. Transp. Rev. 109, 261–276. doi:10.1016/j.tre.2017.11.014
Zhong, J., and Xiong, X. (2021). An orderly EV charging scheduling method based on deep learning in cloud-edge collaborative environment. Adv. Civ. Eng. 12, 1–12. doi:10.1155/2021/6690610
Zhou, Z., Zhang, X., Guo, Q., and Sun, H. (2021). Analyzing power and dynamic traffic flows in coupled power and transportation networks. Renew. Sustain. Energy Rev. 135, 110083. doi:10.1016/j.rser.2020.110083
Keywords: electric vehicles, transportation carbon emissions, evolution characteristics, genetic algorithm, charging station planning
Citation: Jia R, Xia X, Xuan Y, Sun Z, Gao Y and Qin S (2024) Low-carbon planning of urban charging stations considering carbon emission evolution characteristics and dynamic demand. Front. Energy Res. 12:1359824. doi: 10.3389/fenrg.2024.1359824
Received: 22 December 2023; Accepted: 04 April 2024;
Published: 24 April 2024.
Edited by:
Nan Yang, China Three Gorges University, ChinaReviewed by:
Deyou Yang, Harbin University of Science and Technology, ChinaChunyu Chen, China University of Mining and Technology, China
Copyright © 2024 Jia, Xia, Xuan, Sun, Gao and Qin. This is an open-access article distributed under the terms of the Creative Commons Attribution License (CC BY). The use, distribution or reproduction in other forums is permitted, provided the original author(s) and the copyright owner(s) are credited and that the original publication in this journal is cited, in accordance with accepted academic practice. No use, distribution or reproduction is permitted which does not comply with these terms.
*Correspondence: Rui Jia, amlhcnVpX2NoaXJlbkAxNjMuY29t
 Rui Jia
 Xiangwu Xia1,2
 Yi Xuan