 Bolin Zhang1
 Longyu Zu
94% of researchers rate our articles as excellent or good
Learn more about the work of our research integrity team to safeguard the quality of each article we publish.
Find out more
ORIGINAL RESEARCH article
Front. Energy Res., 31 January 2024
Sec. Smart Grids
Volume 12 - 2024 | https://doi.org/10.3389/fenrg.2024.1359123
This article is part of the Research TopicAdvanced Operation and Control of Distributed and Grid-Scale Energy Storage in Modern Low-Voltage Power SystemsView all 10 articles
In this paper, a two-layer optimization approach is proposed to facilitate the multi-energy complementarity and coupling and optimize the system configuration in an electric-hydrogen-integrated energy system (EH-IES). Firstly, an EH-IES with virtual energy storage is proposed to reduce the cost of physical energy storage equipment. Secondly, a two-layer optimal allocation method is proposed under a multi-timescale strategy to examine the comprehensive evaluation index of environmental protection and economy. The upper layer utilizes the NSGA-II multi-objective optimization method for system capacity allocation, while the lower layer performs economic dispatch at the lowest cost. Ultimately, the output includes the results of the equipment capacity allocation of the EH-IES that satisfies the reliability constraint interval and the daily scheduling results of the equipment. The results demonstrate that the electric-hydrogen-integrated energy system with the coupling of multiple energy equipment not only enhances the utilization of renewable energy sources but also reduces the usage of fossil energy and improves the system’s reliability.
The core of achieving the “dual carbon” goal is to reduce carbon dioxide emissions. The integrated energy system (IES) uses clean energy and improves energy efficiency while reducing carbon emissions through multi-energy coupling, which plays a vital role in realizing the “dual carbon” goal and constructing a new energy system in China (Shen et al., 2022).
Due to the widespread use of wind and solar resources, domestic and international scholars have proposed a comprehensive energy system based on power-to-gas (P2G) technology to improve the consumption rate of new energy due to its uncertainty and high volatility (Ma et al., 2021). P2G technology achieves peak shaving for large-scale power grids using electricity to produce hydrogen or natural gas to absorb renewable energy (Yang et al., 2017). In recent years, with the gradual reduction in the cost of electrolytic water hydrogen production technology, hydrogen equipment has rapidly developed and has broad application prospects (Dong et al., 2022). Compared to the technology of converting electricity to natural gas, the chemical reaction of converting electricity to hydrogen is easier to achieve (Li et al., 2022). Therefore, introducing hydrogen energy into the operation of IES—the technology of converting electricity to hydrogen—is beneficial for strengthening the multi-energy flow coupling of IES and consuming renewable energy (Chen et al., 2023). Research on hydrogen energy in energy systems mainly focuses on hydrogen production from electricity, hydrogen fuel cells, and hydrogen storage. Zhang et al. (2023) constructed an integrated hydrogen energy system that utilizes electrolytic cells to produce and store hydrogen during wind power generation. During peak load periods, hydrogen energy is converted into electrical energy supply through fuel cells to improve system energy utilization. Dong et al. (2023) proposed using wind power hydrogen production equipment in IES, which achieves hydrogen production by controlling the operation mode of the equipment.
The function of demand-side response (DR) is to guide users to change their original energy usage habits through electricity price signals or incentive mechanisms, which significantly promotes the operation of the integrated energy system in a more secure, reliable, economical, and efficient mode, improves the optimal allocation of resources, and is also a vital measure to fully integrate renewable energy, such as wind power, into the grid (Xang et al., 2020). Yang et al. (2020) established an integrated demand response (IDR) system based on detailed price-based and alternative response descriptions. Li et al. (2021a) started from the perspective of demand response, and based on the analysis of the interactive response characteristics of multi-energy loads, they introduced horizontal complementary substitution and vertical time-shift strategies of electricity–gas–heat–cold, as well as the collaborative complementation and flexible conversion of multi-energy sources. A stochastic, robust optimal operation model of a regional integrated energy system is established based on comprehensive demand response.
When planning and calculating the economic cost of an integrated energy system, it is essential to consider the system’s capacity, configuration, and operation (Li et al., 2021c). Failure to consider the system’s operation can result in an inaccurate calculation of the system’s financial results, leading to overinvestment in the design and wastage or underinvestment of previously independent resources, ultimately leading to resource shortages (Qiao et al., 2023). Therefore, the proper operation of IES is crucial for its configuration (Li et al., 2020). The first step in constructing IES is integrating and harmonizing the design of equipment capacities within the power grid, gas network, and heating network coupling system. Researchers in home and abroad have explored ways to optimize the configuration and operation of IES collaboratively (Xiong et al., 2022). Shen et al. (2022) aimed to minimize the total cost of the integrated energy system and annual carbon emissions. They considered the complementary coupling characteristics and distribution ratio of the integrated energy system’s capacity optimization allocation based on the principle that heat determines electricity and vice versa. This approach considers the interplay between different energy systems and their respective capacities to achieve a more efficient and sustainable operation of the integrated energy system (Yang et al., 2023).
In terms of optimizing planning objectives, domestic and foreign research mainly considers factors such as long-term system operation economy, reliability, and environmental protection to achieve optimization of system equipment capacity or model (Shen et al., 2022). Research on IES scheduling at multiple timescales is mainly aimed at improving the stability and economy of IES and ensuring the safe and reliable operation of the system through the prediction accuracy of high renewable energy generation, thereby improving the system’s ability to absorb renewable energy (Zhu and Gao, 2023). Mu et al. (2020) and Li et al. (2021b) adopted the bi-level programming method of distribution networks, wherein they constructed a capacity allocation model for IES in the upper layer and an operating model for IES in the lower layer. Economic optimization is taken as the objective function, and the configured equipment capacity is obtained by optimizing the upper and lower layers (Saberi et al., 2023).
Therefore, based on the existing work and the electric–hydrogen-integrated energy system (EH-IES) basic architecture model, this paper establishes a two-layer capacity allocation optimization model that combines EH-IES planning and operation based on NSGA-II algorithm-linear programming. The objective function of the upper-level configuration model is to minimize the total system cost and carbon dioxide emissions, and the accurate part of the lower-level operation model is to reduce the total cost. At the end of the iteration, the capacity configuration and total cost of the IES equipment are obtained. The configuration capacity results of the system in different scenarios are compared and analyzed, and then the economic scheduling of the lower layer runtime is studied. Finally, the effectiveness of the model proposed in the article is verified through a calculation example, which provides a basis and reference for the construction and operation of IES. The detailed contributions of this paper are as follows:
1) Incorporating demand-side response as a virtual energy storage system into EH-IES reduces the cost of physical energy storage equipment.
2) Considering both system economy and environment, a two-layer model is adopted for optimal scheduling.
3) To ensure the accuracy of upper-layer capacity configuration results, multi-objective NSGA-II is used for solving.
The remainder of this paper is organized as follows: Section 2 proposes the EH-IES framework, and a mathematical model for EH-IES is established. Section 3 presents the concept of virtual energy storage, shows the mathematical models for user-side demand response virtual energy storage, and establishes a two-level planning model. In Section 4, two cases are used to demonstrate the effectiveness of the proposed method. Finally, the conclusion of this paper is presented in Section 5.
IES integrates multiple energy sources within the region through coordinated planning and optimized operation to meet the diverse energy demands within the system. The IES operating framework considering efficient utilization of hydrogen energy is shown in Figure 1. As shown in Figure 1, the leading manufacturing equipment for hydrogen is an electrolytic tank, which generates hydrogen and oxygen through the electrolysis of water, belonging to the first stage of the P2G process. The energy equipment directly utilizing hydrogen includes hydrogen fuel cells, gas turbines, and methane reactors. The methane reactor uses hydrogen and carbon dioxide to generate natural gas, which belongs to the second stage of the P2G process. Hydrogen and natural gas are mixed and transported into the gas turbine proportionally, and all the generated electrical energy is supplied to the electrical load. At the same time, a portion of the generated heat energy flows to the thermal load through the waste heat boiler. A small amount is generated through the waste heat recovery device for waste heat generation and then transmitted to the electrical load. Equipping gas turbines with waste heat power generation equipment, to a certain extent, decouples the constraint of “determining electricity based on heat,” making their energy supply more flexible. The system is also equipped with a hydrogen fuel cell, which can directly utilize hydrogen to generate electrical and thermal energy, achieving the coupling of hydrogen energy with electrical and thermal energy. The system has added energy storage equipment to each energy flow link, enabling the transfer of electricity, heat, gas, and hydrogen energy sources in a specific time sequence, solving problems such as large fluctuations in new energy output and difficulty in prediction, and ensuring the safe and stable operation of the system.
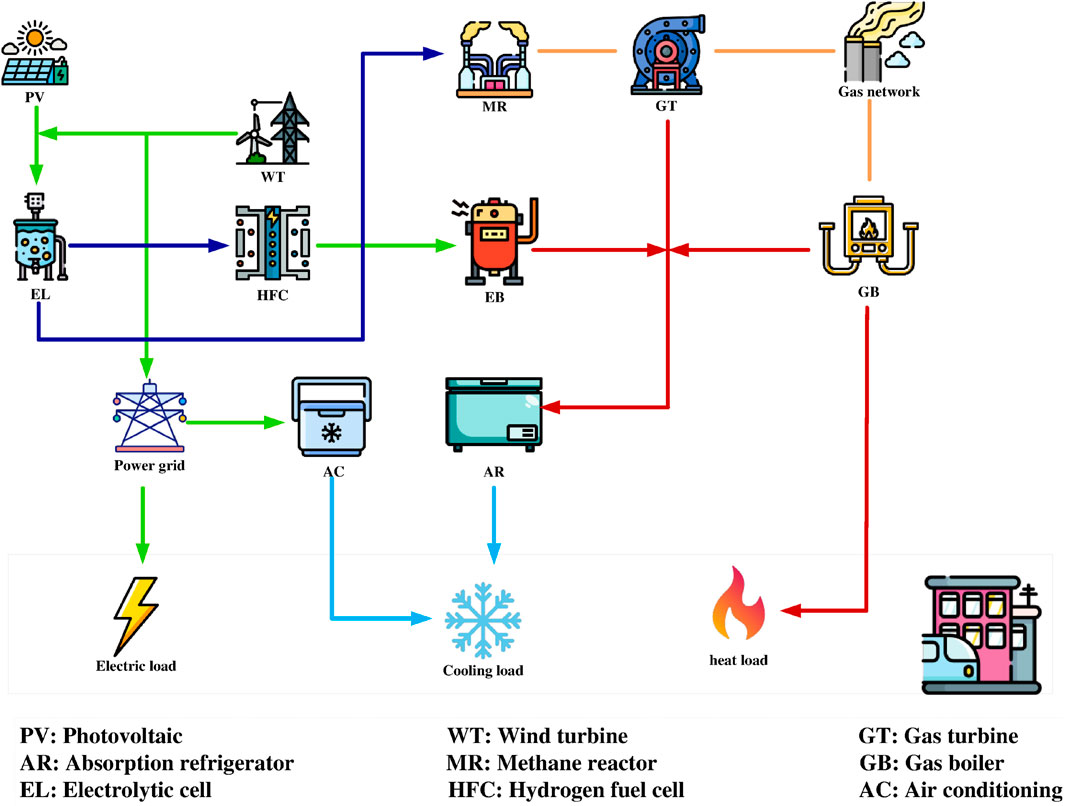
FIGURE 1. Structure of EH-IES.
In the electric–hydrogen-integrated energy system, renewable energy, GT, HFC, and the power grid provide electricity to users. The mathematical model is shown in Eq. 1:
where
In the electric–hydrogen-integrated energy system, the waste heat generated by GT, the heat generated by HFC itself, and the heat generated by GB, EB, and WH provide heat to the user. The mathematical model is shown in the following equation:
where
In the electric–hydrogen-integrated energy system, AC and AR provide cooling power to users. The mathematical model is shown in the following equation:
where
In the electric–hydrogen-integrated energy system, MR and EL provide natural gas to users. The mathematical model is shown in the following equation:
where
A virtual energy storage system is a theory that utilizes other devices or scheduling strategies to balance the power system’s energy. By transferring or transforming the energy emitted by various types of power sources, the system energy is adjusted to improve the reliability and quality of system operation and economic benefits (Chen et al., 2021). Virtual energy systems offset the lack of energy storage by managing and guiding energy demand interventions and realizing the effect of reducing energy storage capacity and costs. Utilizing virtual energy storage technology to optimize energy at different periods without adding new energy storage facilities, peak-to-low system capacity requirements for damaging backup can improve grid security while improving terminal energy utilization and reducing charging costs.
Demand-side controllable loads (such as air conditioners, water heaters, refrigerators, and electric vehicles) have the characteristics of flexible and controllable operation modes (Wang et al., 2019). The dispatch center can directly control them according to the system needs, or economic measures (such as real-time electricity prices) can guide users to change their energy consumption mode selectively, achieving the purpose of demand-side management.
where ΔPi indicates the amount of electricity consumption change in the ith period, Pi indicates the power consumption of the ith period, ΔCi indicates the amount of electricity price change in the ith period, Ci indicates the price of electricity in the ith period, and R is a correlation matrix composed of self-elastic coefficients and mutual elastic coefficients.
where
IES utilizes multiple energy sources for joint energy supply, which is a problem with the combination of the installed capacity of numerous energy sources during capacity configuration. When it comes to economic scheduling, the IES two-layer capacity configuration optimization model is established. The double-layer configuration model includes the upper-layer IES capacity configuration model and the lower-layer IES operation model. The upper-layer capacity configuration model takes the minimum daily investment construction cost and daily operation cost as the objective functions. In contrast, the lower-layer optimization operation model takes the minimum system operation cost as the objective function. The output results of the upper layer serve as the basis for the capacity of the lower-layer operating equipment, and the equipment capacity configured above the lower layer is the installed capacity. The equipment optimization operation strategy is solved using typical scenario daily load data. Figure 2 shows a schematic diagram of the dual-layer capacity configuration.
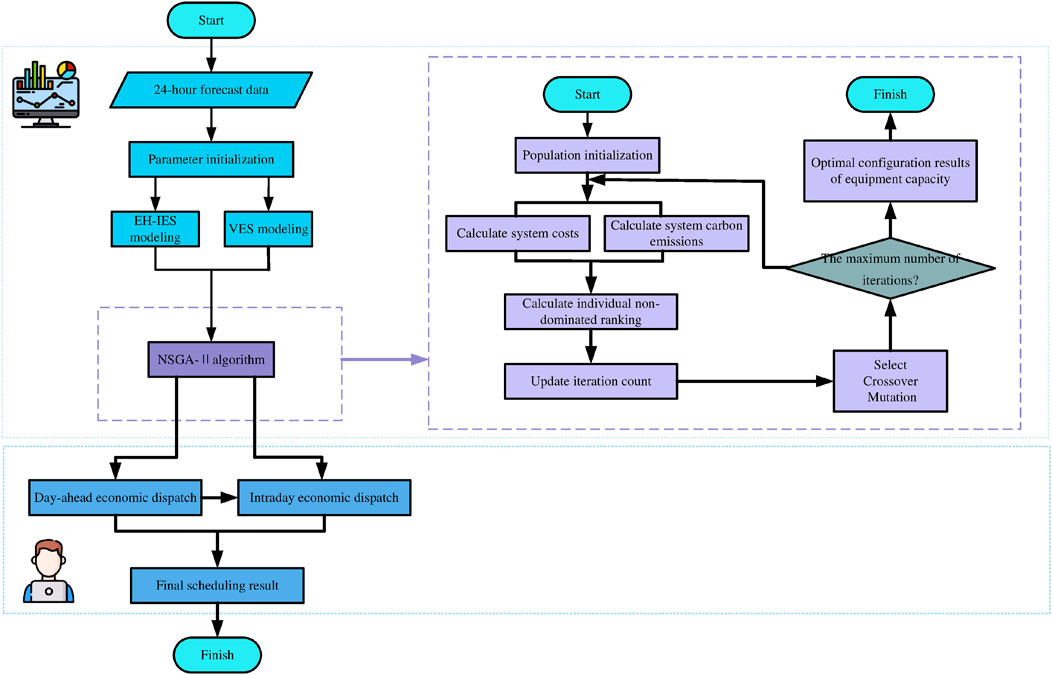
FIGURE 2. Building virtual energy storage structure.
The decision variable of the IES upper-level model is the installed capacity of equipment within IES, and the objective function is a multi-objective function that includes the total cost of IES and the total carbon emissions of IES. The total price of IES consists of the equivalent equipment investment construction cost and system operation cost of IES.
where Fa indicates the cost of purchasing electricity and gas from the power grid and gas network and Fc indicates the maintenance and operation cost of each device.
The lower model is mainly divided into two parts: day-ahead and intraday. The day before dispatching takes 1 hour as the timescale, and the execution period is 24 h. The day-ahead optimal operation status of each energy unit in IES, the real-time price of IDR, and the call plan of the first-type IDR resources are determined and substituted into the day-ahead dispatching. The optimization of intraday scheduling takes 15 min as the timescale and 4 hours as the execution cycle to revise the pre-day scheduling plan. At this stage, it is necessary to determine the call plan for the second type of IDR and the output plan for each energy unit.
where
Equation 13 represents the lower-level model constraints, mainly including the upper and lower limit constraints on the output of the equipment and the rate of climb constraints for specific equipment.
The system shown in Figure 1 is selected as the research object for the calculation example. The efficiency and other parameters of each energy conversion equipment are shown in Table 1. The time-of-use electricity price curve corresponding to typical days and the renewable energy and ambient temperature curves of the selected system on specific days in winter and summer are shown in Figure 3.
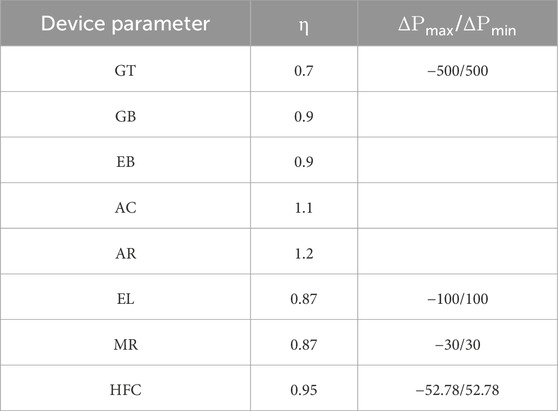
TABLE 1. Equipment parameters.
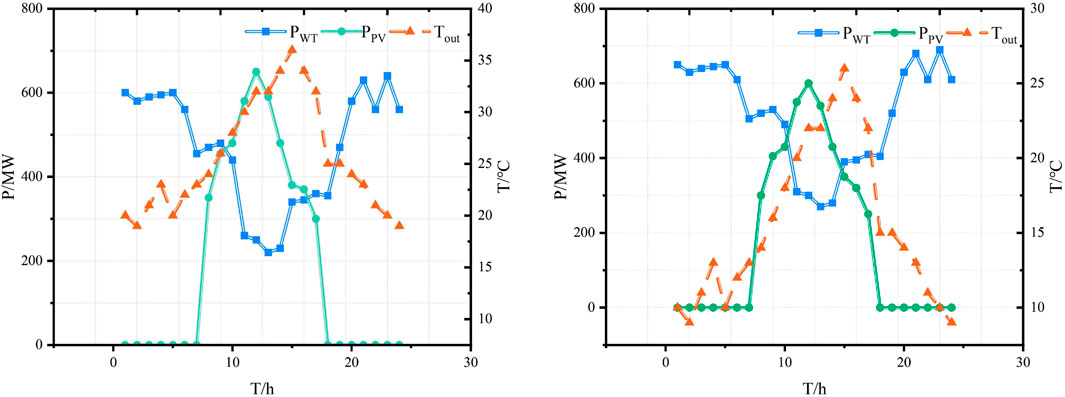
FIGURE 3. Wind- and photovoltaic-predicted power.
Considering the economy and environmental protection of the system at the same time, the NSGA-¢ò algorithm is used to solve the system model. The obtained Pareto optimal solution set is shown in Figure 4. The final capacity configuration results of the system are shown in Table 2.
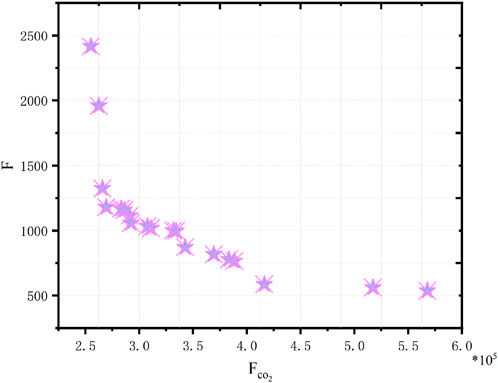
FIGURE 4. Upper-level optimization of the Pareto solution set.
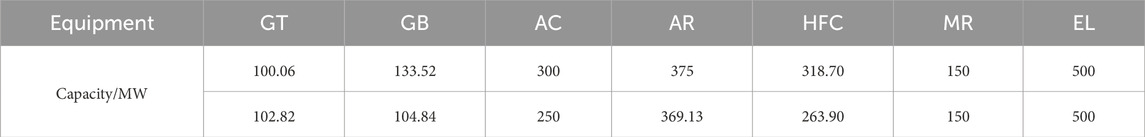
TABLE 2. Upper-layer capacity configuration results.
Table 3 shows the cost comparison of current low-carbon dispatch under two options. Due to the significant increase in renewable energy output in Scenario 2, the system’s electricity purchase cost decreased by 29.88% compared to Scenario 1, and the natural gas power output of the methane reactor increased. The system’s gas purchase cost decreased by 25.86% compared to Scenario 1. Due to the decrease in demand for cooling, heating, and power loads on the user side, the IDR cost of the system has also decreased by 10.55% compared to Scenario 1, and the total cost of EH-IES has reduced by 25.16%.
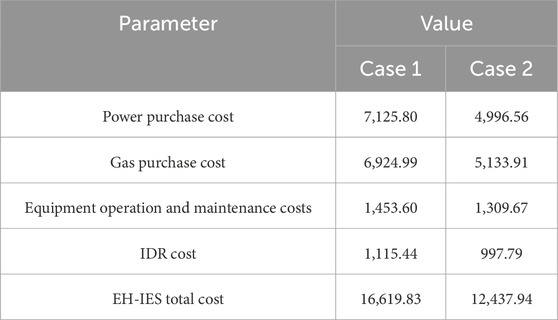
TABLE 3. Day-ahead cost.
Figure 5 shows the day-ahead dispatch optimization results of the integrated energy system, where the left image represents Scenario 1 and the right image represents Scenario 2. In the day-ahead optimization stage, the power, heating, and cooling systems jointly participate in energy dispatch. In terms of power supply, since the system incorporates electric boilers and refrigeration equipment, the electric energy generated by the system and the energy conversion equipment in the system must be provided to users. When the output of wind power and photovoltaic units exceeds the demand, the electrolyzer consumes the remaining electric energy to produce hydrogen. It is supplied to the methane reactor and fuel cell. The fuel cell is the leading power generation equipment of the electric–hydrogen-integrated energy system, and the gas turbine mainly provides electric energy to the system when the power supply is insufficient. In terms of heat supply, the heat generated by fuel cells and the thermal power caused by electric boilers serve as the leading heating equipment to provide thermal energy to users. At the same time, the absorption refrigerator absorbs part of the thermal power generated by the system for cooling. When the user’s heat demand is insufficient, the gas boiler and gas turbine work to provide heat power to the user.
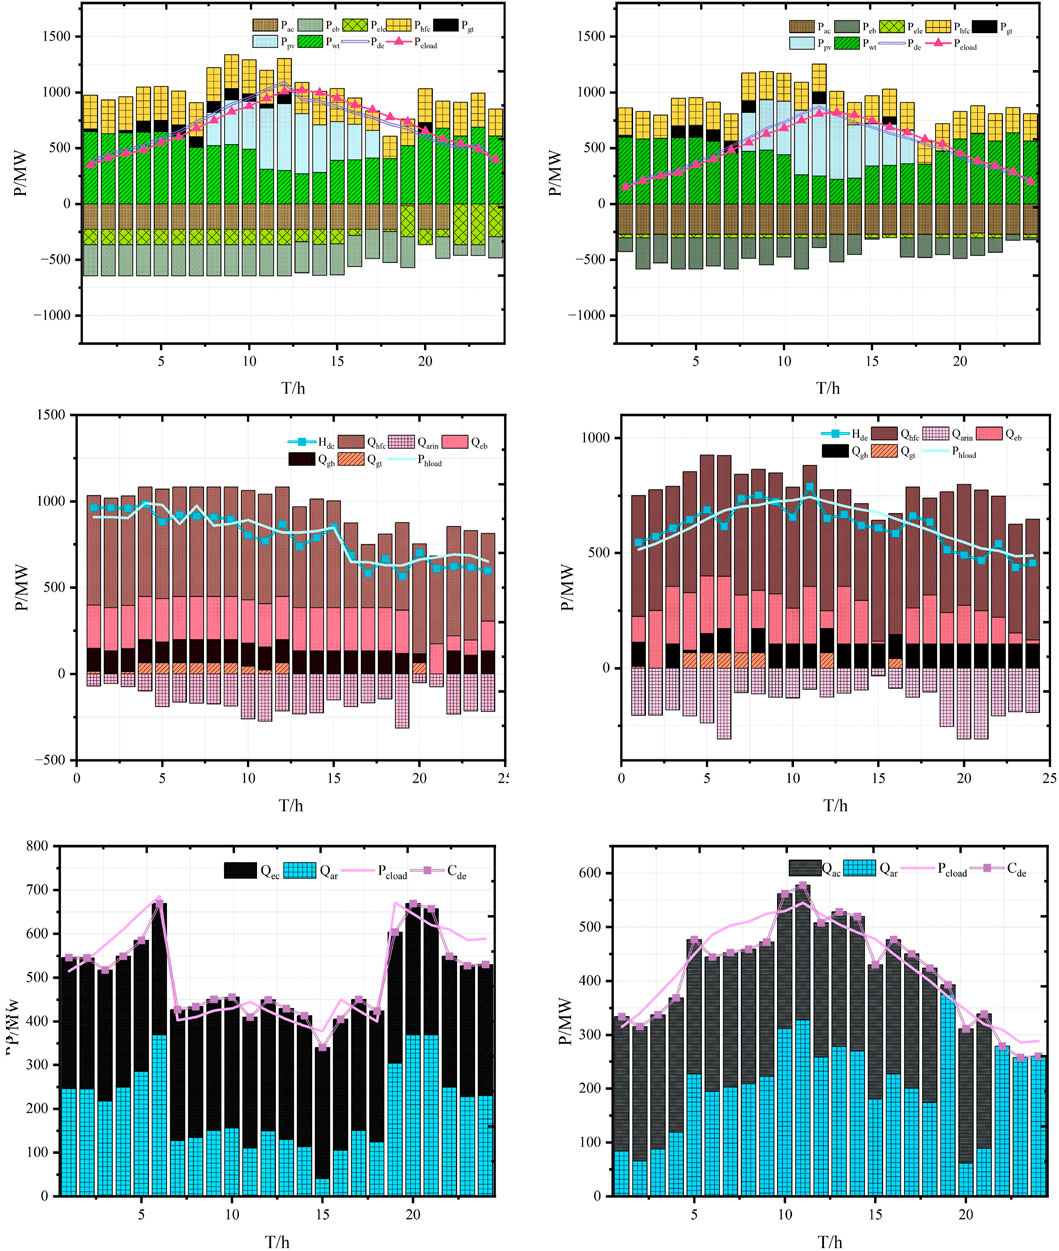
FIGURE 5. Day-ahead dispatching results.
Regarding cold power supply, absorption refrigerators and electric refrigerators provide hard power to users. Electric refrigeration provides most of the mean power demand when the system has excess electric power. The absorption refrigerator offers maximum cooling capacity when the system has excess thermal power to meet partial cooling power requirements.
The comparison of Scenarios 1 and 2 reveals that the increase in renewable energy output in Scenario 2 also significantly increases the production of the electrolytic cell. Therefore, adding the electrolytic cell to the system helps eliminate the redundancy in renewable energy. Due to the increase in cooling load demand and decrease in heating load demand in Scenario 2, the electricity consumption of electric refrigeration equipment increases, and the thermal power absorbed by absorption chillers decreases. Electric refrigeration is the primary cooling equipment. Due to the reduced demand for electricity and heat loads, fuel cells, as the main power supply and heating equipment, have relatively reduced operating power. The analysis of device operation in Scenarios 1 and 2 shows that the demand-side response can reduce energy consumption, increase demand when energy is redundant, and reduce need when energy supply is insufficient, which helps reduce IES operating costs. The reduction in operating expenses is mainly due to decreased power exchange costs, benefiting from peak shaving.
Table 4 shows the cost comparison of intraday scheduling under two schemes. Due to the significant increase in renewable energy production in Scenario 2, the system’s electricity purchase cost decreased by 25.48% compared to Scenario 1. Compared to Scenario 1, the natural gas power generation of the methane reactor increases, while the natural gas purchase cost in Scenario 2 decreases to 0. Due to the reduced demand for cooling, heating, and power loads from the user end, compared to Scenario 1, the IDR cost of the system has also decreased by 28.40%, and the total cost of EH-IES has reduced by 28.42%.The daily scheduling results of IES are shown in Figure 6. The output trend of each equipment in the daily plan is the same as the previous plan. Due to the use of data with higher prediction accuracy, it is closer to the actual situation. The output of coupling equipment and the interaction power between electricity, gas, and external networks have been corrected within the day. The interaction power curve with the power grid fluctuates with changes in electricity prices, and the purchase of electricity during peak hours significantly decreases to achieve economic optimization. Compared to natural gas, which has a longer power scheduling time, when the electricity price is high, it drives GT to generate electricity to maintain the system’s balance of supply and demand. However, when the price of natural gas is high, the output of GT is reduced. The optimization of cold/thermal energy within a day with a scheduling time of only hours is more accurate, and the production of the equipment may also change. The scheduling results before and during the day should be compared. Intraday scheduling can effectively track real-time power fluctuations on the demand side and new energy generation, improving the flexibility of system operation.

TABLE 4. Intraday cost.
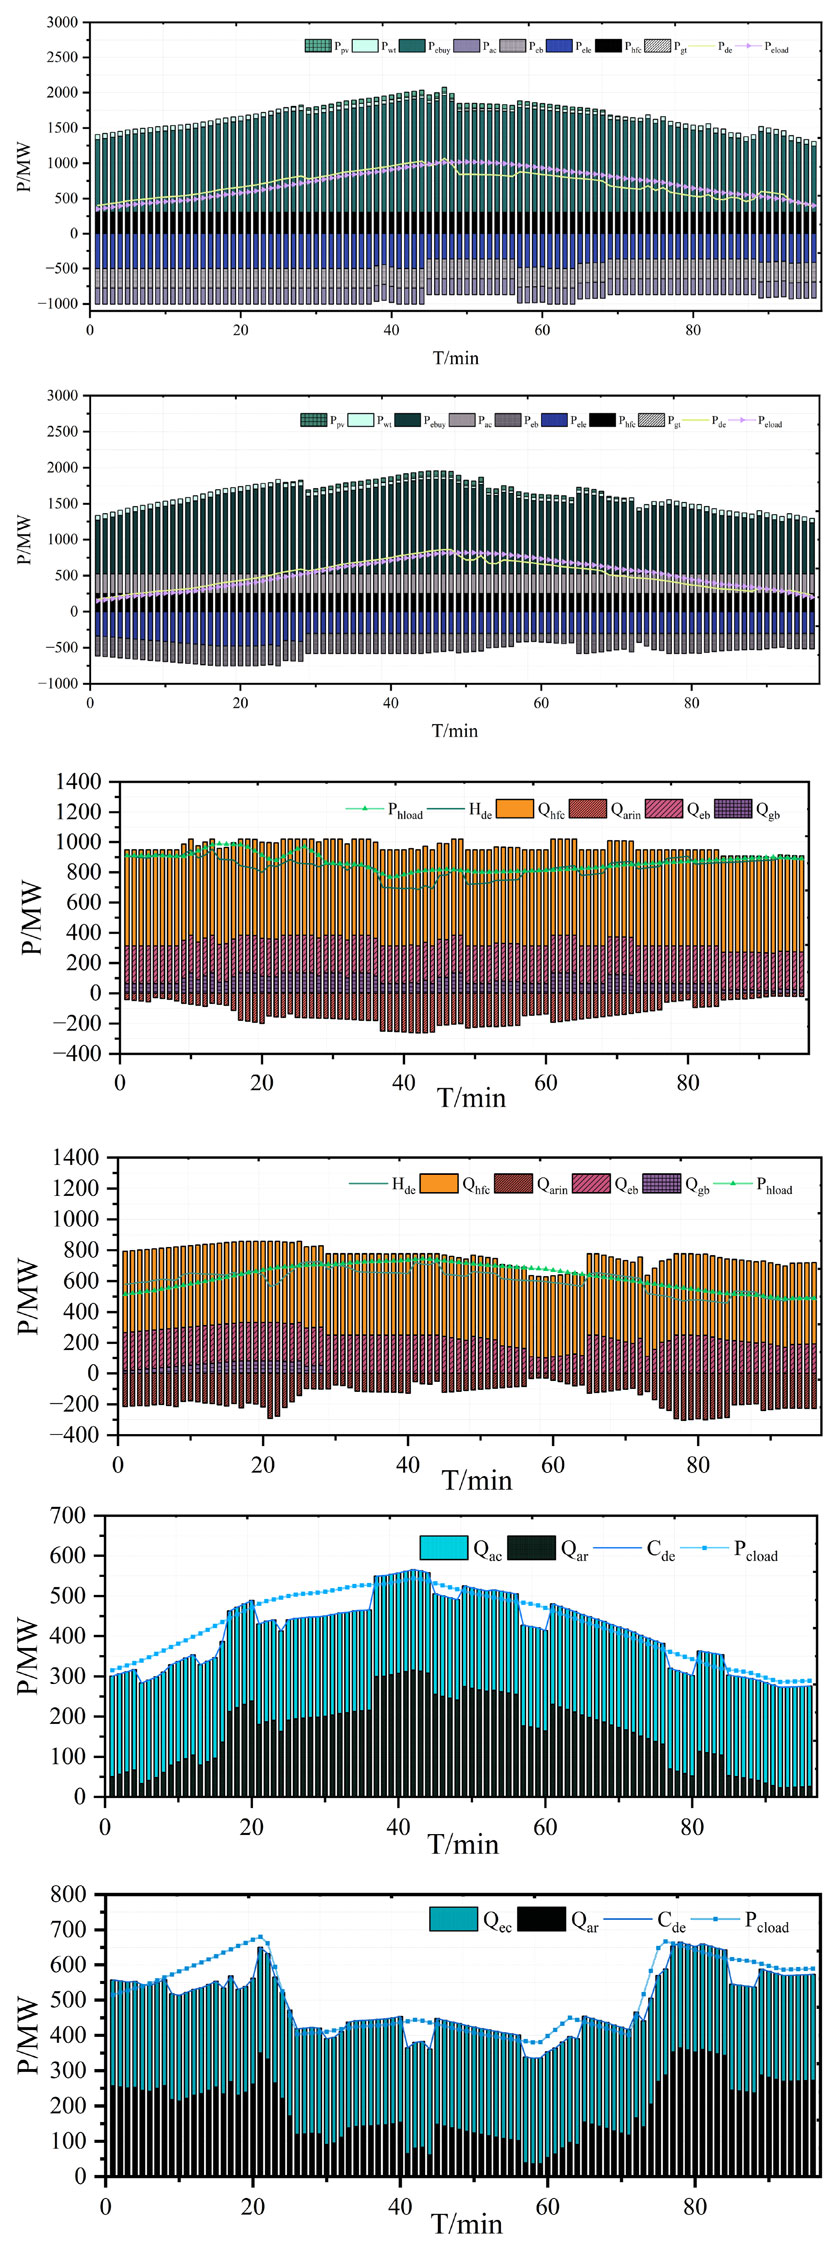
FIGURE 6. Intraday dispatching results.
The collaborative planning of multiple EH-IES equipment, incorporating wind and light equipment, led to an increase in the investment and construction costs of the system equipment. However, the operating costs of the system were significantly reduced. When virtual energy storage devices were added to the system, the system’s flexibility was further increased, and system reliability improved, resulting in a reduction in total operating costs. Adopting a bi-level programming model ensured both the economic scheduling of the system and the rationality of capacity allocation. By adopting a multi-timescale strategy, the lower-level models were scheduled to adjust the production, conversion, and usage of energy, improving the system’s flexibility and allowing it to respond quickly to changes brought about by the energy market, ensuring the economic operation of the system. The article only considered system optimization scheduling in the absence of faults. However, in real life, the system’s function in the event of equipment failure was evaluated. The next step will be to consider multi-state deficiencies in the design and the system’s operation in faulty scenarios west of the equipment to improve its accuracy further.
The original contributions presented in the study are included in the article/Supplementary Material; further inquiries can be directed to the corresponding author.
BZ: conceptualization and writing–original draft. CS: conceptualization, supervision, and writing–review and editing. CL: conceptualization, methodology, and writing–review and editing. TG: investigation, software, and writing–review and editing. XG: data curation, validation, and writing–review and editing. LZ: investigation, writing–original draft, and writing–review and editing.
The author(s) declare that financial support was received for the research, authorship, and/or publication of this article. This work was supported by the State Grid Gansu Electric Power Company Science and Technology Project Research (522703230005).
Authors BZ and CS were employed by State Grid Gansu Electric Power Company. Authors CL, TG, AL, XG, and LZ were employed by State Grid Gansu Electric Power Company Baiyin Power Supply Company.
All claims expressed in this article are solely those of the authors and do not necessarily represent those of their affiliated organizations, or those of the publisher, the editors, and the reviewers. Any product that may be evaluated in this article, or claim that may be made by its manufacturer, is not guaranteed or endorsed by the publisher.
Chen, C., Deng, X., Zhang, Z., Liu, S., Waseem, M., Dan, Y., et al. (2021). Optimal day-ahead scheduling of multiple integrated energy systems considering integrated demand response, cooperative game and virtual energy storage. Transm. Distribution 15 (11), 1657–1673. doi:10.1049/gtd2.12124
Chen, H., Wu, H., Kan, T., Zhang, J., and Li, H. (2023). Low-carbon economic dispatch of integrated energy system containing electric hydrogen production based on VMD-GRU short-term wind power prediction. Int. J. Electr. Power and Energy Syst. 154, 109420. doi:10.1016/j.ijepes.2023.109420
Dong, H., Shan, Z., Zhou, J., Xu, C., and Chen, W. (2023). Refined modeling and co-optimization of electric-hydrogen-thermal-gas integrated energy system with hybrid energy storage. Appl. Energy 351, 121834. doi:10.1016/j.apenergy.2023.121834
Dong, X., Wu, J., Xu, Z., Liu, K., and Guan, X. (2022). Optimal coordination of hydrogen-based integrated energy systems with combination of hydrogen and water storage. Appl. energy 308, 118274. doi:10.1016/j.apenergy.2021.118274
Li, C., Wang, N., Wang, Z., Dou, X., Zhang, Y., Yang, Z., et al. (2022). Energy hub-based optimal planning framework for user-level integrated energy systems: considering synergistic effects under multiple uncertainties. Appl. Energy 307, 118099. doi:10.1016/j.apenergy.2021.118099
Li, P., Wang, Z., Liu, H., Wang, J., Guo, T., and Yin, Y. (2021b). Bi-level optimal configuration strategy of community integrated energy system with coordinated planning and operation. Energy 236, 121539. doi:10.1016/j.energy.2021.121539
Li, P., Wang, Z., Wang, N., Yang, W., Li, M., Zhou, X., et al. (2021a). Stochastic robust optimal operation of community integrated energy system based on integrated demand response. Int. J. Electr. Power and Energy Syst. 128, 106735. doi:10.1016/j.ijepes.2020.106735
Li, Z., Wu, L., Xu, Y., and Zheng, X. (2021c). Stochastic-weighted robust optimization based bilayer operation of a multi-energy building microgrid considering practical thermal loads and battery degradation. IEEE Trans. Sustain. Energy 13 (2), 668–682. doi:10.1109/tste.2021.3126776
Li, Z., Xu, Y., Feng, X., and Wu, Q. (2020). Optimal stochastic deployment of heterogeneous energy storage in a residential multienergy microgrid with demand-side management. IEEE Trans. Industrial Inf. 17 (2), 991–1004. doi:10.1109/tii.2020.2971227
Ma, Y., Wang, H., Hong, F., Yang, J., Chen, Z., Cui, H., et al. (2021). Modeling and optimization of combined heat and power with power-to-gas and carbon capture system in integrated energy system. Energy 236, 121392. doi:10.1016/j.energy.2021.121392
Mu, Y., Chen, W., Yu, X., Jia, H., Hou, K., Wang, C., et al. (2020). A double-layer planning method for integrated community energy systems with varying energy conversion efficiencies. Appl. Energy 279, 115700. doi:10.1016/j.apenergy.2020.115700
Qiao, Y., Hu, F., Xiong, W., Guo, Z., Zhou, X., and Li, Y. (2023). Multi-objective optimization of integrated energy system considering installation configuration. Energy 263, 125785. doi:10.1016/j.energy.2022.125785
Saberi, H., Zhang, C., and Dong, Z. Y. (2023). Capacity of virtual energy storage system for frequency regulation services via a data-driven distributionally robust optimization method. IEEE Trans. Power Syst. 38 (3), 2134–2147. doi:10.1109/tpwrs.2022.3193899
Shen, H., Zhang, H., Xu, Y., Chen, H., Zhu, Y., Zhang, Z., et al. (2022). Multi-objective capacity configuration optimization of an integrated energy system considering economy and environment with harvest heat. Energy Convers. Manag. 269, 116116. doi:10.1016/j.enconman.2022.116116
Wang, D., Jia, H., Hou, K., Du, W., Chen, N., et al. (2019). Integrated demand response in district electricity-heating network considering double auction retail energy market based on demand-side energy stations. Appl. Energy 248, 656–678. doi:10.1016/j.apenergy.2019.04.050
Xang, Y., Cai, H., Gu, C., and Shen, X. (2020). Cost-benefit analysis of integrated energy system planning considering demand response. Energy 192, 116632. doi:10.1016/j.energy.2019.116632
Xiong, J., Sun, Y., Wang, J., Li, Z., Xu, Z., and Zhai, S. (2022). Multi-stage equipment optimal configuration of park-level integrated energy system considering flexible loads. Int. J. Electr. Power and Energy Syst. 140, 108050. doi:10.1016/j.ijepes.2022.108050
Yang, D., Xi, Y., and Cai, G. (2017). Day-ahead dispatch model of electro-thermal integrated energy system with power to gas function. Appl. Sci. 7 (12), 1326. doi:10.3390/app7121326
Yang, H., Li, M., Jiang, Z., and Zhang, P. (2020). Multi-time scale optimal scheduling of regional integrated energy systems considering integrated demand response. IEEE Access 8, 5080–5090. doi:10.1109/access.2019.2963463
Yang, Y., Li, Z., Mandapaka, P. V., and Lo, E. Y. (2023). Risk-averse restoration of coupled power and water systems with small pumped-hydro storage and stochastic rooftop renewables. Appl. Energy 339, 120953. doi:10.1016/j.apenergy.2023.120953
Zhang, L., Dai, W., Zhao, B., Zhang, X., Liu, M., Wu, Q., et al. (2023). Multi-time-scale economic scheduling method for electro-hydrogen integrated energy system based on day-ahead long-time-scale and intra-day MPC hierarchical rolling optimization. Front. Energy Res. 11, 1132005. doi:10.3389/fenrg.2023.1132005
Keywords: electricity–hydrogen-integrated energy system, virtual energy storage, capacity configuration, optimal scheduling, NSGA-II
Citation: Zhang B, Shao C, Li C, Guo T, Lei A, Guan X and Zu L (2024) Optimal scheduling of an electric–hydrogen-integrated energy system considering virtual energy storage. Front. Energy Res. 12:1359123. doi: 10.3389/fenrg.2024.1359123
Received: 20 December 2023; Accepted: 05 January 2024;
Published: 31 January 2024.
Edited by:
Ziming Yan, Nanyang Technological University, SingaporeReviewed by:
Zhengmao Li, Aalto University, FinlandCopyright © 2024 Zhang, Shao, Li, Guo, Lei, Guan and Zu. This is an open-access article distributed under the terms of the Creative Commons Attribution License (CC BY). The use, distribution or reproduction in other forums is permitted, provided the original author(s) and the copyright owner(s) are credited and that the original publication in this journal is cited, in accordance with accepted academic practice. No use, distribution or reproduction is permitted which does not comply with these terms.
*Correspondence: Longyu Zu, MTgyMzQ2MTk1OUBxcS5jb20=
Disclaimer: All claims expressed in this article are solely those of the authors and do not necessarily represent those of their affiliated organizations, or those of the publisher, the editors and the reviewers. Any product that may be evaluated in this article or claim that may be made by its manufacturer is not guaranteed or endorsed by the publisher.
Research integrity at Frontiers
Learn more about the work of our research integrity team to safeguard the quality of each article we publish.