 Zeyi Wang1
 Guangzhi Liu
94% of researchers rate our articles as excellent or good
Learn more about the work of our research integrity team to safeguard the quality of each article we publish.
Find out more
ORIGINAL RESEARCH article
Front. Energy Res., 20 May 2024
Sec. Smart Grids
Volume 12 - 2024 | https://doi.org/10.3389/fenrg.2024.1356227
This article is part of the Research TopicPower System Operation and Optimization Considering High Penetration of Renewable EnergyView all 26 articles
With distributed energy sources connected to the distribution grid on a large scale for distributed photovoltaic power randomness, this paper proposes a flexible interconnection system optimization operation strategy. First, the virtual synchronous control technology is improved to improve the DC bus voltage stability; second, it analyzes the system operation mode to judge the output logic of PV and storage units, takes DC bus power balance as the underlying logic, and puts forward the power coordination optimization strategy and fault power supply restoration strategy with full consideration of factors such as the load balance degree of the distribution station area, the economic operation of the main transformer, and the amount of power lost in the faulty station area. It also establishes a multi-objective optimization model to obtain the power commands of each port and achieves the power flexibility mutualization of the flexible interconnected system through the accurate regulation of the soft normally open point (SNOP). Finally, a simulation model of the flexible interconnection system is built using MATLAB/Simulink to verify the effectiveness of the proposed optimization strategy.
Promoting renewable energy substitution is an important way to achieve the goal of “carbon peak and neutrality targets.” In this context, the large-scale and high penetration rate of distributed energy access to the distribution system and the randomness of its output have posed new challenges to the traditional distribution network. The traditional distribution network in China generally adopts the operation mode of “closed-loop design and open-loop operation,” and the natural distribution of the current of each distribution station area during normal operation cannot actively balance the load, increasing the comprehensive loss of transformers in the station area and endangering the safe and stable operation of the distribution network in the case of extreme imbalance of the load. Traditional distribution stations are usually equipped with normally open contact switches, but when a fault occurs, the normally open contact switches are unable to regulate the power, which further worsens the problem of unbalanced loads in the station area. Therefore, the traditional distribution network is unable to solve the problems of balanced loads in the station area, light and heavy load operation of the main transformer, and transferring faults to the power supply (Koutsoukis et al., 2016). The soft normally open point (SNOP) can realize the power flexibility and mutual aid well, balance the load of the station area during normal time, and transfer part of the load to the faulty station area during fault time. Therefore, SNOP has significant advantages in improving new energy access capacity, balancing the load of each station area, and reducing system operation loss (Qin et al., 2016).
Currently, scholars’ research on SNOP in the flexible interconnection system focuses on the aspects of station load balancing, the main transformer avoiding falling into light and heavy load operations, and the restoration of power supply to faulty stations. Huo et al. (2018) proposed a control strategy based on SNOP to achieve the control objective of load balancing in the station area; Lou et al. (2019) proposed an adaptive power restoration strategy for SNOP considering distributed power sources, but they did not consider the problem of balancing the load on the feeders of each station when restoring the power supply in case of failure. Yin et al. (2018) proposed a non-stop switching strategy based on SNOP in case of failure. Zhang et al. (2020) proposed an optimization scheme for the power mutualization of faulty feeders. Most of them required switching control strategies when feeder faults occurred, thus increasing the control complexity. In this paper, we want to consider both load balancing and the restoration of the power supply to a faulty station. Based on this paper, we developed an optimization strategy for the multi-mode operation of the system. However, most of the schemes in the above literature require switching the control strategy in the event of a fault, thus increasing the control complexity. Wu et al. (2019) pointed out that the virtual synchronous machine-based SNOP control strategy can achieve switching between different operation modes and does not need to switch the control strategy, so this paper adopts the virtual synchronous control technique. Zhang et al. (2015) proposed a control method aiming at the overall load balance of low-voltage distribution substations. Tu et al. (2015) proposed an SNOP control method considering the economic operation of the main transformer, which effectively avoids the problems of load imbalance and the light–heavy operation of the main transformer. However, they did not consider the situation of the new energy access system under control. Qi et al. (2023) proposed a system strategy that aggregates multiple distributed resources, such as distributed PV, energy storage, and controllable loads, which reduces voltage fluctuations and maintains the safe and stable operation of the system. Assem et al. (2023) discussed and evaluated an optimal DC bus voltage regulation method that maintains the balance through the storage system, which results in smaller voltage fluctuations for grid-connected renewable energy sources such as PV. Wang et al. (2023) discussed a joint optimization model for wind–PV–load-storage microgrids in multiple scenarios and provided the optimal economic dispatch scheme in multiple scenarios. Based on this, this paper proposes a multi-mode operation strategy for photovoltaics and storage.
In summary, there are few studies that can simultaneously take into account the control objectives such as load balancing in the station area, avoiding the main transformer from falling into light and heavy load operation, and considering new energy access and power supply recovery in the faulty station area. Based on this, this paper takes the five-port flexible interconnection system as the research object and first improves the virtual synchronous control to improve the DC bus voltage stability. Second, it introduces the output logic of the photovoltaic and storage units in each operation mode after they are connected to the system, and for the unbalanced load of each station area and the main transformer of the station area light or heavy load operation and other problems, optimization strategies based on the virtual synchronous machine control are proposed for the normal and fault modes. Finally, the effectiveness of the proposed strategies is verified by simulation experiments on the flexible interconnection system.
The distribution substation flexible interconnection system is formed by SNOP interconnecting DC distribution substations with AC distribution substations. Through the power control of the voltage source converter (VSC), all kinds of dispatchable sources and loads in the flexible interconnection system are coordinated and deployed to avoid the problems of unbalanced loads and light or heavy loads on transformers. This paper takes the five-port flexible interconnection system as the research object, and the system is shown in Figure 1.
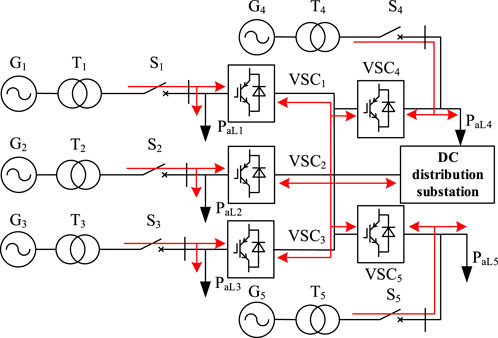
Figure 1. Five-port flexible interconnection system.
In Figure 1, Gi denotes the 10 kV distribution network; Si denotes the circuit breaker; Ti denotes the station transformer with a ratio of 10.5/0.4 kV; SNi denotes the rated capacity of the main transformer of each station, which is 315, 400, and 630 kVA, respectively; and PaLi denotes the total amount of active loads (kW) in each station. The direction of power flowing into SNOP in the system is specified to be positive.
In Figure 1, the DC power distribution station area consists of a PV unit, an energy storage unit, and DC loads such as charging piles. The PV unit works in the MPPT mode to output as much power as possible; the DC distribution station topology is shown in Figure 2.
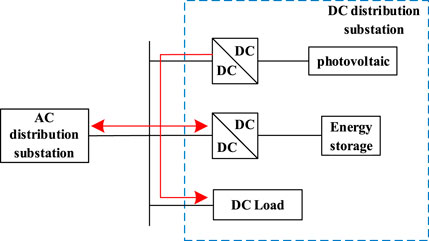
Figure 2. DC distribution station topology.
The traditional flexible interconnection control strategy to ensure stable operation of the system is the key to the stability of the DC bus voltage, and DC bus voltage and DC bus transmission of active power are closely related to the following analysis of the DC bus side of the active power balance.
The flexible interconnection system operates each distribution station to achieve flexible power interconnection through the DC bus, and its topology is shown in Figure 3. The DC side current is analyzed and obtained according to Kirchhoff’s current law:
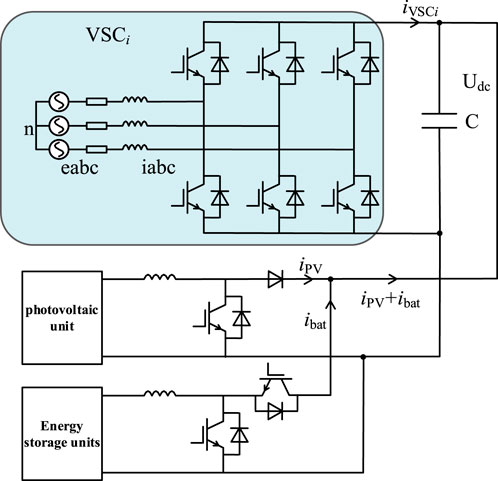
Figure 3. Five-port flexible interconnection system topology.
Multiplying both sides of Eq. 1 by Udc simultaneously gives
A further transformation of Eq. 2 above gives
In Eq. 3, when the DC bus voltage is stable, the power of each port is balanced, and each port outputs power according to the instruction. Thus, both the output power and the instruction value are the same, as can be obtained from Eq. 4:
If the DC bus voltage is disturbed, there will be unbalanced power. When each port converter uses traditional virtual synchronous control, the DC bus voltage can only be controlled by the energy storage unit, resulting in both unbalanced power and the energy storage unit being responsible for maintaining the stability of DC bus voltage. Distributed PV units are usually equipped with energy storage capacity ranging from 5% to 20% of their total capacity, so the stability of the DC bus voltage system is poorly controlled by the storage unit alone. In the system, frequent power transfers can easily cause deterioration in system control accuracy, which can lead to DC bus voltage instability and system control failure. By transforming Eq. 3, we can obtain
Further variations of Eq. 5 are available as follows, as shown in Eq. 6:
where ki is the scale factor.
By substituting Eq. 4 into the collation, we obtain Eq. 8
Analyzing the above equation, it can be seen that
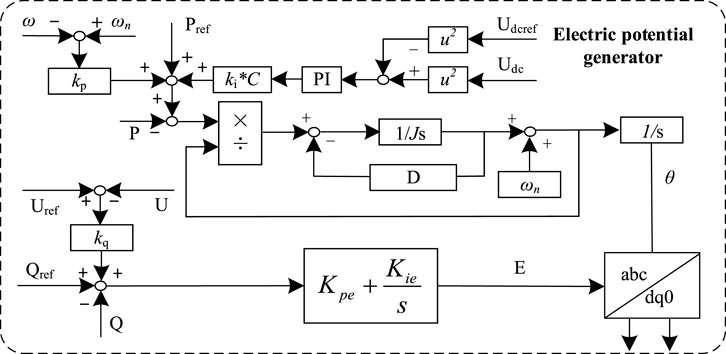
Figure 4. Virtual synchronous generator control.
In order to verify the role of the proposed control strategy in improving the DC bus voltage stability of the flexible interconnection system, the power fluctuation of the PV due to the change in light intensity at 1 s is set as the disturbance of the DC bus voltage. Under the same working conditions, the traditional virtual synchronous control strategy and the U compensation control strategy proposed in this paper are simulated, and the DC bus voltage waveform is obtained, as shown in Figure 5.
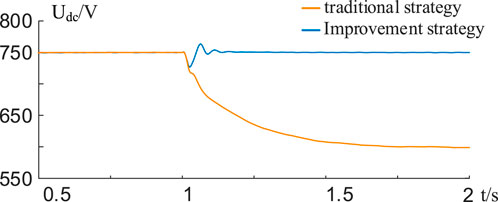
Figure 5. DC bus voltage waveform under PV fluctuation.
It can be seen that when the PV output fluctuates, the traditional control strategy can easily lead to DC bus voltage instability due to the weak regulation ability of the energy storage unit, while the control strategy proposed in this paper can use the converter of each port to quickly track the DC bus voltage, reduce the burden of the energy storage unit’s regulation and control, and then maintain the DC bus voltage constant during the power transmission process, which improves the stability of the flexible interconnection system. At the same time, the virtual synchronous control technique can provide frequency and voltage support for the downstream loads in the event of feeder failure without switching the control strategy, which reduces control difficulty.
When the system is running, factors such as the load state of the station, the PV output, and the charge state of the storage will change over time, which in turn leads to the system being in different operation modes, creating difficulties for the system’s multi-mode operation optimization strategy. Therefore, it is necessary to integrate the photovoltaic and storage units and analyze the corresponding photovoltaic and storage joint operation modes and switching logic when the system is running in each mode. First of all, the power transfer relationship of the system in each mode should be analyzed to determine the operating state of the system, which provides a reference for the control of the photovoltaic and storage units.
It is defined that when the load of a station exceeds 75% of the capacity of the main transformer of the station, the main transformer of the station is put into heavy load operation, and when it is lower than 25% of the capacity of the main transformer of the station, the main transformer of the station is put into light load operation. The critical power of the system can be expressed as follows in Eq. 9:
where Ppv is the generation power of the PV unit; PaLi is the load power of the AC distribution station i; PdL is the load power carried by the DC distribution station; ST is the rated capacity of the transformer; cosφ indicates the transformer power factor, which is taken to be 0.95; and n is the total number of normal feeders connected to SNOP. The first term in the formula indicates the maximum power that can be supplied when all n main transformers are critically reloaded (Duan et al., 2020). When Pnet ≥ 0, it is said that the system operates in the critical power redundancy state; otherwise, it is said that the system operates in the critical power deficit state.
Due to the volatility of the PV unit output, if it is directly consumed by the AC distribution station, it will cause a large disturbance to the system and destroy the stability of the system (Zhang et al., 2022). The reasonable scheduling of energy storage devices can alleviate the impact of PV output uncertainty on the distribution network and play the role of peak shaving and valley filling (Pei et al., 2022). However, there is a lack of capacity allocation of energy storage units or no configuration of energy storage units, so this paper adopts the energy storage unit on the PV unit for “dynamic peak shaving and valley filling.” The PV unit and the energy storage unit are integrated; according to the PV unit’s output prediction, reasonable overall output power is set, which is defined as the photovoltaic and storage joint output reference power Pdc, and then determined according to the system state. In this paper, the final output power obtained from the energy storage unit and the PV unit is defined as the photovoltaic and storage joint output power, PDC, in order to achieve the control goal that the PV output is jointly consumed by the energy storage unit, the DC load, and the AC distribution station area and reduce the perturbation caused by the fluctuation of the PV output power to the system.
The specific charging and discharging action states of the energy storage unit depend on the output power of the PV unit and the overall power transfer of the system. If the system meets condition A1, the energy storage unit charge state meets B1, and the PV unit output does not reach the photovoltaic and storage joint output reference power Pdc; that is, the photovoltaic unit output meets condition C1. At this time, the energy storage unit discharges in order to achieve the reference value of the photovoltaic and storage joint output power; however, if the system critical power shortage is in condition A2, the photovoltaic unit output meets condition C2 and the energy storage unit charge state satisfies condition B1. In order to avoid further shortages of system power, at this time, the energy storage unit is not charged, and the joint output power of photovoltaic and storage is only photovoltaic power. In a certain operating mode, the charge state of the energy storage unit will also have differences, leading to different photovoltaic and storage joint operating modes, along with various modes of operation switching, as shown in Figure 6.
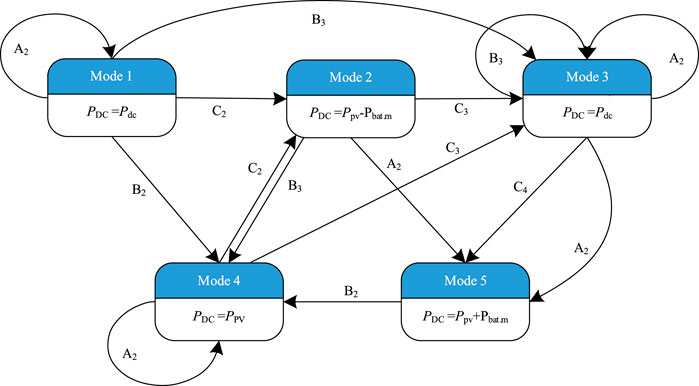
Figure 6. Operational mode switching.
In Figure 6, Pbat. m is the maximum charge/discharge power of the energy storage unit; when the PV unit is configured with the energy storage unit, Pbat. m is set according to the actual maximum charge/discharge power of the energy storage unit; when the PV unit is not configured with the energy storage unit, Pbat. m is taken to be 0. It should be pointed out that when conditions A2 and B2 are satisfied, the photovoltaic storage unit operates in Mode 4, regardless of the state of condition C. The judgment conditions for each state in Figure 6 are shown in Table 1:
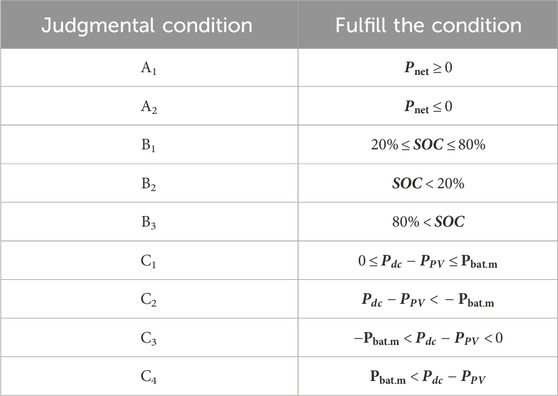
Table 1. System status judgment criteria.
First, system power redundancy and, second, the charging state of the energy storage unit should be determined, which can be divided into five categories of the photovoltaic storage unit operation modes, as shown in Table 2, and ultimately, the joint output power PDC of the photovoltaic and storage systems can be determined. This approach aims to reduce the difficulty of the coordinated control of flexible interconnected systems while at the same time effectively reducing the PV power fluctuations caused by the system perturbation.
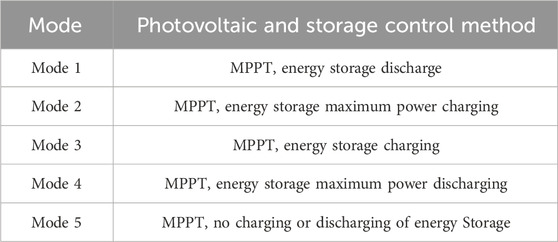
Table 2. Operation of each mode.
In order to verify the effectiveness of the regulation strategy, this paper first substitutes the optical storage joint output reference power, and then, according to the specific operating state of the system to discriminate the final determination of the optical storage joint output power, the specific working conditions are set as follows in Table 3:
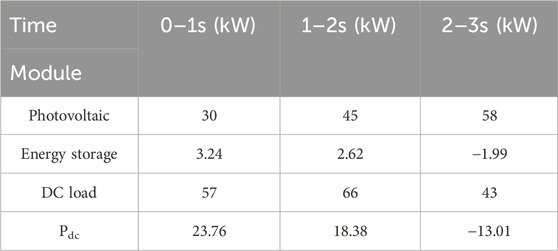
Table 3. Working condition setting.
In this paper, a simulation comparison of the system under two types of photovoltaic and storage operation modes is designed. One is the regulation strategy proposed in this paper, and the other operation mode is the traditional strategy of coordinated operation of PV and storage, and the simulation results are shown in Figures 3–8.
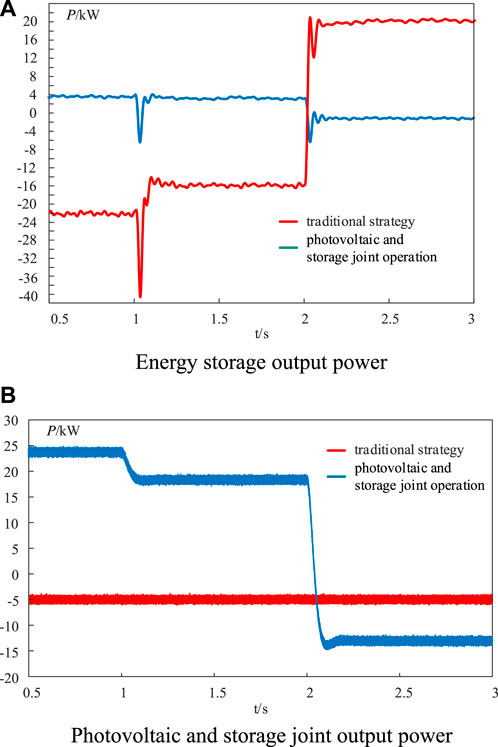
Figure 7. Simulation results: (A) energy storage output power and (B) photovoltaic and storage joint output power.
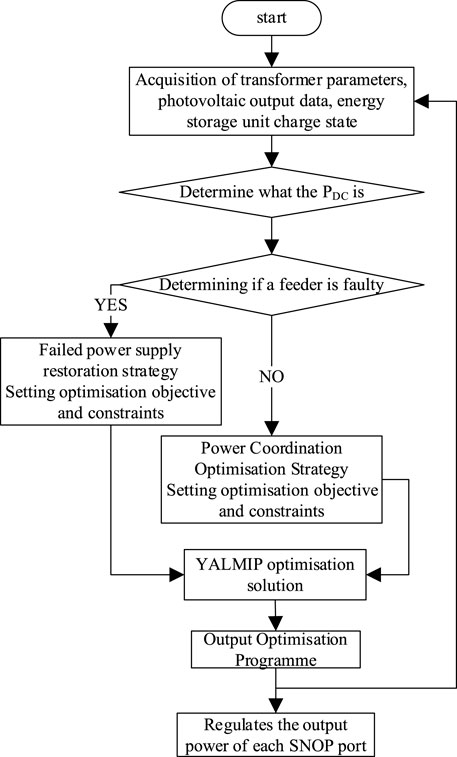
Figure 8. Optimize processes of the flexible interconnection system.
Figure 7A shows the energy storage output power of the two control strategies, and it can be seen that when the traditional strategy of the coordinated operation of PV and storage operation is used to run, the battery charging and discharging power reaches more than 20 kW. On the other hand, the battery charging and discharging power can be controlled within 5 kW during the operation of photovoltaic storage joint regulation, so it can be proved that the photovoltaic and storage joint regulation strategy can effectively solve the problem of insufficient energy storage configuration. Figure 7B shows the active power output to the AC side of the two control strategies. It can be seen that the strategy proposed in this paper enables flexible scheduling on the AC side. When the PV power is sufficient and the load demand is low, the AC distribution station can be used to absorb the surplus power. When the PV power cannot meet the demand of the load, the AC distribution station can be called upon to supply the power to SNOP. This approach can effectively reduce the burden of the battery balancing power and improve the stability of the system.
Photovoltaic and storage joint operation can be more randomly distributed photovoltaic output power into a stable and controllable photovoltaic and storage joint output power, which facilitates the optimization strategy for its real-time scheduling. This paper takes the DC bus power balance as the underlying logic and proposes the power coordination optimization strategy and feeder failure power supply restoration strategy for the system operation mode.
Each station carries different loads in the system, and it is impossible to balance the loads of each station before connecting to SNOP. The situation will endanger the safe operation of the distribution network when it is serious, and improving the degree of balancing of loads at each station is conducive to energy saving and consumption reduction to ensure the economic and safe operation of flexible interconnection systems (Lin et al., 2022). In this paper, the standard deviation of the station load ratio is used to measure the degree of load balancing in the station area, and the smaller the standard deviation is, the higher the degree of load balancing in the station area. The standard deviation η of the main transformer load rate can be expressed as Eqs. 10–12.
where
SNOP interconnects the low-voltage side of the transformer, and the line loss can be ignored, while the main transformer of each station area is the key equipment of the distribution station area. The majority of the station area loss is transformer loss, which is about 70% (Chunming et al., 2023), and the comprehensive transformer loss is closely related to the transformer loading rate, so it is necessary to consider the variability of the economic operation of different models and capacities of transformers. The GB/T13462 economic operation of power transformers puts forward the concepts of transformer integrated power loss and integrated power loss rate, which are calculated as Eqs 13, 14.
where
In summary, power co-ordination optimization should be constructed with the objective of minimizing the standard deviation of the load factor of the station area and the integrated power loss of the transformer as the power co-ordination optimization model, and its objective function is Eqs 15, 16.
Formula 13 can be plotted as a concave function of the relationship between the transformer-integrated power loss rate and load rate. If the main transformer load rate of each station is too low or too high, it will increase the loss rate of the transformer. In addition, the optimal economic operation interval of different series of transformers varies; for example, the optimal economic operation interval of the S9 series transformer is [0.25,0.75]. Therefore, the optimal economic operation constraint of the transformer can be derived as Eq. 17.
In addition, the constraints of the power-coordinated optimal control model are included as follows:
(1) Feeder power balance constraints
(2) DC bus power balance constraints
(3) SNOP capacity constraints
where
SNOP access to the distribution system can reduce the outage time, cut off the fault current through blocking in the event of a fault, and cooperate with the relay protection device to quickly remove the fault. SNOP can also transfer the load of the faulty station area to minimize the loss of power in the faulty station area as an objective. In the specific implementation of the transfer objective, the degree of load balancing in the station area and the integrated power loss of the transformer should also be considered. Therefore, taking the failure of station i as an example, the objective function of the feeder fault power supply restoration strategy model is Eqs 21–23:
After the fault in station i is removed, the system topology will be changed, and the constraints that should be satisfied by the feeder fault recovery strategy model need to be altered as follows.
(1) Feeder power balance constraints is Eqs 24, 25
In addition, it should also be considered that the power supply of important loads in the faulty station area cannot be interrupted, and important loads are introduced without power supply constraints.
(2) Important load uninterrupted power constraints is Eq. 26.
where
Both optimization models in this paper are multi-objective optimization models, and hierarchical analysis can be used to deal with the objective function in order to achieve the transformation from multi-objective to single-objective, as shown in Eq. 27.
where
The objective function during normal operation is to minimize the standard deviation of the station load rate and minimize the integrated power loss of the transformer; in this paper, we take objective functions 1 and 2 to be equally important and set the weight vector of each objective as Eq. 28.
When the feeder fault occurs and the system is working in the load transfer stage, the objective function includes the minimum power loss in the fault area, the minimum standard deviation of the load rate in the station area, and the minimum integrated power loss of the transformer, in which the minimum power loss in the fault area is more important than the other two objectives, and the remaining two objectives are taken as equally important (Zhan et al., 2023); accordingly, the discriminant matrix is obtained, and the weight vector of each objective can be obtained after normalization computation.
In the feeder failure, the system works in the load transfer stage. The objective function includes the minimum power loss in the fault area and the minimum comprehensive power loss of the transformer, in which the minimum power loss in the fault area and the minimum standard deviation of the load rate of the station area are taken to be equally important and are more important than the other objective [10], according to which the discriminant matrix is obtained as Eq. 29
The consistency indicator and consistency ratio are defined, respectively. As shown in Eqs 30, 31.
where
The active power reference value of each converter in a multi-state switch is obtained by solving the objective function, which leads to the coordinated control of the system.
The flow chart of the operation optimization strategy of the flexible interconnection system is shown in Figure 8. First, basic parameters such as transformer, PV output data, and energy storage unit charge state are collected to provide conditions for determining the operation mode of the system; then, the photovoltaic and storage joint operation mode is judged, and the final photovoltaic and storage joint output power is determined; second, it is judged whether there is any feeder failure in the system, and a system optimization model is established based on the judgment results, which are solved using the CPLEX commercial solver; and finally, according to the solved decision variables (the output power of each port of SNOP), the precise regulation of the flexible interconnected system is realized.
The simulation model is established in the MATLAB/Simulink environment, and the flexible interconnection system is shown in Figure 1.Duan et al. (2020) performed the comparison experiment, and the simulation and experimental parameters are shown in Table 4.
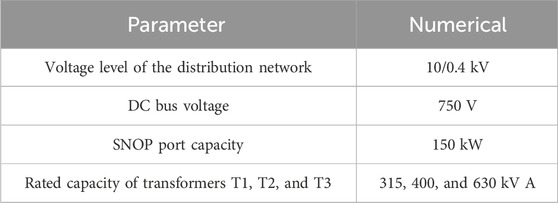
Table 4. Flexible interconnected system simulation parameters.
In order to verify the feasibility of this paper’s load regulation strategy and energy balance control method, this paper, based on the full consideration of a variety of complex operating conditions and extreme power mutations in the distribution area, designs the simulation of the power reality information, as shown in Table 5. It can be seen that in each AC distribution station area in [0,1) s, transformer T3 operates under a light load. At 1s, there is a load mutation in station area 1, increasing to 250 kW. In [1,2) s, transformer T1 operates under a heavy load, while transformer T3 continues to operate under a light load. At 2 s, the load in station area 1 returns to 150 kW. Furthermore, there is a load mutation in station area 3, increasing to 200 kW. Station area 4 increases its load by 50 kW, while station area 5 reduces its load by 75 kW. In [2s], station area 1 returns to a load of 150 kW, station area 3 maintains its load at 200 kW, station area 4 increases its load by 50 kW, and station area 5 reduces its load by 75 kW. With a 75 kW load, in [2,3) s, transformer T5 operates under a light load. At 3s, the load in station 4 mutates to 250 kW, and in [3,4) s, transformer T4 operates under a heavy load. The DC distribution platform simulates charging pile load mutations and PV output volatility. The charging pile load is designed to be 5 kW in the [0,2) s interval and increases to 50 kW at 2s. The PV output is designed to fluctuate between 15 kW and 25 kW. The energy storage unit’s initial SOC is set to 60%, with a maximum charge and discharge power of 5 kW. The photovoltaic and storage joint output reference power Pdc in this paper is set to 20 kW. In this paper, the reference power Pdc is set to 20 kW, and the joint output power PDC is 20 kW at all stages after the determination. The following figure shows the joint output power waveform of the photovoltaic and storage systems, as shown in Figure 9.
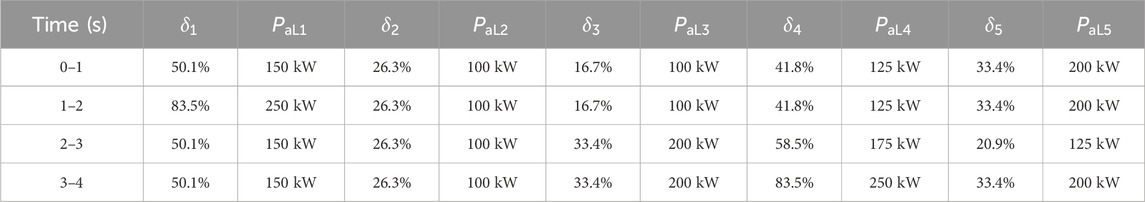
Table 5. Simulation power fact sheet.

Figure 9. Photovoltaic and energy storage output power.
After determining the joint output power of photovoltaic and storage at each stage, it is substituted into the power coordination optimization model, and the power command of each VSC is obtained using the CPLEX solver, and the result is shown in Eq. 33.
The output power waveform of each converter is shown in Figure 10. When the SNOP power command is changed, each port can track the power command quickly and precisely.
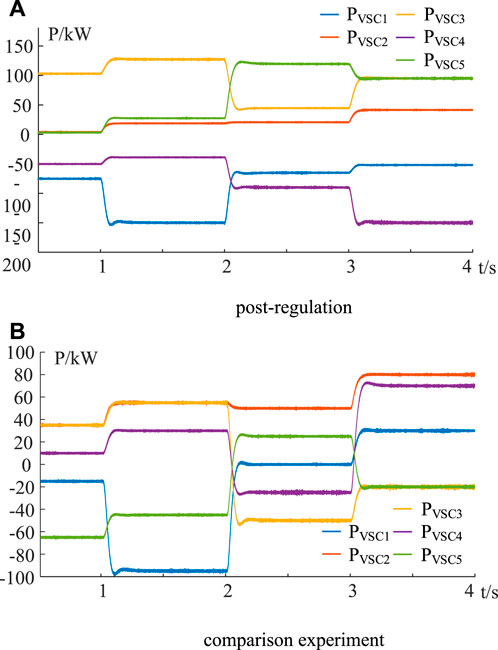
Figure 10. SNOP active power waveforms: (A) post-regulation and (B) comparison experiment.
Figure 11 shows the transformer load rate waveform. Figure 11A shows the unregulated transformer load rate, and the transformer is caught in the light and heavy load operations. Figure 11B shows the comparative experiment, which results in the overloading of the transformers due to the failure to take into account the difference in the capacity of each transformer. Figure 11C shows the transformer load rate after adopting the power coordination and optimization strategy, and the main transformer load rate of each station can be kept in the optimal economic operation interval [0.25,0.75] after regulation.
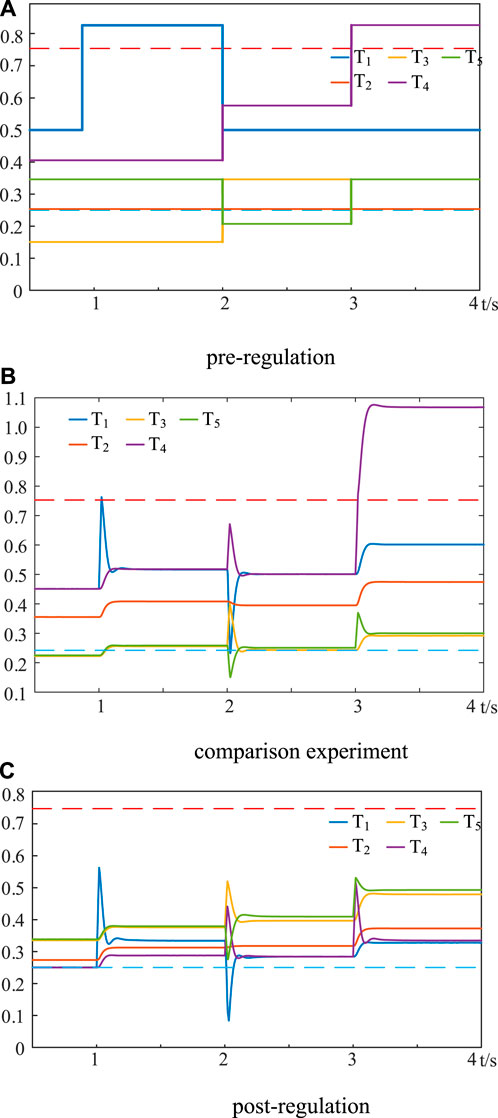
Figure 11. Transformer load factor waveforms: (A) pre-regulation, (B) comparison experiment, and (C) post-regulation.
Figure 12 shows the standard deviation of the load rate of each station before and after optimization compared with the comparison test. It can be seen that the comparison test did not take into account the differences between the distribution stations, and the load distribution was unbalanced. After optimization, the load balance of the distribution stations was significantly improved, which is conducive to the safe and economic operation of the flexible interconnection system.
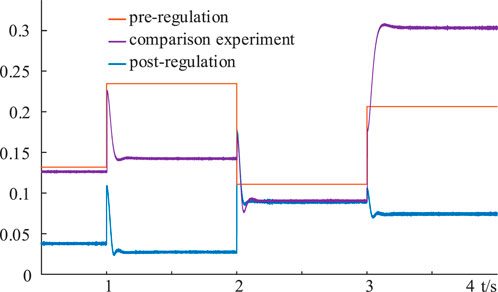
Figure 12. Standard deviation of n feeder load factor.
Figure 13 shows the DC voltage waveform of the flexible interconnection system, and the results show that the battery can effectively stabilize the DC side voltage at 750 V. The load of the station area changes at 1 s, 2 s, and 3 s, and the power command of each port of the SNOP also changes, and the DC voltage fluctuates to a certain extent. Among them, the DC side voltage fluctuation is most obvious at 2 s due to the sudden increase in the DC side load, but the maximum fluctuation amplitude does not exceed 20 V (the fluctuation ratio is less than 5%).
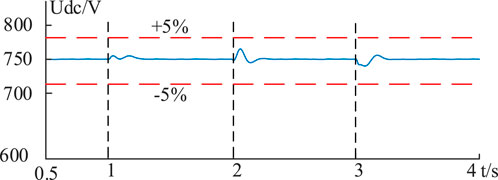
Figure 13. DC bus voltage waveform.
In order to verify the feasibility of the feeder fault recovery strategy, the working condition settings of the DC distribution station and each AC distribution station are the same as those in Section 4.1 and will not be repeated here. At 2 s, a fault occurs in station 2, in which the important load is 30 kW, and the load-cutting operation is required when it cannot be completely transferred to the capacity limitation of the converter port. After the determination of the fault condition, the combined photovoltaic and storage output power PDC of each stage is still 20 kW in each converter output power command, as shown in Eq. 34, and the simulation results are shown in Figure 14.
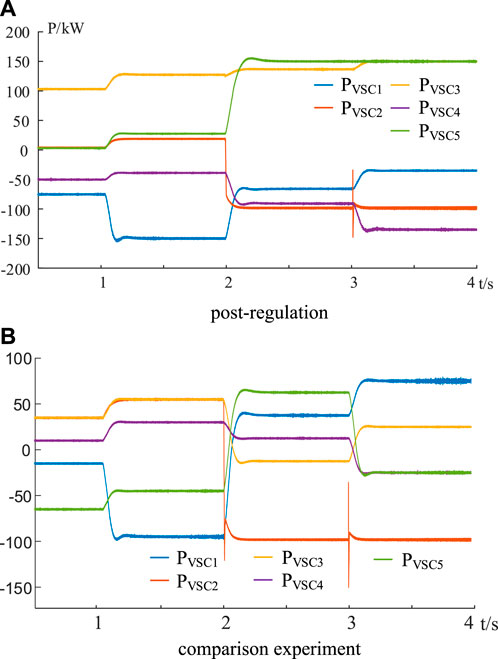
Figure 14. SNOP active power waveforms: (A) post-regulation and (B) comparison experiment.
As shown in Figure 14, the ports are still able to track power commands quickly and accurately under fault conditions.
Figure 15A shows the transformer load ratio waveform. After the fault occurred, the main transformer load ratio of station area 2 dropped to 0, the load of station area 2 all lost power, and the main transformer of the rest of the station area easily fell into light and heavy load operations without regulation. Figure 15B shows the ease with which the table transformer can fall into light or heavy load operations under the comparative experiment. After adopting the control strategy of this paper, the load of station area 2 will be reasonably allocated to the normal station area for load transfer to supply and effectively avoid transformer fall into the light and heavy load operations; at this time, the transformer load ratio is shown in Figure 15C.
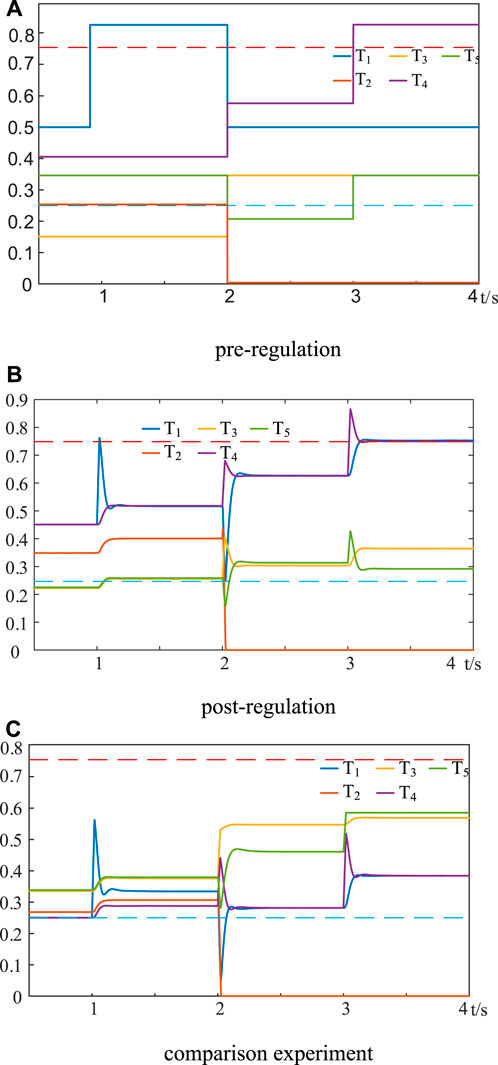
Figure 15. Transformer load factor waveforms: (A) pre-regulation, (B) post-regulation, and (C) comparison experiment.
Figure 16 shows the comparison of the power loss of each station before and after optimization. Before the optimization of station 2 failure, which involves a complete power outage, all power is lost. However, after the use of the control strategy proposed in this paper, the remaining normal stations can redistribute their power to supply the faulty station loads. The four normal distribution stations in this paper they are capable of transferring all the faulty station loads and can ensure that the load of each station is balanced, as shown in Figure 17.
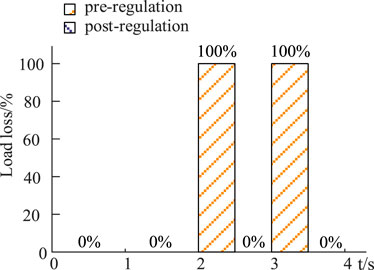
Figure 16. Load loss of faulty stations before and after regulation.
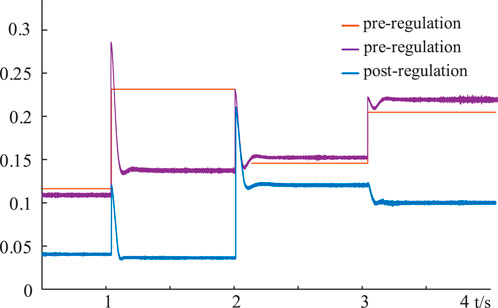
Figure 17. Standard deviation of n feeder load factor.
Figure 18 shows the DC voltage waveform. The failure of feeder 2 of the station at 2 s has the largest disturbance to the system, and the DC side voltage fluctuation is also the most obvious. However, the maximum fluctuation amplitude of the DC side voltage is not more than 35 V (the fluctuation ratio is less than 5%).
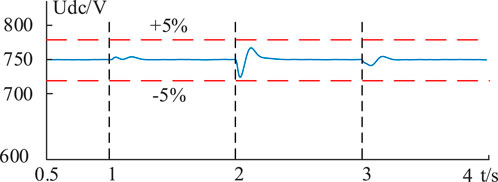
Figure 18. DC bus voltage waveform.
Figures 19, 20 show the waveforms of AC voltage and angular frequency on the faulted feeder, respectively. The AC side voltage and frequency of the station can still be stabilized at 380 V/50 Hz after the fault and are not affected by the sudden change in the load of the station at the moment of 3 s.
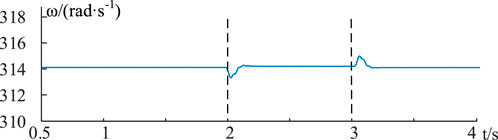
Figure 19. Angular frequency of the fault station.
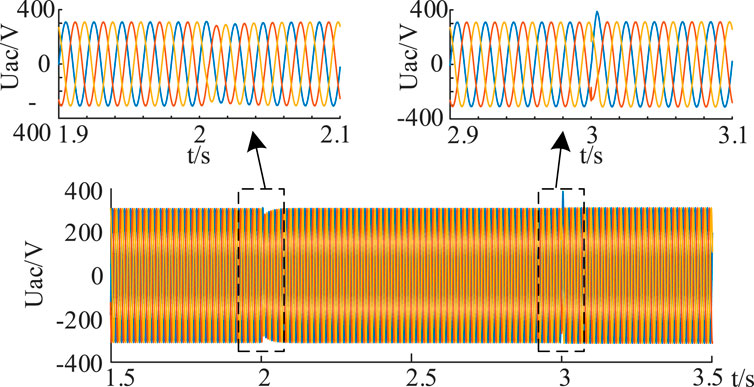
Figure 20. AC voltage of the faulted station.
Based on the improved virtual synchronous control strategy, this paper proposes a joint multi-mode operation strategy for photovoltaic and storage. Optimization strategies are proposed for the normal and fault modes, and the simulation verifies the reasonableness and effectiveness of each strategy. The conclusions are as follows:
(1) The joint operation and control strategy of photovoltaic and storage proposed in this paper can effectively improve the controllability of distributed PV and the real-time scheduling of distributed PV to participate in the system power mutual benefit.
(2) The optimization strategy proposed in this paper is based on the constraints of the economic operation interval of the transformers and the control objectives of balanced load on the feeder line and minimum integrated power loss of the transformer. The model is solved to ensure the balanced regulation of the load in the station area, effectively avoiding the light–heavy load operation of the main transformer in the station area and, at the same time, improving the economy of the system.
(3) The virtual synchronous control strategy in this paper can effectively maintain the stability of the DC bus voltage, and at the same time, when a fault occurs, there is no need to switch the control strategy so that it can provide support for the faulty line and ensure power supply for important loads.
It should be noted that, in practice, VSC transmission efficiency will change along with the power command, and the existing model should be improved by considering the changes in VSC efficiency; at the same time, there are still many problems to be solved in terms of how to set the reference power for the joint output of photovoltaic and storage. In-depth research on the above aspects will be carried out later.
The original contributions presented in the study are included in the article/Supplementary material; further inquiries can be directed to the corresponding author.
ZW: writing–original draft. GL: writing–original draft. DP: writing–review and editing. YW: writing–review and editing. BY: writing–review and editing. ZW: writing–review and editing.
The authors declare that financial support was received for the research, authorship, and/or publication of this article. The authors would like to thank the project supported by Science and Technology Project of State Grid Jilin Electric Power Company (SGJLCC00KJJS2203595).
Authors ZeW, DP, YW, and BY were employed by State Grid Changchun Power Supply Company.
The remaining authors declare that the research was conducted in the absence of any commercial or financial relationships that could be construed as a potential conflict of interest.
The authors declare that this study received funding from State Grid Jilin Electric Power Company. The funder had the following involvement in the study: Methodology, Data curation and Writing–original draft.
All claims expressed in this article are solely those of the authors and do not necessarily represent those of their affiliated organizations, or those of the publisher, the editors, and the reviewers. Any product that may be evaluated in this article, or claim that may be made by its manufacturer, is not guaranteed or endorsed by the publisher.
Chunming, T. U., Xin, WANG, and Yang, W., (2023). Soft open point control strategy considering transformer economic operation range of distribution area. Power Syst. Technol. 47 (02), 848–858.
Duan, Q., Sha, G., Wanxing, SHENG, et al. (2020). Multi-mode operation and its control strategy of flexible interconnected system for distribution network. Electr. Power Autom. Equip. 40 (11), 9–24.
Houria, A., Toufik, A., Farid, B., Laarouci, C., Belhaouas, N., and Hadj Arab, A. (2023). Adaptive fuzzy logic-based control and management of photovoltaic systems with battery storage. Int. Trans. Electr. Energy Syst. 2023, 1–18. doi:10.1155/2023/9065061
Huo, Q., Su, M., Lixin, W. U., et al. (2018). Compound control strategy for flexible multi-state switch. Automation Electr. Power Syst. 42 (7), 166–170.
Koutsoukis, N. C., Siagkas, D. O., Georgilakis, P. S., et al. (2016). Online reconfigurati-on of active distribution networks for maximum integration of distributed generate-on. IEEE Trans. Automation Sci. Eng. PP (2), 1–12.
Lin, K., Yang, J., Zhang, Y., et al. (2022). A demand response optimization model for charging stations with dual power supply. Power Syst. Prot. Control 50 (17), 68–75.
Lou, C., and Yang, J. (2019). “Adaptive service restoration strategy of distribution networks with distributed energy resources and soft open points,” in 2019 25th International Conference on Electricity Distribution, Madrid, Spain, 3-6 June 2019 (Madrid, Spain: CIRED), 395–400.
Pei, L., Zhinong, W. E. I., Chen, S., et al. (2022). Multi-stage stochastic optimization dispatch model for AC-DC hybrid distribution power networks. Power Syst. Prot. Control 50 (14), 23–32.
Qin, H., Wang, C., Liu, S., et al. (2016). Discussion on the technology of intelligent micro-grid and flexible distribution system. Power Syst. Prot. Control 44 (20), 17–23.
Wang, H. P., Wu, X. W., Sun, K., Du, X., He, Y., and Li, K. (2023). Economic dispatch optimization of a microgrid with wind-photovoltaic-load-storage in multiple scenarios. Energies 16 (9), 3955. doi:10.3390/en16093955
Wu, R., Ran, L., Weiss, G., and Yu, J. (2019). Control of a synchro nverter-based soft open point in a distribution network. J. Eng. 2019 (16), 720–727. doi:10.1049/joe.2018.8382
Yin, Lu, Yi, S., Zhang, K., et al. (2018). Operation mode of 10 kV distribution network with flexible looped network controller. Electr. Power Autom. Equip. 38 (1), 137–142.
Zhan, Q., Su, J., Lin, J. Y., and Guo, S. (2023). Coordinated optimization of source-storage-load in distribution network based on edge computation. Energy Rep. 9, 492–498. doi:10.1016/j.egyr.2023.04.324
Zhang, G., Peng, Bo, Zhu, Y., et al. (2020). Power supply restoration strategy based on flexible multi-state switch in case of loss of feeder power. High. Volt. Eng. 46 (8), 2723–2731.
Zhang, Q., Wangbao, H. U., Liu, Y., et al. (2022). A novel power sharing strategy for multi photovoltaic converters in a DC microgrid. Power Syst. Prot. Control 50 (09), 101–112.
Keywords: flexible interconnection, load balancing, economic operation of main transformer, power mutualization, virtual synchronous control technology
Citation: Wang Z, Liu G, Pang D, Wang Y, Yu B and Wang Z (2024) Optimal operation of flexible interconnected distribution grids based on improved virtual synchronous control techniques. Front. Energy Res. 12:1356227. doi: 10.3389/fenrg.2024.1356227
Received: 15 December 2023; Accepted: 22 April 2024;
Published: 20 May 2024.
Edited by:
Shengyuan Liu, State Grid Zhejiang Electric Power Co., Ltd., ChinaReviewed by:
Huangqing Xiao, South China University of Technology, ChinaCopyright © 2024 Wang, Liu, Pang, Wang, Yu and Wang. This is an open-access article distributed under the terms of the Creative Commons Attribution License (CC BY). The use, distribution or reproduction in other forums is permitted, provided the original author(s) and the copyright owner(s) are credited and that the original publication in this journal is cited, in accordance with accepted academic practice. No use, distribution or reproduction is permitted which does not comply with these terms.
*Correspondence: Zhenhao Wang, TDQ5MjYzMjQ2NkAxNjMuY29t
Disclaimer: All claims expressed in this article are solely those of the authors and do not necessarily represent those of their affiliated organizations, or those of the publisher, the editors and the reviewers. Any product that may be evaluated in this article or claim that may be made by its manufacturer is not guaranteed or endorsed by the publisher.
Research integrity at Frontiers
Learn more about the work of our research integrity team to safeguard the quality of each article we publish.