 Kun Wang
 Li Li2
 Ruijie Huang
94% of researchers rate our articles as excellent or good
Learn more about the work of our research integrity team to safeguard the quality of each article we publish.
Find out more
ORIGINAL RESEARCH article
Front. Energy Res., 29 January 2024
Sec. Advanced Clean Fuel Technologies
Volume 12 - 2024 | https://doi.org/10.3389/fenrg.2024.1356183
This article is part of the Research TopicProduction Technology for Deep ReservoirsView all 37 articles
The study of heterogeneous and complex oil and gas reservoirs poses a significant challenge due to the problem of unstable seepage flow. This research investigates the non-linear seepage flow patterns in such reservoirs, with a particular focus on ultra-low permeability tight gas reservoirs, using fractal theory. By analysing the scale invariance in the seepage flow of ultra-low permeability tight gas reservoirs, we have derived a fractal geometric expression based on the capillary pressure curve. This expression was integrated with mercury intrusion porosimetry to study the fractal dimension of ultra-low permeability reservoirs. Our experimental results indicate the presence of fractal characteristics in ultra-low permeability tight gas reservoirs. Based on this, we have investigated the fractal nature of matrix porosity and fractures and their effect on the stress sensitivity of ultra-low permeability tight gas reservoirs. This led to the development of a new fractal model for seepage flow in these reservoirs, which takes into account the non-Darcy flow behaviour of gas in nanoscale pores. The mathematical model was simplified using point source solutions and regular perturbation methods. The analysis shows that the fractal parameters of the matrix and fractures, together with the adsorption coefficients and the permeability modulus, have a significant influence on the dynamic pressure behaviour. The effects of slip and diffusion coefficients and stress sensitivity on the dynamics were also investigated. The pressure dynamics curves of ultra-low permeability tight gas reservoirs show distinct differences from those of homogeneous reservoirs and conventional dual porosity reservoirs. This study not only reveals the unique dynamic pressure characteristics of ultra-low permeability tight gas reservoirs, but also shows that the traditional reservoir models are, under certain conditions, special cases of the model proposed in this paper.
Pore structures have a significant influence on gas reserves and affect the productivity and recovery efficiency of wells. Fundamental research has shown that analysing the fractal characteristics of these structures is a valuable approach. Fractal dimensions provide a thorough and quantitative description of reservoir rocks, including pore size distribution, structural complexity and granular composition.
Mandelbrot, an innovator in fractal geometry, expanded fractal theory’s reach, applying it to complex natural phenomena that defy explanation through conventional Euclidean geometry (Mandelbrot and Wheeler, 1983). Krohn’s SEM studies of various rock sections revealed distinct fractal attributes in a range of sandstone types, including low permeability, tight, and carbonate rocks, particularly within the 0.2–50 μm pore size range (Krohn, 1988). P. M. Adler’s incorporation of regular fractals into porous media descriptions led to a deeper understanding of fractal diffusion and percolation within these entities (Adler and Thovert, 1993). A. M. Vidales creatively developed a fractal formula linking porosity and permeability in fractal porous media (Vidales and Miranda, 1996). Employing the spherical matrix model alongside the Hagen-Poiseuille equation enabled the creation of a fractal permeability model for bi-disperse porous media (Yu and Li, 2001). R. Alfaro’s CT-based fractal dimension analysis of low permeability, tight rocks confirmed their fractal characteristics (Alfaro, 2004). Zhang’s investigation of porous membranes’ fractal features across different Knudsen numbers added to the scholarly dialogue (Zhang, 2008). Roberto F. Aguilera’s introduction of a fractal distribution equation, adaptable for various shape distributions, represented a notable progress (Aguilera et al., 2012). Research led by Yang et al. (2014) in the Sichuan basin examined low permeability, tight rocks, verifying their irregular pore surfaces exhibit fractal properties. An important observation was made: higher fractal dimensions correspond to increased adsorption capacities in these structures (Yang et al., 2014).
Despite a substantial body of evidence confirming the effectiveness of fractal theory in elucidating complex structures, many seepage models for ultra-low permeability tight gas reservoirs currently overlook these fractal characteristics. This divergence highlights the critical need for improvements in the incorporation of fractal theory into seepage models to ensure alignment with the real production dynamics of ultra-low permeability reservoirs.
When exploiting ultra-low permeability tight gas reservoirs, a decrease in reservoir pressure is accompanied by an increase in effective stress on rock particles (Deng et al., 2013). Therefore, it is important to incorporate stress sensitivity into seepage theories that apply to these reservoirs. This requires recognition of the fractal attributes and pressure-dependent aspects of permeability and porosity. Therefore, it is essential to apply fractal geometry theory to dual-medium, pressure-sensitive, ultra-low permeability tight gas reservoirs. This leads to the development of a dual porosity fractal seepage theory model, which is then analytically evaluated under pressure-sensitive scenarios.
Furthermore, research has confirmed that adsorbed gas is prevalent in ultra-low permeability reservoirs. Gas flow in low permeability, compact nano-matrix pores is mainly controlled by slippage and Knudsen diffusion (Ozkan et al., 2009). This study addresses the complexities of adsorbed gas adsorption and desorption, as well as non-Darcy flow in matrix pores. A mathematical model for flow in fractals of dual porosity, ultra-low permeability tight gas reservoirs under pressure-sensitive conditions is rigorously developed. The model is resolved using source functions, Laplace transformations, canonical perturbations, and delta generalized functions, providing a point source solution for these reservoirs. The study employs artificial fracturing to identify the transient pressure response of fractured horizontal wells in Laplace space. A multitude of pressure dynamic curves are produced and examined to shed light on the diverse influencing factors. The formula for the adsorption coefficient during the model’s resolution is redefined in an innovative approach. This redefinition includes total organic carbon (TOC) content and other geologically relevant parameters, aligning with contemporary geological perspectives. This not only highlights the potential impact of TOC on transient pressure responses but also establishes a vital link between reservoir development and geological characteristics. These insights and methods collectively provide essential guidance for interpreting and analyzing pressure responses in ultra-low permeability tight gas reservoirs, reinforcing their scholarly and practical significance.
Fractal geometry theory is a valuable tool for understanding complex phenomena in ultra-low permeability tight gas reservoirs. These reservoirs have a fractal structure with statistical properties throughout their pores and fluid flow network. The reservoir as a whole can be viewed as an extended fractal network. A model based on fractal principles is proposed for the gas reservoir, taking into account essential features such as bedrock, pores and fractures. Recent advances in fractal geometry have significantly advanced its implementation in geological studies, leading to remarkable results in areas such as oilfield production, pore structure analysis, fracture evaluation and reservoir heterogeneity characterisation. These advances have given rise to the concept of “fractal geology.” The use of fractal geometry to create accurate models of the complex pore configurations in low permeability tight gas reservoirs has gained increasing recognition. The study of fractal properties has played a significant role in this development.
In a three-dimensional Euclidean space, the fractal dimension of pore structures typically falls within a fractional interval of 2–3 (Giri et al., 2012). A reduced fractal dimension indicates a more homogeneous and smoother pore throat surface, which is indicative of superior reservoir rock functionality. As a porous entity, the low permeability tight reservoir is complex and irregular, containing nanometre-scale pores. Due to its distinctive pore arrangement and the specialized state of the natural gas it contains, the reservoir presents a challenge to traditional assessment methods that are suitable for conventional gas reservoirs (Fang, 2012). The fractal model is an essential technique for quantitatively deciphering the pore structure of low permeability tight gas reservoirs, based on experimental findings from methods such as mercury intrusion porosimetry (Huang, 2014). This approach presents a quantitative depiction of the reservoir’s pore microstructure (Zhang, 2010).
Notably, ultra-low permeability tight gas reservoirs, along with coal-bed methane (CBM) and other non-traditional reservoirs, exhibit intricate pore configurations. The fractal interpretation of the capillary pressure curve, which has been validated in coal-bed methane research, is also applicable to ultra-low permeability tight gas reservoirs. The examination of the mercury porosimetry curve and fractal dimension provides a detailed understanding of the fractal properties found in low permeability tight gas reservoirs.
These samples underwent rigorous experimental analysis, and the results are presented in Figure 1. The mercury intrusion curve profiles of each sample showed a pronounced similarity, with each having a unique “plateau segment.”
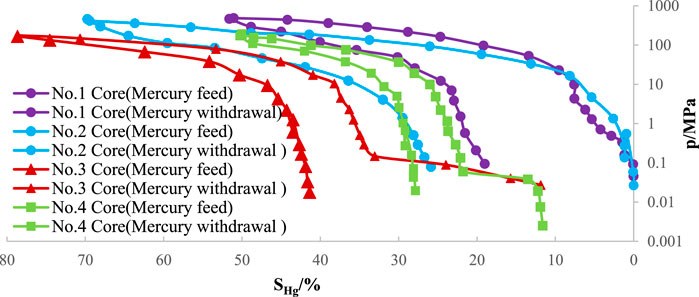
FIGURE 1. Mercury porosimetry curve in samples.
Referring to Supplementary Appendix SA, we have explained the relationship between the volume infiltrated by the non-wetting phase (mercury) and the capillary pressure. This relationship can be accurately calculated using the following equation:
Formula: V is the total pore volume of the core, cm3; Vmp is the volume of mercury pressed into the core, cm3; pc is the capillary force, MPa; D is the fractal dimension, dimensionless.
According to Eq. 1, On the double logarithmic graph, a linear relationship between lg (dVmp/dpc) and lg (pc) is evident. Therefore, in lg (dVmp/dpc)–lg (pc) figure, The tight fractal dimension D for low permeability can be obtained by calculating the slope.
When examining the slope shown in Figure 2, we calculated the fractal dimensions for four core samples with great care. The values obtained were 2.702, 2.753, 2.618, and 2.859, respectively. It is important to note that these fractal dimensions closely converge to the value of 3. This pattern is characteristic of the intricate and complex pore structures found in low-permeability tight gas reservoirs. The complexity is further increased by the abundance of minuscule pores, which can lead to suboptimal reservoir performance. The fractal dimension values approach the upper limit of 3, which supports our theoretical understanding. This highlights the importance of fractal dimensions as a precise characterization parameter. This insight is crucial when constructing a seepage model for ultra-low permeability tight gas reservoirs, as it requires meticulous consideration of the fractal characteristics of pores.
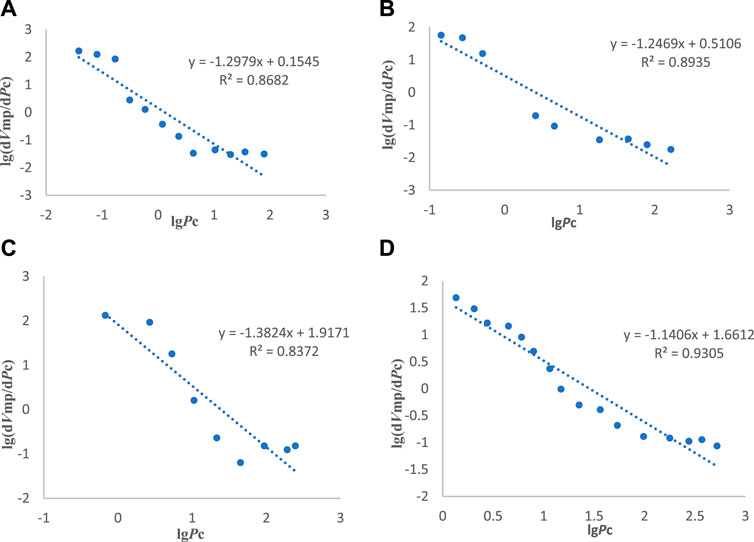
FIGURE 2. lg (dVmp/dPc) and lg (Pc) Relation diagram regressed by core experiment: (A) Sichuan No. 1 core; (B) Sichuan No. 2 core; (C) Sichuan No. 3 core; (D) Barnett 1 core.
The natural fractures in tight gas reservoirs exhibit a wide range of characteristics, including substantial variability in scaling, frequency of occurrence, and spatial extent. These characteristics are intrinsically linked to the fracture process inherent in initial brittle materials, which gives rise to fractal structures. The fracture network model originated from research on nuclear waste management. In a study conducted by (Barton and Larsen, 1985), the researchers discovered the self-similarity of fractures within a scaling range of 0.2–15 m during their exploration of Nevada’s Yucca Mountain. They used the box-counting method to assess Yucca’s fracture network and observed that fractal geometry applies to a wide range of objects, from micro fractures to the South Atlantic’s seabed, extending over eight orders of magnitude. Building on this (Sammis and Ashby, 1986), investigated the Geysers geothermal field in northeastern California. They detected a fractal pattern in the fractures and calculated their fractal dimensions (Chelidze and Gueguen, 1990). Analysed ground fissure graphics within a dolomite marble stratum located near Canan, Connecticut, United States. They concluded that the three-dimensional fracture network is a fractal entity. This adds to the existing body of knowledge.
It is worth noting that the alignment with fractal characteristics is not exclusive to natural fracture networks. Artificially induced fractures in reservoir rocks also exhibit distinct geometric features. Comprehensive experiments and studies have consistently confirmed that gas reservoir fracture systems evolve into fractal structures, ranging from faults to microfractures. Given the extensive coverage of fractured fractals in literature, this paper will not repeat the calculations of fractal dimensions. The intricate distribution of fractures in ultra-low permeability tight gas reservoirs is complex and fractal. Therefore, it is essential to integrate the fractal characteristics of fractures when formulating a credible and effective seepage model tailored for ultra-low permeability tight gas reservoirs.
Ultra-low permeability tight gas reservoirs have unique migration mechanisms that distinguish them from conventional reservoirs. These reservoirs occur in the matrix pores of low permeability tight formations, primarily in an adsorbed state. Gas flow has negligible relevance in nano pores, and the dynamics are dominated by Knudsen flow. Therefore, it is necessary to have a comprehensive understanding that includes not only the adsorption and desorption processes within the pore matrix but also the incorporation of Knudsen diffusion and slip effects in the pores.
Gas storage within the pore spaces can take three distinct forms: free gas, adsorbed gas, and dissolved gas. The dissolved gas content in kerogen is typically negligible and can be excluded from consideration. Even in cases where dissolved gas is present, its diffusion quantity is extremely low, making its quantity insignificant. Therefore, this study has chosen to omit the dissolved gas content in kerogen from its considerations. The model’s underlying assumptions are as follows: The gas reservoir is fractured and has fractal dimensions Dm and Df. It is embedded within a three-dimensional Euclidean rock mass. The gas has low compressibility. Negligible gravitational and capillary pressures are present. The skin effect and the influence of pressure on permeability and porosity are taken into account.
Although the pores and fractures may undergo minor deformations under pressure, they still maintain their fractal characteristics. It is important to note the existence of both fracture and matrix pores, which reveals an inherent sensitivity to compressive stress coupled with fractal characteristics. Leveraging this understanding, the permeability and porosity of both the fracture and matrix pores can be aptly expressed as functions of pressure, drawing upon the seminal works of (Chang and Yortsos, 1990; Zhang et al., 2007).
For matrix pores Eqs 2, 3 are obtained:
For fracture Eqs 4, 5 are obtained:
Where: the lower corner ma and f represent pores and fracture respectively; Φ is the porosity, fractional; Φwe is effective porosity, fractional; k is permeability,mD; kam is the apparent permeability of matrix pores,mD; m is pseudo pressure, MPa; Dm and θm are fractal dimension and fractal exponent of matrix pores respectively, dimensionless; Df and θf are fractal dimension and fractal exponent of fracture respectively, dimensionless; rmR is the radial radius of matrix pore, m; rwe is effective well radius, m; α1 is matrix and fracture permeability modulus; 1/MPa; α2 is matrix and fractured porosity modulus, 1/MPa.
When the formation pressure drops to the critical desorption pressure, the adsorbed gas on the surface of matrix particles starts to desorb, and the desorbed gas carries into the matrix pores and cracks to become free gas, meanwhile, in the process of reservoir energy attenuation, the thermodynamic equilibrium changes, and the gas is desorbed from the surface of the casein into the matrix at the same time, the dissolved gas in the pores of the casein diffuses to the surface. Under the action of pressure difference, the gas diffuses into the fracture network through matrix pores and fractures. Finally, under the action of flow potential, the dense gas flows to the wellbore through the fracture network system. Schematic diagrams of seepage processes in low-permeability tight gas reservoirs can be referenced drawing on chen (Chen et al., 2015).
Low permeability tight reservoir matrices typically exhibit permeability within the Darcy range. The role of Darcy flow in matrix pores is somewhat marginalized. According to a comprehensive study by Ozkan (Ozkan et al., 2009), gas flow within these low permeability tight pores is predominantly governed by slippage and Knudsen diffusion mechanisms. Numerous international scholars support this perspective, which acknowledges the presence of nano-scale pores in low permeability tight gas reservoirs. This renders the slippage effect significant, and the migration of gases in ultra-low permeability tight gas reservoirs can be interpreted as a combined effect of slip flow and Knudsen diffusion. The velocity of gas flow in the pore of the matrix is defined as the sum of the Knudsen diffusion velocity and the slip velocity we can define vma as Eq. 6:
Formula: vma is the velocity of gas flow in matrix, m/s; vkma is the Knudsen diffusion velocity, m/s; vs is the slip velocity, m/s.
Utilizing the diffusion flux parameters outlined by F (Javadpour, 2009), expressions for vkma and vs can be obtained as shown in Eq. 7:
Formula: μg is gas viscosity, mpa. s, F is slippage coefficient, dimensionless; Dk is Knudsen diffusion coefficient, m2/s; ρg is gas density, kg/m3; pma is matrix pore pressure, MPa. Among them, slip coefficient F (Brown et al., 1946) and Knudsen diffusivity coefficient Dk are defined as shown in Eqs 8, 9:
Formula: f is the fraction of gas molecules colliding with the pore walls by diffusion, dimensionless; pavg is the mean pressure, MPa; R is the gas constant, 0.008314 MPa⋅m3/(kmol⋅K); T is the absolute stability of the gas, K; Mg is the molar mass of the gas, kg/kmol.
Gas flow within the fissures of gas reservoirs adheres to Darcy’s law we can get Eq. 10:
Formula: vf is the velocity of gas flow in fracture, m/s; pf is fracture pressure, MPa; kf is fracture permeability, mD.
By defining rm as the radial radius of a cylindrical segment and examining an infinitesimal section, Δr, we place a unit at the outer boundary of a cylinder with radius r. The gas migration is considered a result of slipstream flow and Knudsen flow, and the mass conservation equation for seepage in ultra-low permeability gas reservoir bedrock is derived from the continuity equation:
Where: A represents the surface area of the cylinder, m2; ∆V denotes the volume of fluid flowing through the micro-element in ∆t, m3, ∆t denotes the time flowing through the micro-element, second.
It is important to note that Eq. 11 does not include the adsorption term, which is a significant factor in the flow dynamics of ultra-low permeability tight gas reservoirs. Assuming that gas adsorption and desorption follow Langmuir’s isothermal adsorption law, the amount of adsorbed gas is affected by pressure and adsorptive conditions, including organic components such as kerogen in low-permeability tight formations (Sondergeld et al., 2010). The mathematical expressions for these phenomena are as shown in Eqs 12, 13:
Where: ρbi is the density of porous rock under the initial formation pressure, kg/m3; qd is the mass of adsorbed gas in the solid volume of the unit, kg/m3; VL is the volume of Langmuir gas, m3/kg; ρgsc is the density of ultra-low permeability gas reservoir under the standard state, m3/kg; pL is Langmuir gas pressure, MPa; pi is initial pressure, MPa; SVk is the kerogen surface, 1/m; q is the adsorbed gas volume per unit area, kg/m2.
Advanced imaging techniques can be used to estimate the specific surface of kerogen, which is a pivotal parameter in ultra-low permeability gas reservoir pore scales (Ambrose et al., 2011). Additionally, the total organic carbon (TOC) content can be approximated by assuming a uniform kerogen thickness (hk) and using the following relation, as suggested by (Roy et al., 2003) we can get Eq. 14:
εTOC is the total organic carbon content, decimal fraction; hk is kerogen average thickness, m.
By incorporating the desorption increment from Eq. 13 into the material balance Eq. 11, and considering the impact of slipstream flow, Knudsen diffusion, and gas adsorption on pore surfaces at r = rmR, we can derive the continuity Eq. 15 for matrix porosity.
z is the gas deviation factor.
Ultra-low permeability tight gas reservoirs often have complex fracture networks due to the expansion of high-pressure gas phases and compressive and shear stresses during tectonic movements. This classification makes them naturally fractured gas reservoirs, then we can get Eq. 16.
The term q2 represents the mass flow rate per unit volume from matrix pores to the fractures we can define q2 as Eq. 17:
where q2 is the mass source, kg/(m3⋅s); qma symbolizes the discharge volume flow from matrix pores; rmR is the radial matrix radius, m; vma is the matrix flow rate, m/s; Ama is the cross-sectional area of flow through the matrix, m2; Vma is the matrix pore volume m3.
To simplify the model, the following variables are introduced:
Table 1 above
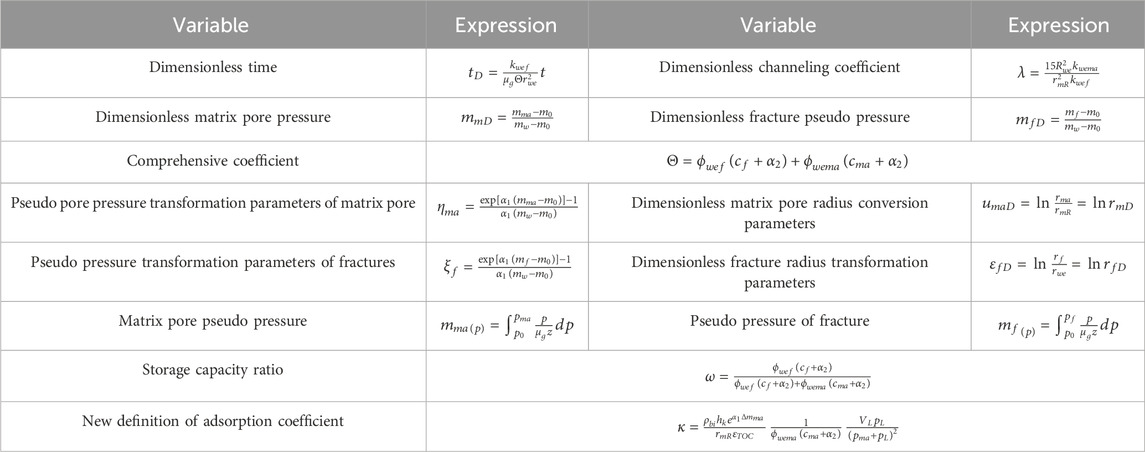
TABLE 1. Definition parameter.
Model Solutions Dma-θma-3 = βma and incorporating dimensionless quantities alongside expressions for fractal porosity and permeability, Eq. 15 undergoes a transformation into a pseudo-pressure form, as illustrated in Eq. 18.
Empirical investigations into low-permeability tight formations reveal a complex pore structure, which becomes more intricate as the fractal dimension approaches 3. The use of the zero-order approximation method for Laplace transformation in pull space allows for the introduction of dimensionless quantities, simplifying Eq. 18. For detailed derivations, please refer to Supplementary Appendix SB. By substituting umD = lnrmD into the transport equation for Bedrock, as represented by Supplementary Equation SB9, we obtain Eq. 19. The function f1(s) represents the transport function of the matrix pore.
Where
Among:vm = βma/(βma-2), In accordance with the derivative property of the Bessel function as shown in Eqs 21, 22.
Eq. 20 is derived as follows:
And as
To further simplify the model, let Df -θf −3 = βf, and according to the Eqs 23, 24, we get the Eq. 25:
With εfD = lnRfD, the transformation relations are encapsulated in Eq. 26. Given the negligible moduli in this study and assuming α1 = α2, Eq. 27 follows.
Acknowledging the complicated nature of ultra-low permeability gas reservoir pores, and recognizing that the fractal dimension of fractures becomes increasingly complex as it approaches 3, we approximate βf ≈ -θf. This zero order approximation further simplifies the fracture transport equation, as seen in Eq. 28.
The solution, using generalised Bessel functions, is given by Eq. 29:
Where vf = βf/(βf-2), and where is the transport function of fracture:
Evidence from detailed microseismic monitoring of horizontally fractured wells in tight gas reservoirs with exceptionally low permeability reveals the intricate nature of the fracture patterns by Fan et al. (2010). The complexity is mainly due to the emergence of branch fractures from the main artificial fracture during the stimulation phase. In addition, there is a pronounced tendency for the fracturing fluid to navigate along existing natural fractures, resulting in the reactivation or widening of previously sealed natural fractures. This process ultimately results in an intricate network of fractures, creating a noticeable disparity in permeability within areas that remain unfractured.
We have meticulously crafted a pressure response equation for wells in ultra-low permeability tight gas reservoirs. This has been achieved by ingeniously intertwining the continuous point source function, characterized by its unwavering intensity, with the time-honoured principle of superposition. By assuming the instantaneous release of a finite volume of gas from the source point at the very beginning of time (t = 0), we ensure the equivalence of the cumulative flow volume at the microsphere surface to the volume of gas instantaneously released from the point source.
Where Bg is the gas volume coefficient, dimensionless; Tsc is the temperature at standard conditions, K; psc is the pressure at standard conditions, MPa; T is the temperature, K;
Then can get:
Eq. 32 graciously unfolds a Laplace spatial solution, detailing the pressure distribution emanating from an instantaneous point source at the origin, subsequently defined with precision in Eq. 33. The pressure profile within tight gas reservoirs is inherently linked to the incessant outflow of fluid, characterised by a rate q, over the time interval from 0 to t. Applying the superposition principle to the instantaneous point source solution over the time interval (0, t) yields the continuous point source solution. In cases of perpetual fluid discharge from the point source, this superposition principle gives us the solution shown in Eq. 34.
Convolution property
The Laplace transformation can be obtained as shown in Eq. 36:
Among them:
It is assumed that all fractures are infinite flow diversion fractures. From the continuous line source, it is known that the conversion pressure drop generated by the continuous line source in the ultra-low permeability tight gas reservoir with lateral infinite upper and lower boundary is in Laplace space.
Where:
As shown in Figure 3, after fracturing, m fractures are formed and each fracture is divided into n units of equal length. Each fracture is divided into 2n units, and m vertical fractures can be discretised into 2n×m units. The angle of fracture formation between the fracture of i (1 ≤ i ≤ m) and the horizontal well is αi, and the coordinates are (xi, 0), then the coordinates of any point on the fracture meet we can get Eq. 38:
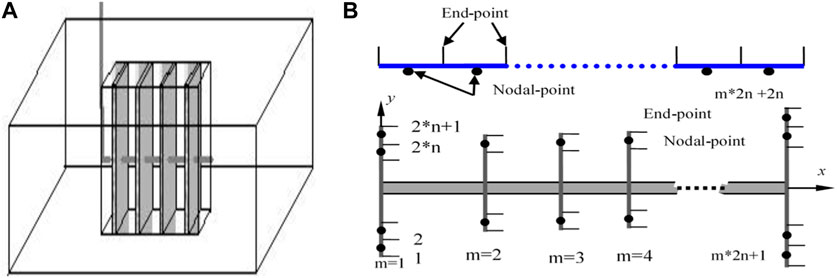
FIGURE 3. Multilevel fracturing horizontal well plane sketch map and fracture element discrete diagram. (A) is a schematic diagram of a multi-stage fractured horizontal well; (B) is fracture element discrete diagram.
Assuming that the linear density flux of the discrete element is qij, then the method of integrating the line source on the curve and the coordinated relationship of Eqs 39, 40 into only the integral of ywi as well as the dimensionless transformation are used to obtain the Laplace transformation of Eq. 37 of the jth discrete element on the fracture at the fracture i at the point (x, y) we can derive the Eq. 41.
Among them:
Based on the superposition principle of potential, the expression of the converted pseudo pressure drop of the discrete element nodes
The seepage resistance of the ultra-low permeability gas reservoir in the formation is much greater than that in the fracture. At the same time, this paper ignores the pressure loss caused by the seepage of the ultra-low permeability gas reservoir in the fracture. Therefore, the gas flow in the fracture can be considered as an infinite diversion form:
Since k and v can have different values, 2n×m equations can be obtained. The total production relationship in the fractured horizontal well is considered as follows:
Among them, the dimensionless length of element (i, j) is recorded as ΔLfDij = ΔLfij/L, which is equal when considering the equal spacing of the fracture. The Eqs 43, 44 can represent the required solution.
Among them: Ai*j, k*v The expression of the pseudo pressure loss coefficient of the unit strength continuous line source on j discrete element of section i at the centre of V discrete element of fracture K at the fracture element of fracture is expressed as Eq. 46:
(Van Everdingen, 1953) referred to the influence of wellbore storage and skin effect as shown in Eq. 47:
Among them: ψwD and‾ψwDn are the dimensionless bottom pseudo pressure expressions under the Laplace space considering and without considering the epidermis and well storage time; s is Laplace time variable, and Sskin is the skin factor, ‾CD is the dimensionless well storage coefficient.
To facilitate the computational process, we assume that the fractures are perpendicular to the horizontal wellbore and are uniformly distributed. Under these conditions, Eq. 48 can be used to generate the dimensionless unsteady pressure and pressure derivative curves for multi-fractured horizontal wells in ultra-low permeability tight gas reservoirs characterised by matrix and pore fractal features. This is achieved by implementing the Stehfest numerical inversion method.
As shown in Figure 4, the seepage dynamics within ultra-low permeability tight gas reservoirs can be categorically divided into several distinct phases. The initial phase, characterised as the wellbore storage stage (stage 1), exhibits a linear trajectory in both the pressure and pressure derivative curves, each with a slope of unity. This is immediately followed by a transition to transient flow, the wellbore reservoir flow phase, which is manifested as a pronounced hump (stage 2) on the pressure derivative plot.
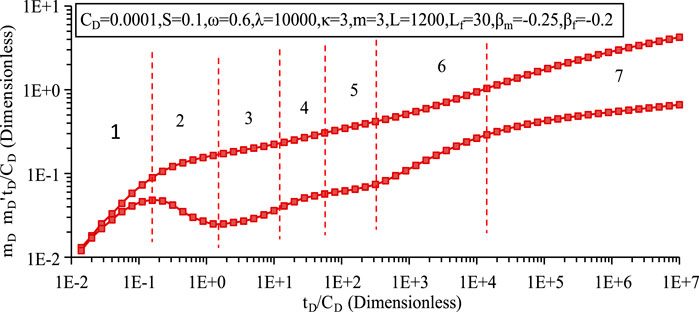
FIGURE 4. Stages of typical flow curves of fractal ultra-low permeability tight gas reservoirs.
In the subsequent early linear flow stage (stage 3), the pressure derivative curve again assumes a linear trend, this time with a halved slope of 0.5. This indicates that the fractures have assumed the role of primary conduits for gas migration, with gas flow occurring orthogonally to the fracture plane. Figure 7 illustrates that the manifestation of this stage is closely related to the gas flow mechanism, in particular slippage and diffusion phenomena. An increased combined coefficient of slippage and diffusion flow tends to alleviate the “concave” configuration observed between stages 2 and 3, with the effect on gas deliverability being linked to the overall coefficient.
Stage 4 serves as a transition phase, linking the early linear flow to the mid-term quasi radial flow. This is followed by Stage 5, which emerges as a mid-term quasi radial flow encompassing each fracture. This phase is distinguished by a horizontal trajectory on the pressure derivative curve, its value on the same curve approximating 1/2 m, where m is the number of fractures. The interaction between fractures heralds the onset of linear flow (stage 6), characterised by the axial movement of fluids and a slope of 0.5 on the pressure derivative curve corresponding to this flow stage.
Culminating in a later stage of integrated pseudo-radial flow (stage 7), the system stabilises to a horizontal pressure line, a characteristic typical of conventional gas reservoirs, normalised to 0.5 (as shown in Figure 11, assuming alpha m = 0, beta f = 0 and no fractal characteristics). The deviation of the pressure derivative value from 0.5 in this study is attributed to the fractal dimension, shedding light on the complex interplay between reservoir properties and flow dynamics.
The pressure derivative is a crucial parameter in well test analysis, reflecting the rate of change of pressure with respect to time. It is instrumental in identifying flow regimes and reservoir properties. The pressure derivative is calculated by dp/d (logt).
The following analysis carefully examines the sensitivity of gas reservoir and fracture properties to the flow stages outlined above. It is important to emphasise that the gas reservoir properties, coupled with the fracture defining parameters, play a pivotal role in determining the flow dynamics within ultra-low permeability tight gas reservoirs. This results in the non-uniform manifestation of each of the previously described flow patterns in different fractured horizontal wells within such reservoirs.
Figures 5, 6 show the pressure curves for ultra-low permeability tight gas reservoirs, illustrating the effects of matrix fractal coefficient and fracture fractal coefficient, respectively. A seepage model for fractured ultra-low permeability tight gas reservoirs has been established, which shows that the fractal dimension of the matrix pores has a significant influence on the seepage process, especially in its middle and late stages. Conversely, the shape of the fractures mainly affects the early to mid stages of seepage, due to the prevalence of internal flow within the fractures during these early stages. Furthermore, an increased fractal coefficient indicates an increased degree of fractality, which is indicative of increased reservoir heterogeneity, intricate pore and fracture structures and complex fracture networks. This complexity leads to faster pressure decay and an upward shift in the pressure derivative curve.
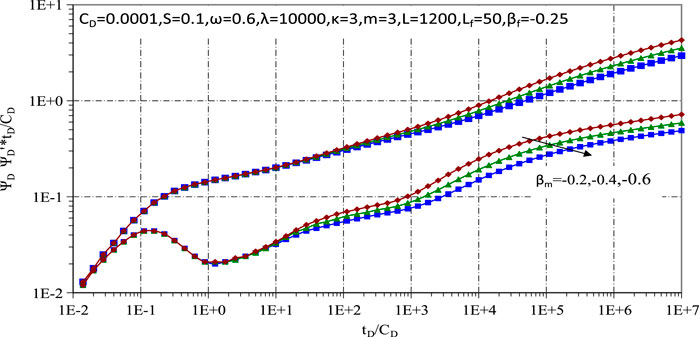
FIGURE 5. Influence of matrix fractal coefficient.
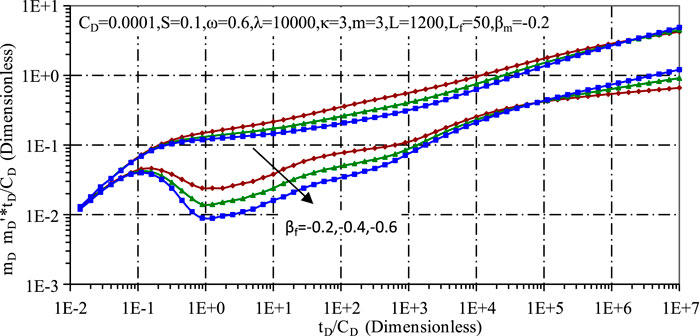
FIGURE 6. Influence of fractal coefficient.
Figure 7 illustrates the pressure-dynamic curve shaped by the migration mechanisms—slip and diffusion—within ultra-low permeability tight gas reservoirs. The slip and diffusion coefficients are integral in defining the gas migration mechanisms and have a significant impact on the early and mid-flow stages as they influence the gas supply capacity. A lower overall coefficient correlates with a downward trajectory of the pressure derivative curve.
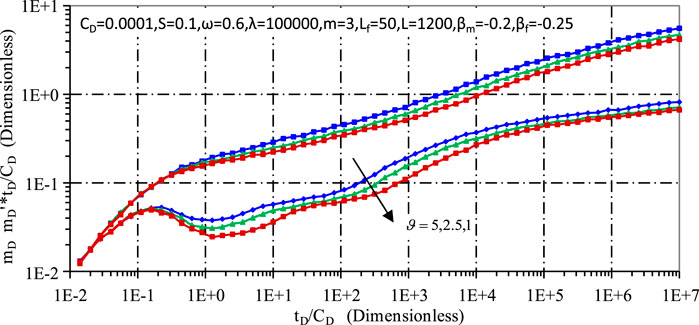
FIGURE 7. Influence of slippage and diffusion coefficient.
Figure 8 provides an insight into the pressure dynamics under the influence of the adsorption coefficient in ultra-low permeability tight gas reservoirs. It can be seen that the adsorption coefficient affects the entire flow stage, with larger coefficients corresponding to higher gas adsorption levels, increased gas supply capacity, a more gradual pressure decline and a lower position on the pressure derivative curve.
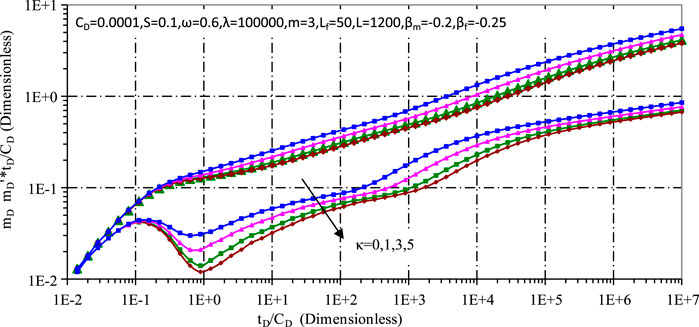
FIGURE 8. Influence of adsorption coefficient.
Figures 9, 10 examine the effects of fracture number and fracture length on the dynamic pressure, respectively. It can be seen that an increase in either parameter significantly affects the transient pressure and pressure derivatives during the early and mid stages, due to the increased permeability near the wellbore resulting from the increased hydraulic fracturing. A longer fracture length further increases the permeability of the reservoir, resulting in a lower pressure drop near the wellbore. However, these parameters show minimal sensitivity in the late pressure stages, as the effects of hydraulic fracturing are predominantly felt in the early stages.
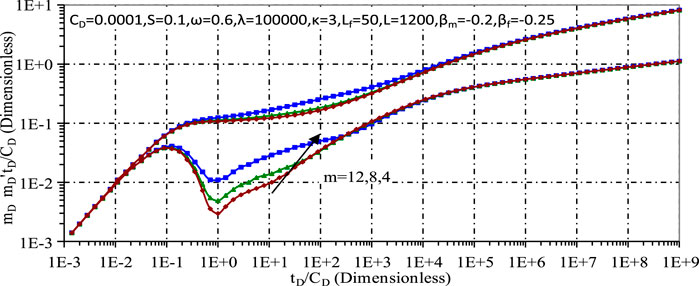
FIGURE 9. Influence of fracture number on curve.
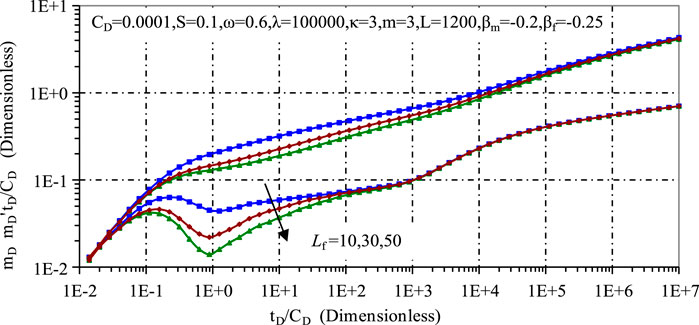
FIGURE 10. Effect of fracture length on curves.
Figures 11, 12 investigate the effects of the storage capacity ratio and the cross-flow coefficient respectively. Figure 11 shows that a smaller storage capacity ratio increases the gas storage capacity of the matrix, which slows down the pressure drop and forms a noticeable dip in the pressure derivative. In contrast, Figure 12 shows that a smaller λ results in shorter pore diffusion times and earlier breakthroughs, while a larger λ increases the ability of the matrix system to feed the fracture system, ultimately slowing the pressure drop.

FIGURE 11. Influence of storage capacity ratio on typical curve.
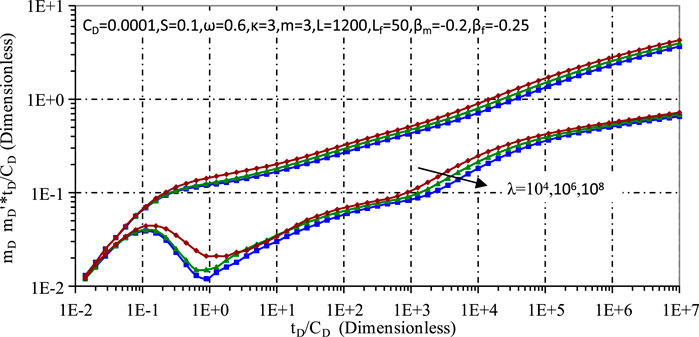
FIGURE 12. Influence of channeling coefficient on typical curve.
Finally, Figure 13 focuses on the effect of matrix and permeability modulus γD (previously referred to as α1) on pressure dynamics. This figure illustrates that an increase in the permeability modulus results in increased stress sensitivity, which accelerates the pressure drop and causes an upward shift in the pressure derivative curve.

FIGURE 13. Influence of permeability modulus on typical curve.
After a detailed analysis of the curve morphology and the factors influencing it, the characteristics of the curve and the reasons for its various changes become clearer. This understanding is crucial for better application in the interpretation and analysis of gas wells and provides a valuable reference for the accurate description of reserves in individual wells. For example, the D11 well underwent a fracturing modification in 2014 and started production in 2015. The basic data for interpretation of the well test include: shut-in time of 483 h, test layer depth of 2,155 m, well diameter of 0.1 m, formation temperature of 75°C, effective gas layer thickness of 26 m, porosity of 3.1% and horizontal well length of 900 m. Using the model discussed in this paper for fitting analysis, the resulting fitted double logarithmic plot (Figure 14) is as follows:
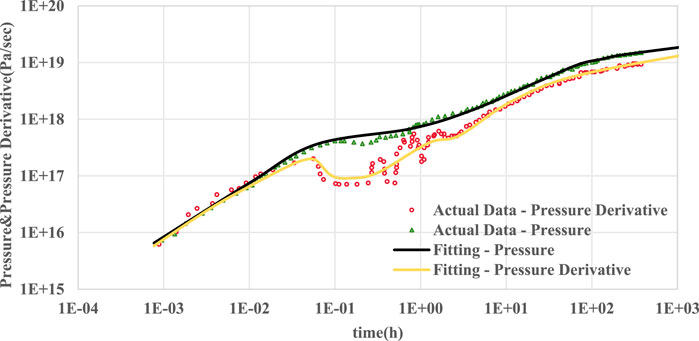
FIGURE 14. Comparison of actual data and predicted data fitting curve.
The fitting results show that the model calculations are in good agreement with the actual data, and the different flow stages are clearly defined, indicating that the interpretation model provided in this paper is reliable. According to the interpretation method of this paper, the extrapolated pressure of well D11 is 22.6 MPa, which is the normal pressure. The effective permeability is 1.6*10−3 mD, indicating ultra-low permeability. The total skin factor is −4.08, indicating effective matrix modification. The fracture half-length is about 30 m, the adsorption coefficient is 2.5, the storage ratio is 0.3 and the channeling coefficient is 105. In the initial stage of pressure recovery, as can be seen from the graph, the slope of this segment is 1, indicating the continuation flow stage, where the well pressure is not in equilibrium with the formation pressure and the well storage effect is the main influencing factor. During the transition stage, the interpreted fracture skin factor is greater than zero, indicating contamination in the fracture zone. Although the total flow capacity in the wellbore area increases, the fracture surface area is obstructed. The double logarithmic curve shows a significant concave, resulting in a downward trend in the derivative curve from the start of the transition phase to the linear flow phase of the hydraulic fracture. This is an indication of fracture skin damage, but does not affect the later seepage stage of the curve. As the pressure increases, the middle part of the curve shows the characteristics of the pressure and the half-slope of the pressure derivative, indicating that the pressure between the fracture and the matrix has equilibrated, resulting in a bi-linear flow from the hydraulic fracture to the formation. In the later stage, the fracture shows pseudo-radial flow, with a large pressure influence range for each fracture, and the curve tends to level off, indicating pseudo-radial flow. The interpretation results can provide a reference for development.
In this research, the fractal expression of the capillary pressure curve was meticulously applied to ultra-low permeability tight gas reservoirs and seamlessly integrated with mercury injection data to explore the fractal dimensions of low permeability tight gas reservoirs. We used rigorous experimental methods to reveal the intricate fractal characteristics of ultra-low permeability tight gas reservoirs. Following a deductive analytical approach, the fractal dimensions of these reservoirs were accurately calculated.
A ground-breaking transient pressure flow model specifically tailored to dual-fractured ultra-low permeability tight gas reservoirs was developed. This comprehensive model incorporates the dynamics of porous porosity together with the phenomena of diffusion, adsorption and desorption. It meticulously accounts for the fractal nature of both the matrix and fractures, while also addressing the critical aspect of compressive stress sensitivity, thus providing a holistic solution for modelling ultra-low permeability tight gas reservoirs. Through advanced programming, a series of exemplary curve plots were generated to facilitate nuanced sensitivity analysis. The insights gained from this analysis revealed that the fractal dimensions of the matrix and fractures have a differential effect on the dynamic pressure profiles at different flow stages. In addition, the morphology of the pressure curve was found to be significantly influenced by factors such as slip and diffusion transport mechanisms, the adsorption coefficient and the number and length of fractures, in stark contrast to the behaviour observed in conventional sandstone reservoirs. The ultra-low permeability tight gas reservoirs are characterized by their nanoscale pore diameters, multiple storage modes, complex gas flow patterns within nanoscale pores, and the variety of parameters governing flow in these low permeability tight gas reservoirs.
The newly introduced adsorption coefficient in our model stands out as a comprehensive parameter that encapsulates a number of critical factors including TOC content, pressure, effective porosity, Langmuir volume, Langmuir pressure, pore size and modulus. Collectively, these factors play a critical role in determining the volume of gas adsorbed, which is consistent with our empirical understanding of actual tight gas reservoirs. Furthermore, this comprehensive parameterisation establishes an indirect but robust link between tight gas reservoirs and their geological characteristics, paving the way for a multi-dimensional evaluation approach to our model. This not only enhances our reservoir understanding, but also leads us towards more holistic and insightful reservoir evaluations in future research efforts.
The raw data supporting the conclusion of this article will be made available by the authors, without undue reservation.
KW: Conceptualization, Investigation, Methodology, Validation, Writing–original draft, Writing–review and editing. LL: Conceptualization, Supervision, Writing–review and editing. MX: Supervision, Writing–review and editing. JD: Supervision, Writing–review and editing. SF: Supervision, Writing–review and editing. ML: Supervision, Validation, Writing–review and editing. RH: Validation, Visualization, Writing–original draft, Writing–review and editing. SL: Visualization, Writing–review and editing.
The author(s) declare financial support was received for the research, authorship, and/or publication of this article. This research was funded by China National Offshore Oil Corporation (CNOOC) Major Science and Technology Project in the 14th Five-Year Plan (Grant No. CNOOC-KJGG2022-0701), and CNOOC (China) Limited Comprehensive Research Project “Key Technology Research for Production Increase of 20 Million Tons in Eastern South China Sea Oilfields” (Grant No. CNOOC-KJ135 ZDXM37SZ03SZ).
The authors gratefully acknowledge the support of Key Laboratory of Oil and Gas Reservoir Geology and Exploitation of Southwest Petroleum University and Nanhai East Petroleum Research Institute. The authors also thank the reviewers for their valuable comments.
Authors KW, LL, MX, JD, SF, RH, and SL were employed by Shenzhen Branch of CNOOC Limited.
The authors declare that this study received funding from Shenzhen Branch of CNOOC Limited. The funder was not involved in the study design, collection, analysis, interpretation of data, the writing of this article, or the decision to submit it for publication.
The remaining author declares that the research was conducted in the absence of any commercial or financial relationships that could be construed as a potential conflict of interest.
All claims expressed in this article are solely those of the authors and do not necessarily represent those of their affiliated organizations, or those of the publisher, the editors and the reviewers. Any product that may be evaluated in this article, or claim that may be made by its manufacturer, is not guaranteed or endorsed by the publisher.
The Supplementary Material for this article can be found online at: https://www.frontiersin.org/articles/10.3389/fenrg.2024.1356183/full#supplementary-material
Adler, P. M., and Thovert, J.-F. (1993). Fractal porous media. Transp: Porous Media, 41–78. doi:10.1007/BF00613270
Aguilera, R. F., Ramirez, J. F., Ortega, C., and Aguilera, R. (2012). “A variable shape distribution (VSD) model for characterization of pore throat radii, drill cuttings, fracture apertures and petrophysical properties in tight, shale and conventional reservoirs,” in All days (Perth, Australia: SPE). doi:10.2118/158808-MS
Alfaro, R. (2004). Fractal dimension analysis of shales using X-ray computer tomography. Available at: https://www.semanticscholar.org/paper/Fractal-dimension-analysis-of-shales-using-X-ray-Alfaro/b21e79975396c3023ab63dc197b777d83511af7c (Accessed November 15, 2023).
Ambrose, R. J., Hartman, R. C., Diaz-Campos, M., Akkutlu, I. Y., and Sondergeld, C. H. (2011). Shale gas-in-place calculations Part I: new pore-scale considerations. SPE J. 17, 219–229. doi:10.2118/131772-PA
Barton, C. C., and Larsen, E. (1985). Fractal geometry of two-dimensional fracture networks at Yucca Mountain, southwestern Nevada: proceedings. Off. Sci. Tech. Inf. Tech. Rep. Available at: http://www.researchgate.net/publication/239866920_Fractal_geometry_of_two-dimensional_fracture_networks_at_Yucca_Mountain_southwestern_Nevada_proceedings [Accessed November 15, 2023].
Brown, G. P., DiNardo, A., Cheng, G. K., and Sherwood, T. K. (1946). The flow of gases in pipes at low pressures. J. Appl. Phys. 17, 802–813. doi:10.1063/1.1707647
Chang, J., and Yortsos, Y. C. (1990). Pressure-transient analysis of fractal reservoirs. SPE Form. Eval. 5, 31–38. doi:10.2118/18170-PA
Chelidze, T., and Gueguen, Y. (1990). Evidence of fractal fracture. Int. J. Rock Mech. Min. Sci. Geomech. Abstr. 27, 223–225. doi:10.1016/0148-9062(90)94332-N
Chen, F., Duan, Y., Wang, K., Li, X., and Liao, Y. (2015). A novel pressure transient response model considering multiple migration mechanisms in shale gas reservoir. J. Nat. Gas. Sci. Eng. 22, 321–334. doi:10.1016/j.jngse.2014.12.010
Deng, J., Zhu, W., Liu, J., Zhang, Z., Ma, Q., Zhang, M., et al. (2013). Productivity prediction model of shale gas considering stress sensitivity. Nat. Gas. Geosci. 24, 456–460. doi:10.11764/j.issn.1672-1926.2013.03.456
Fan, L., Thompson, J. W., and Robinson, J. R. (2010). “Understanding gas production mechanism and effectiveness of well stimulation in the haynesville shale through reservoir simulation,” in All days (Calgary, Alberta, Canada: SPE). doi:10.2118/136696-MS
Fang, J. (2012). Structure characteristics and accumulation significance of nanopores in Longmaxi shale gas reservoir in the southern Sichuan Basin. J. China Coal Soc. Available at: https://www.semanticscholar.org/paper/Structure-characteristics-and-accumulation-of-in-in-Junhua/994c05d8cdb2fbbdc3b0e4fab76301af13419888 (Accessed November 15, 2023).
Giri, A., Tarafdar, S., Gouze, P., and Dutta, T. (2012). Fractal pore structure of sedimentary rocks: simulation in 2-d using a relaxed bidisperse ballistic deposition model. J. Appl. Geophys. 87, 40–45. doi:10.1016/j.jappgeo.2012.09.002
Huang, X. (2014). A mathematical model for water breakthrough in fractured bottom-water gas reservoir based on fractal geometry. Available at: https://www.semanticscholar.org/paper/A-mathematical-model-for-water-breakthrough-in-gas-Xiaoh/87ade3954ae249a6247f767d06a2f405ccc3d6fb (Accessed November 15, 2023).
Javadpour, F. (2009). Nanopores and apparent permeability of gas flow in mudrocks (shales and siltstone). J. Can. Pet. Technol. 48, 16–21. doi:10.2118/09-08-16-DA
Krohn, C. E. (1988). Fractal measurements of sandstones, shales, and carbonates. J. Geophys. Res. Solid Earth 93, 3297–3305. doi:10.1029/JB093iB04p03297
Mandelbrot, B. B., and Wheeler, J. A. (1983). The fractal geometry of nature. Am. J. Phys. 51, 286–287. doi:10.1119/1.13295
Ozkan, E., Brown, M., Raghavan, R., and Kazemi, H. (2009). “Comparison of fractured horizontal-well performance in conventional and unconventional reservoirs,” in All days (San Jose, California: SPE). doi:10.2118/121290-MS
Roy, S., Raju, R., Chuang, H. F., Cruden, B. A., and Meyyappan, M. (2003). Modeling gas flow through microchannels and nanopores. J. Appl. Phys. 93, 4870–4879. doi:10.1063/1.1559936
Sammis, C. G., and Ashby, M. F. (1986). The failure of brittle porous solids under compressive stress states. Acta Metall. 34, 511–526. doi:10.1016/0001-6160(86)90087-8
Sondergeld, C. H., Ambrose, R. J., Rai, C. S., and Moncrieff, J. (2010). “Micro-structural studies of gas shales,” in All days (Pittsburgh, Pennsylvania, USA: SPE). doi:10.2118/131771-MS
Stehfest, H. (1970). Algorithm 368: numerical inversion of Laplace transforms [D5]. Commun. ACM 13, 47–49. doi:10.1145/361953.361969
Van Everdingen, A. F. (1953). The skin effect and its influence on the productive capacity of a well. J. Pet. Technol. 5, 171–176. doi:10.2118/203-G
Vidales, A. M., and Miranda, E. N. (1996). Fractal porous media: relations between macroscopic properties. Chaos Solit. Fractals 7, 1365–1369. doi:10.1016/0960-0779(96)00015-X
Yang, F., Ning, Z., and Liu, H. (2014). Fractal characteristics of shales from a shale gas reservoir in the Sichuan Basin, China. Fuel 115, 378–384. doi:10.1016/j.fuel.2013.07.040
Yu, B., and Li, J. (2001). Some fractal characters of porous media. Fractals 09, 365–372. doi:10.1142/S0218348X01000804
Zhang, L., Zhang, J., and Xu, B. (2007). A nonlinear seepage flow model for deformable double media fractal gas reservoirs. Chin. J. Comput. Phys. 24, 90.
Zhang, L.-Z. (2008). A fractal model for gas permeation through porous membranes. Int. J. Heat. Mass Transf. 51, 5288–5295. doi:10.1016/j.ijheatmasstransfer.2008.03.008
Zhang, T. (2010). Application of fractal dimension of micro-pore structure. J. Daqing Pet. Inst. Available at: https://www.semanticscholar.org/paper/Application-of-fractal-dimension-of-micro-pore-Ke/048d4ce7a653d22982f268cd8675afeba1c4fc83 (Accessed November 15, 2023).
Keywords: ultra-low permeability gas reservoir, characterization of fracture complexity, stress sensitivity, pressure dynamics, multi-stage fracturing horizontal wells
Citation: Wang K, Li L, Xie M, Dai J, Feng S, Li M, Huang R and Liu S (2024) An advanced fractal-based well testing model capturing fracture complexity in low permeability tight gas reservoirs. Front. Energy Res. 12:1356183. doi: 10.3389/fenrg.2024.1356183
Received: 15 December 2023; Accepted: 12 January 2024;
Published: 29 January 2024.
Edited by:
Yishan Liu, Research Institute of Petroleum Exploration and Development (RIPED), ChinaReviewed by:
Feng Yang, China University of Geosciences Wuhan, ChinaCopyright © 2024 Wang, Li, Xie, Dai, Feng, Li, Huang and Liu. This is an open-access article distributed under the terms of the Creative Commons Attribution License (CC BY). The use, distribution or reproduction in other forums is permitted, provided the original author(s) and the copyright owner(s) are credited and that the original publication in this journal is cited, in accordance with accepted academic practice. No use, distribution or reproduction is permitted which does not comply with these terms.
*Correspondence: Ruijie Huang, aHVhbmdyajEwQGNub29jLmNvbS5jbg==
Disclaimer: All claims expressed in this article are solely those of the authors and do not necessarily represent those of their affiliated organizations, or those of the publisher, the editors and the reviewers. Any product that may be evaluated in this article or claim that may be made by its manufacturer is not guaranteed or endorsed by the publisher.
Research integrity at Frontiers
Learn more about the work of our research integrity team to safeguard the quality of each article we publish.