- 1Economic and Technical Research Institute of State Grid Shanxi Electric Power Company, Taiyuan, China
- 2School of Electrical and Electronic Engineering, North China Electric Power University, Beijing, China
- 3Yingda Chang’an Insurance Brokers Co., LTD, Taiyuan, China
- 4State Grid Shanxi Electric Power Ultra High Voltage Substation Branch, Taiyuan, China
- 5Construction Company State Grid Shanxi Electric Power Company, Xi’An, China
With the continuous construction of high-voltage direct-current (HVDC) transmission projects, higher requirements are placed on the frequency security of the regional power systems. In order to ensure the frequency security of regional power systems, this paper proposes a transient frequency analytical method considering the emergency frequency control (EFC). Firstly, the aggregated system frequency response (SFR) model is constructed by reducing the order of the generator governor equation, the EFC equation, and the load model equation. Then, based on the aggregation model, the analytical solution of the transient frequency nadir of the regional power system is derived. The model can quickly and accurately calculate the transient frequency nadir of the regional power system considering EFC after the HVDC block fault. Finally, based on an actual regional power system model, the accuracy and applicability of the proposed method under HVDC block fault are verified.
1 Introduction
With the rapid construction of high-voltage direct-current (HVDC) system, China has formed regional power systems with multi-infeed HVDC 1. (Wang et al., 2024; Li et al., 2020). Due to the complex coupling relationship between HVDCs and AC systems, system frequency security is a serious challenge for such systems, especially after the HVDC block fault in the regional power system (Hoke et al., 2024; Shen et al., 2023; Yu et al., 2022).
The HVDC system can transmit a large amount of electricity to the regional power system to meet the power demand. However, once the blocking fault occurs in the HVDC system, the large power imbalances will lead to serious frequency deviation and even threaten the security operation of the regional power system (Du and Li, 2021). On the other hand, the rapid development of new energy power generation such as wind turbines and photovoltaics in regional power grids has led to a continuous decline in the capacity of local thermal power units. This is not conducive to the inertia response of the local power grid and reduces the frequency response capability of the system (Hou et al., 2020; Denholm et al., 2020). For example, in 2015, a HVDC blocking in China caused the frequency of the East China power grid to drop to 49.557 Hz (Zhang et al., 2019). In the 2018 Brazilian blackout fault, the Belo Monte HVDC block caused a power shortage of 4000 MW in the southern power system, and the transient frequency nadir reached 58.44 Hz (Haes Alhelou et al., 2019).
Frequency is an important index to reflect the operation status of the power system (Shi et al., 2023). When the system has a large power shortage due to sudden disturbances, the system frequency will decrease significantly, which seriously threatens the security and stable operation of the power system. Therefore, it is urgent to quickly analyze the transient frequency dynamics after large disturbances to facilitate the formulation of corresponding EFC strategies and improve frequency security.
At present, the research methods of power system transient frequency analysis are mainly based on time-domain simulation, machine learning, wide-area measurement data, and SFR model (Anderson, and Mirheydar, 1990; Shaw and Kumar Jena, 2021; Liu et al., 2020; Xie et al., 2024; Son et al., 2024). The time-domain simulation method can take into ac-count the detailed model of the power system, which has high calculation accuracy but takes a long time. Son et al. (2024) proposed the definition and formalization of the frequency nadir index (FNI) by identifying the linear characteristics of inertia, frequency regulating reserve space (FRRS), and governor free (G/F) reserve in relation to frequency nadir, particularly under assumed contingencies such as generator dropout and sudden load fluctuation. In Larsson (2005), the active power shortage of the power system is estimated by using the pre-disturbance grid data provided by the wide-area measurement system. Then, the steady-state frequency after the disturbance is predicted based on power shortage. This method considers the load characteristics but ignores the influence of network loss on the algorithm. In the research of model-based frequency prediction method, Ahmadi and Ghasemi (2014) proposed a SFR model, which is used to analyze the frequency nadir after the fault, and the frequency security constraint is obtained by piecewise linearization. Shariati et al. (2023) established a practical medium-order multi-machine Extended System Frequency Response (ESFR) model that is applicable for the frequency study of large, complex power systems or an island portion due to sudden load disturbances or generator outages. In Acosta et al. (2020), the influence of spinning reserve capacity, static load model, and turbine governor is considered, and the transient frequency nadir is introduced into the formulation of the load shedding scheme, which improves the applicability of the SFR model. In summary, most of the above work is aimed at the application scenarios of AC power systems without considering the system transient frequency dynamics after HVDC blocking, which is difficult to directly apply to the regional power system with multi-infeed HVDC.
Considering that the HVDC system has the characteristics of highly controllable power and rapid control response, its corresponding control method can be used to adjust the transmission power to provide power support for the regional power system after the HVDC block fault (He, 2023). Under this background, this paper proposes a transient frequency analytical method for the regional power system considering the EFC. The main contributions are:
1) The basic control mode of the HVDC system is analyzed, and its control method participating in emergency frequency regulation is designed;
2) The multi-machine system frequency response (MM-SFR) model considering the EFC is constructed. Then, the aggregated system frequency response (ASFR) model is constructed by reducing the order of the generator governor equation, the EFC equation, and the load model equation. The model can quickly and accurately calculate the transient frequency nadir after disturbance;
3) The effectiveness and practicability of the proposed method are verified in the actual power system model. This method can accurately predict the transient SFR un-der different fault scenarios, and can quickly calculate the frequency nadir.
The rest of this paper is arranged as follows: Section 2 describes the control method of the HVDC system. In Section 3, the MM-SFR model considering EFC and the ASFR model are derived. Section 4 is the case study. Section 5 presents the conclusions.
2 HVDC control methods
2.1 HVDC basic control method
The constant current control and fixed extinction angle (γ) control are the basic methods of HVDC control (Feldman et al., 2013; Li et al., 2010). The constant current control of the rectifier side is shown in Figure 1. This control can keep the DC constant within the adjustment range of the trigger angle, αrec.
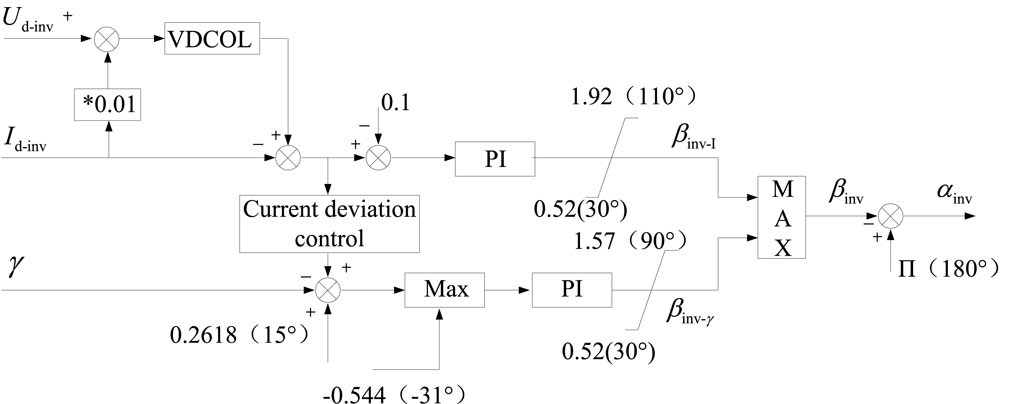
Figure 2 is the constant current and extinction angle control diagram of the inverter side, and the specific parameters are shown in Shi et al. (2018a). In addition, there are minimum trigger angle control, current deviation control, voltage-dependent current order limiters (VDCOL) control, constant power control, and other control methods in the HVDC system.
2.2 HVDC fast power control
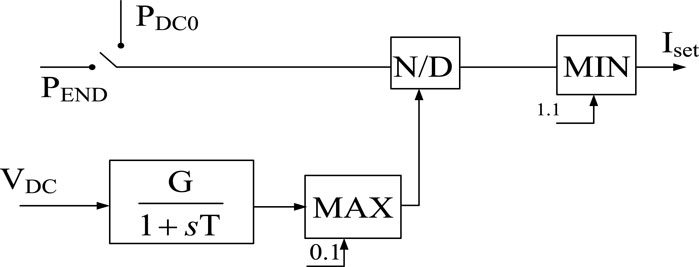
The HVDC system is usually used as an important control resource for EFC due to its advantages such as fast response and large controllable capacity. The HVDC transmission system can quickly increase or decrease the power for emergency support. The fast power control block diagram is shown in Figure 3.
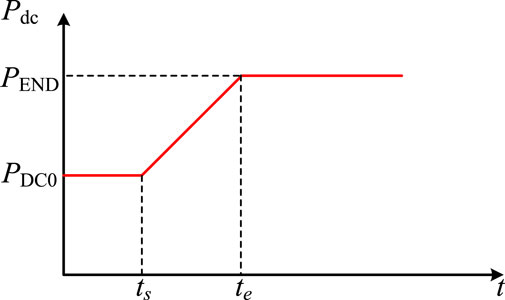
In Figure 3, PDC0 and PEND are the specified HVDC power references. The HVDC transmission power can be changed from PDC0 to PEND, and vice versa. Figure 4 is a schematic diagram of HVDC fast power control.
In Figure 4, ts, te, and VDC are the start time, end time of HVDC fast power control, and the measured DC voltage, respectively. When HVDC receives the action command at ts, it will carry out fast power control according to the reference value PEND. When the output power of HVDC reaches the reference value at time te, it can immediately make up for the system power shortage.
3 Transient frequency analytical method
3.1 SFR dynamics
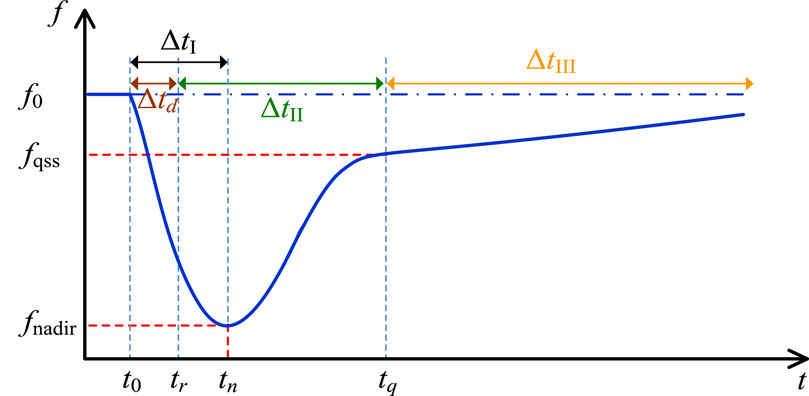
Power system frequency security is closely related to active power balance. When the HVDC block fault occurs in the multi-infeed regional power system, the active power balance between the generation and the load is broken, and the system will enter the frequency dynamic process. The SFR can be divided into inertial response (IR), primary frequency regulation (PFR), secondary frequency regulation (SFR) and tertiary frequency regulation (TFR) (Zhang et al., 2020).
1) IR. The inertial response takes effect immediately after the fault occurs. At this stage, due to the frequency regulation dead-band, the generator governor has not yet responded. The rate of change of frequency (RoCoF) is completely determined by the rotational inertia and is inversely proportional to its value. In low inertia systems, the system transient frequency will drop rapidly.
2) PFR. When the frequency deviation exceeds the dead-band, the generator governor responds and adjusts the output of the prime mover. The system enters the primary frequency regulation stage. During this stage, the transient frequency reaches its nadir, and then gradually returns to the quasi-steady-state frequency.
3) SFR. Since the PFR is a differential regulation, in order to restore the system frequency to the nominal value, the automatic generation control system will adjust the generator output to achieve indifference control. This process is called secondary frequency regulation.
4) TFR. Tertiary frequency regulation refers to economic dispatch. The purpose is to re-adjust the power generation output to obtain better quality power at the lowest power generation cost and to prepare for the next possible failure.
The typical transient frequency response is shown in Figure 5.
In Figure 5, Δtd is the frequency regulation dead-band stage, ΔtI is the IR stage, ΔtII is the PFR stage, ΔtIII is the SFR stage, t0 is the fault time, tr is the PFR response time, tn is the time when the transient frequency drops to the nadir, tq is the time when the system recovers to the quasi-steady-state frequency, fqss is the quasi-steady-state frequency, and fnadir is the frequency nadir.
3.2 Model construction
After a failure occurs, frequency changes vary in different regions due to spatiotemporal distribution characteristics. Therefore, the relevant researchers use the center of inertia (COI) frequency to represent the system frequency (Kundur, 1994; Tang et al., 2016). The COI frequency is defined as follows:
where i is the generator bus, fCOI is the COI frequency, fi is the frequency of bus i, and Hi is the inertia time constant of bus i. For simplicity, fCOI is denoted as f below.
The generator’s swing equation is:
where H is the inertia time constant, Δω = ω-ω0 is the rotor angular velocity deviation, ΔPm is the generator mechanical power deviation, and ΔPe is the generator electromagnetic power deviation. The frequency and power base values are:
After taking the above base value, the system frequency is equal to the rotor angular velocity:
Then the frequency dynamic expression of bus i is:
Accumulate the frequency dynamic expression of bus i:
According to the COI frequency expression (Wang et al., 2024), it can be obtained that:
where Hs is the equivalent inertial time constant of the system, ΔPms is the total variation of the input mechanical power of the prime mover, and ΔPes is the total variation of the load. It can be seen that after the concept of COI frequency is introduced, the dynamic expression of the system frequency has the same form as the swing equation of the generator, and the system frequency can be considered to be the same everywhere. For simplicity, the following Hs, ΔPms, ΔPes are recorded as H, ΔPm, ΔPe.
There are many motor loads in the power system whose power changes with frequency fluctuations, which will damp the system frequency changes, as follows:
where ΔPL is the frequency-insensitive load change in the system, and D is the load damping coefficient.
The effect of HVDC fast power control can be equivalent to increasing Pe or decreasing Pm. According to the idea of increasing Pe, ΔPDC is regarded as the increase of Pe, as follows:
where
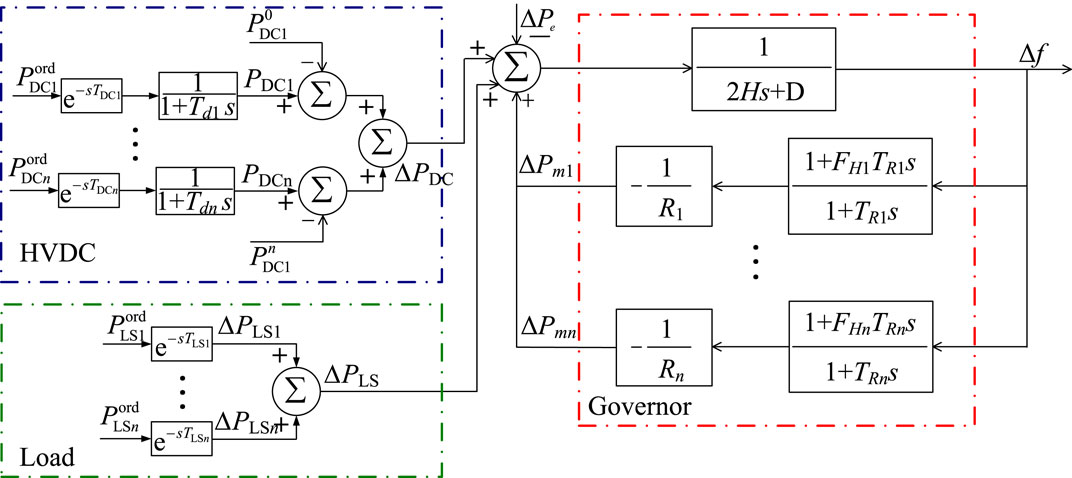
The response time of the HVDC is milliseconds, while the time scale of PFR is in seconds. Therefore, this paper uses the delay function and first-order inertial element to model to correctly express the control characteristics of the HVDC in EFC.
where ∆PDC is the control amounts of the HVDC, PordDC is the power references of the HVDC from the control center, P0DC is the transmission power of the HVDC before fault, TDC is the communication delays, Td is the EFC response time.
In addition, the load shedding also helps to compensate for power imbalance. The load shedding control function can be represented by a delay function with time constant.
where ∆PLS is the load shedding amount, PordLS is the power references of the load from the control center, and TLS represents the delay time of load shedding control.
Therefore, the SFR process can be expressed by Eq. 15:
The generator has the ability to actively participate in PFR. The equation expressing the approximate speed regulation characteristics of thermal power generators is:
where the specific parameters can be found in Shi et al. (2018b).
The above mathematical derivation can be described by the MM-SFR model considering the EFC, as shown in Figure 6.
3.3 Model reduction
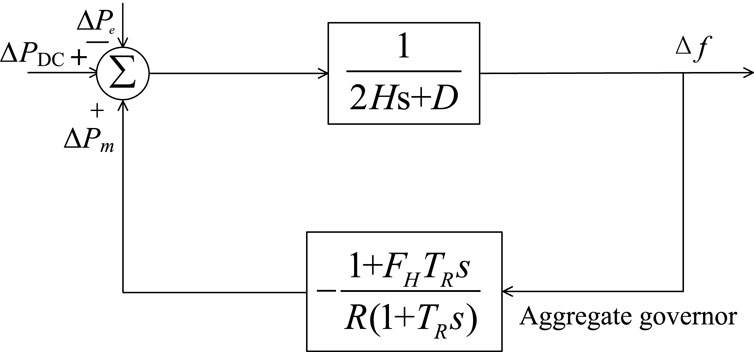
Since the governor branch of the MM-SFR model is complex and the model order is high, it is difficult to analytically solve the system transient frequency. Therefore, it is necessary to simplify the model reasonably. Based on the method proposed in Shi et al. (2018a), the speed regulation characteristics of all generators in the power system are equivalent to a feedback branch and obtain an ASFR model with a simple structure. Then the closed-loop transfer function expression is derived, and the time-domain analytical expression of transient frequency is obtained by inverse Laplace transform. Figure 7 is the reduced-order model diagram. The reduced-order derivation is shown in (Larsson, 2005; Feldman et al., 2013; Ahmadi and Ghasemi, 2014; Acosta et al., 2020; He, 2023; Shariati et al., 2023).
Since the dynamic of HVDC is in milliseconds, its response time constant can be ignored.
where ∆PDCi is the control amount of the ith HVDC.
The reduced-order parameters are obtained by weighting the original governor parameters according to the static adjustment coefficient. The relationship is as follows:
where Hi and Di are the inertia and damping constants of the ith generator. i is the number of governor branches, ki is the branch numbers of generators. κi is the ith branch equivalent gains of the generator. λi is the weighting coefficient of the ith branch.
The time-domain equation of electromagnetic power deviation can be derived based on the reduced-order MM-SFR model,
where ΔPlost is the active power shortage in the regional system. ΔPlost(s) is the power imbalance function. ΔPDC (s) is the HVDC fast power control function, and ΔPLS (s) is the control function of load shedding.
The unit step response U(t) of the reduced-order MM-SFR model is as follows:
where ωn, ζ, ωr, α, and φ are the coefficients of the governor.
According to the superposition rule of linear system, the frequency deviation expression is:
The frequency nadir can be obtained according to (Shariati et al., 2023)-(23),
where f0 is the nominal frequency.
The system transient frequency gradually recovers its nominal value with the help of the generator governor and EFC. The quasi-steady-state frequency is:
where Δfq is the frequency deviation at the quasi-steady-state frequency.
The expression of quasi-steady-state frequency deviation is:
where tq is generally tens of seconds.
The analytical expression of the quasi-steady-state frequency can be obtained based on (Kundur, 1994)-(27):
4 Case study
4.1 Information
In this paper, an actual power grid model is constructed in the electromechanical transient simulation software PSS/E to verify the proposed method. Among them, the generator adopts the GENROU model, the exciter system adopts the SEXS model, the turbine governor adopts the IEEESGO model, and the HVDC system adopts the CDC4T model. The computing resource information is CPU Intel Core i7-7500, a 2.70 GHz dual-core processor, with memory 16GB. The studied receiving-end power system model is shown in Figure 8, which contains 64 equivalent loads with a total demand of 59.60 GW, 39 equivalent generators, 196 1000 kV or 500 kV AC lines, and 6 HVDC lines. The HVDC systems are ± 660 kV HVDC-1, ± 800 kV HVDC-2, and ± 800 kV HVDC-3, with a transmission power of 4 GW, 8 GW, and 8 GW respectively. The multi-DC feed-in ratio accounts for 33.56% of the total load of the power grid. 33.6% of load demand in the receiving-end power system is supplied by active power through the 3 HVDCs.
4.2 Accuracy verification of analytical method
4.2.1 HVDC emergency control capability test
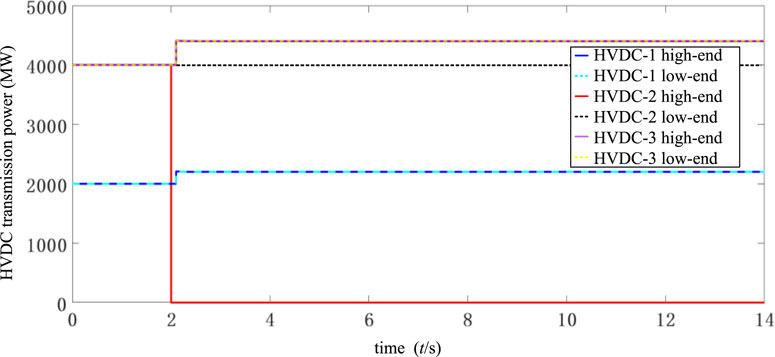
In the system shown in Figure 9, the HVDC emergency control capability is first tested. Since HVDC emergency control has the advantages of fast speed and large adjustment capacity, it is an important control measure to ensure the power system frequency security. Therefore, when the HVDC block fault occurs, HVDC emergency control is usually first used for power support. Figure 10 shows the simulation results of HVDC emergency control. The fault scenario is that a single-pole fault on HVDC-2 is blocked at t = 2 s, where the active power deficit is 4000 MW, which represents 6.71% of the total system pre-fault demand. At t = 2.1 s, HVDC-1 and HVDC-3 increase the active power by 10% for power support, which are 400 MW and 800 MW respectively.
4.2.2 Fault scenario: HVDC-1 single-pole blocking
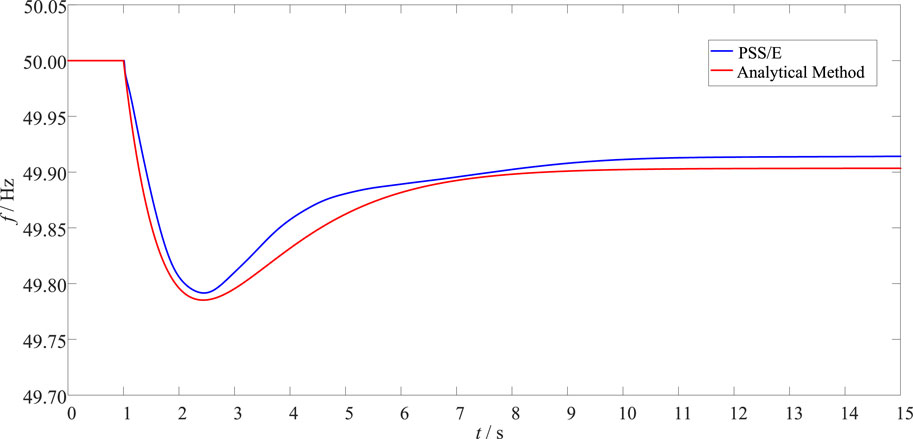
A single-pole blocking fault occurred in HVDC-1 at t = 1 s, resulting in a power deficit of 2 GW. At this time, the remaining normal HVDC is set to keep the transmission active power unchanged, that is, HVDC emergency control is not performed. The simulation step is set to 0.01 s, and the total simulation time is 15 s. The transient frequency response of the receiving-end power system after the HVDC-1 block fault calculated by the analytical method in this paper is compared with the results of the electromechanical transient simulation software PSS/E, as shown in Figure 10. The transient frequency indices calculated by the two methods are shown in Table 1.
It can be seen from Figure 10 that after the HVDC-1 block fault occurred, the power system frequency dropped significantly. The COI frequency response calculated by the analytical method in this paper is close to the simulation results of PSS/E software. According to Table 1, the transient frequency calculated by the two methods reaches the frequency nadir almost at the same time. In addition, the frequency nadir and quasi-steady state frequency calculated by the analytical method are 49.7847 Hz and 49.9034 Hz respectively. Compared with the calculation results of PSS/E, the relative errors are less than 0.01% and 0. 1% respectively, which reflects the accuracy of the proposed method.
In order to verify that the proposed method is also applicable to the frequency analytical calculation, HVDC emergency control was considered. After 0.1 s of HVDC-1 single-pole block fault, the HVDC-2 and HVDC-3 are urgently increased by 800 MW respectively. After taking HVDC emergency control, the transient frequency dynamics calculated by this method are compared with the simulation results of PSS/E, as shown in Figure 11.
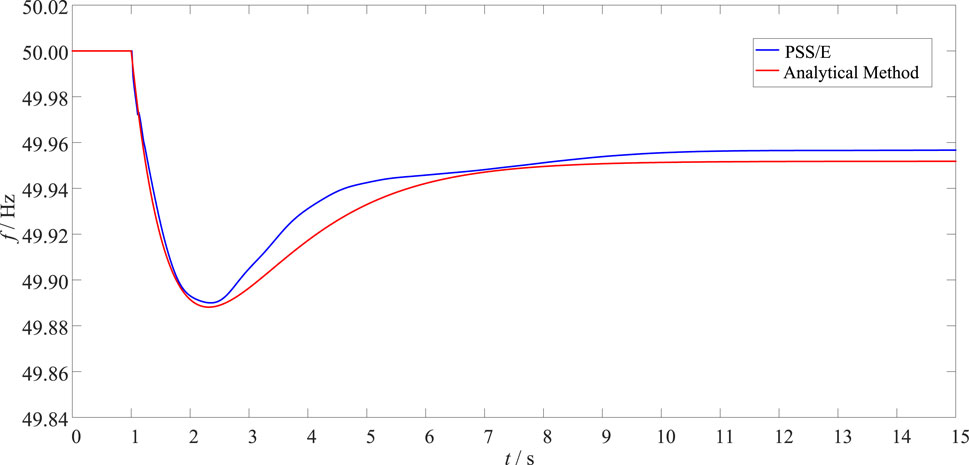
Figure 11. System frequency response curves under HVDC emergency control are considered in different methods.
It can be seen from Figure 11 that the transient frequency response is improved after the HVDC emergency control in the receiving-end power system. Compared with the case without control measures, the frequency nadir and quasi-steady state frequency are increased by 0.1005 Hz and 0.1187 Hz, respectively. In addition, the maximum frequency deviation calculated by PSS/E is 2.19 × 10⁻³ p.u., and the quasi-steady state frequency deviation is only 8.66 × 10⁻⁴ p.u., which is close to the nominal frequency. Therefore, it shows that the frequency security of the receiving-end power system with multi-infeed HVDC can be improved by reasonable emergency control.
The frequency indices and errors calculated by the two methods are shown in Table 2. The frequency indices obtained by the analytical method proposed in this paper are very close to the simulation results of PSS/E, and the relative errors are both less than 0.01%. Therefore, it can be seen that the proposed analytical method in this paper still has high accuracy in the case of considering DC emergency control, and can accurately reflect the support effect of DC emergency control on the system frequency after blocking. Therefore, it can be seen that this analytical method has high accuracy when considering the HVDC emergency control, and can accurately reflect the support effect of HVDC emergency control on the system frequency after block fault.
4.2.3 Fault scenario: HVDC-3 bi-pole blocking
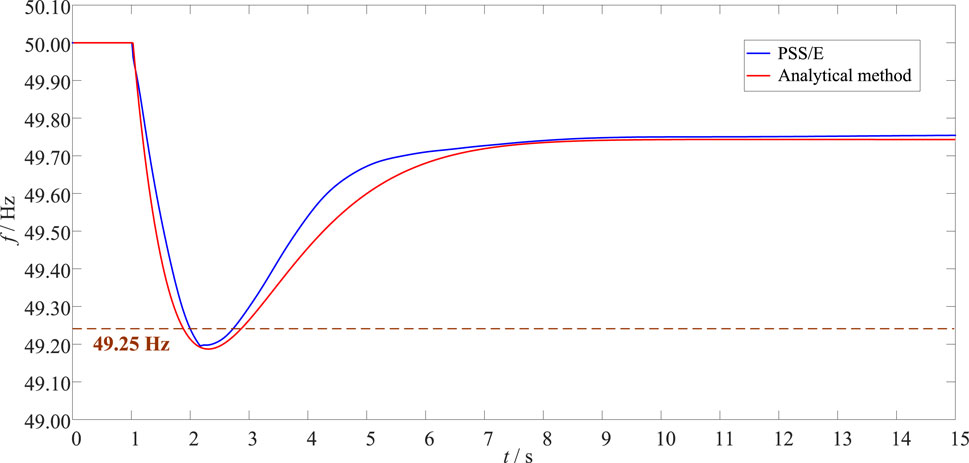
This section further verifies the accuracy and applicability of the proposed method under the more serious fault. The fault scenario is that a bi-pole fault on HVDC-3 is blocked at t = 1 s, where the active power deficit is 8000 MW, which represents 13.42% of the total system pre-fault demand. At this time, the remaining normal HVDC is set to keep the transmission active power unchanged, that is, HVDC will not participate in emergency control. According to the above conditions, the transient frequency curve is obtained by the analytical method and PSS/E simulation, as shown in Figure 12.
It can be seen from Figure 11 that after the HVDC-3 bi-pole block fault occurred, the power system frequency dropped significantly. The frequency nadir is lower than the threshold value of under-frequency load shedding (49.25 Hz), which seriously threatens the frequency security of the receiving-end power system. The detailed frequency indices and errors calculated by the two methods are shown in Table 3.
According to Table 3, the frequency response calculated by the analytical method is close to the simulation results of PSS/E software. In addition, the frequency nadir and quasi-steady state frequency calculated by the analytical method are 49.1939 Hz and 49.7454 Hz respectively. Compared with the calculation results of PSS/E, the absolute error levels of fnadir and fqss are both 10−3 Hz. It shows that the proposed method can accurately reflect the system frequency dynamics under the more serious fault.
However, under this fault, the power system may trigger low-frequency load shedding action, resulting in a large area of load shedding. Therefore, it is necessary to adopt appropriate emergency control strategies. The strategies are as follows: at t = 1.1 s, HVDC-1 emergency increased by 400 MW, HVDC-2 emergency increased by 800 MW, and at t = 1.2 s, the power system emergency load shedding is 3900 MW. After implementing the emergency control strategy, the transient frequency curves calculated by the analytical method and PSS/E are shown in Figure 13. The frequency indices and errors are shown in Table 4.
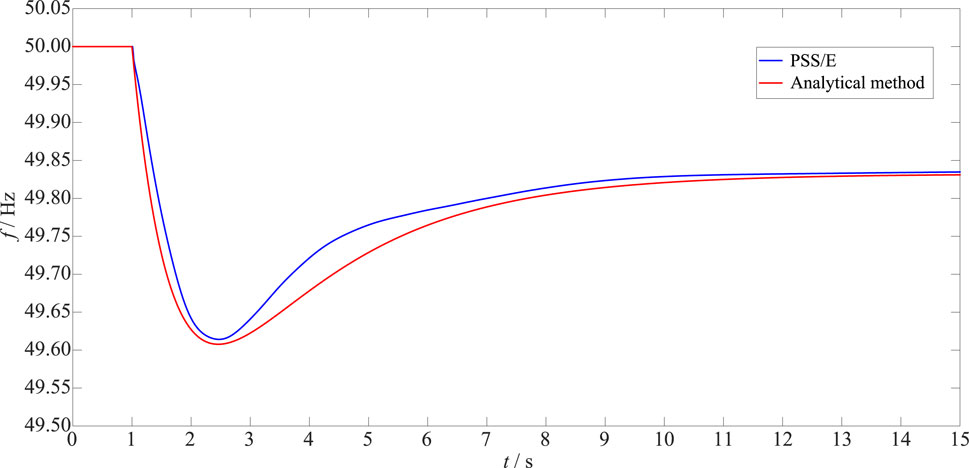
Figure 13. System frequency response curves under emergency control are considered in different methods.
According to Figure 13 and Table 4, after the emergency control, the system transient frequency nadir reaches about 49.6 Hz, which avoids triggering low-frequency load shedding and improves frequency security.
Under the emergency control strategy, the absolute errors of the frequency nadir and the quasi-steady state frequency obtained by the proposed method and PSS/E simulation are only 00,048 Hz and 0.0030 Hz, respectively. This shows that the proposed method is suitable for the analytical calculation of transient frequency after taking an emergency control strategy.
At the same time, it is further verified that the transient frequency analytical method considering emergency control has good applicability to the receiving-end power system with multi-infeed HVDC.
4.3 Applicability verification of analytical method
4.3.1 The SFR model parameter adjustment
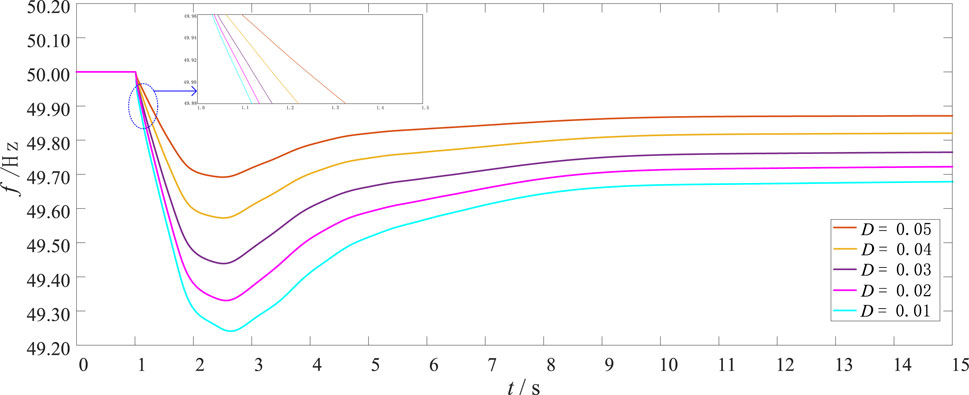
The fault scenario: the load suddenly increases by 10% at 1s in the established system. In this fault scenario, set the difference coefficient R to 5%, and adjust the load damping coefficient D from 0.01 to 0.05. The system frequency response curves under different coefficients D are shown in Figure 14. When the system load suddenly increases, with the decrease of D, the decrease rate of the system initial transient frequency increases, the transient frequency nadir and quasi-steady-state frequency indices decrease, reflecting the gradual deterioration of the frequency response of the system transient frequency response caused by the decrease of D parameter. Specifically, when parameter D decreases by 0.01, the maximum frequency change rate increases by about 0.38 Hz/s, the transient frequency nadir decreases by about 0.12 Hz, and the quasi-steady-state-frequency decreases by about 0.05 Hz. The frequency security of power system can be increased by properly adjusting the control parameter D.
4.3.2 Adaptability verification of the SFR model
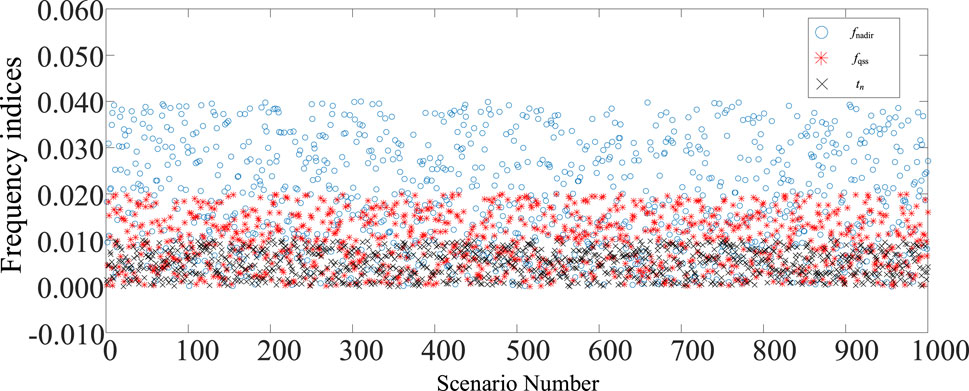
Considering the randomness and diversity of faults, the fault scenarios are set as the operating conditions when a unipolar/bipolar blocking fault occurs in HVDCs at 1 s, or when the load of the grid is perturbed according to the load increase of 0.1%, 0.2%, 9.9%, 10.0% of the total load, or when the two types of faults are randomly combined. The errors between the PSS/E and the SFR model of the frequency nadir, the time when the transient frequency drops to the nadir, and quasi-steady state frequency are shown in Figure 15.
It can be seen from Figure 15, the absolute errors between the PSS/E and the SFR model of the frequency nadir, the time when the transient frequency drops to the nadir, and quasi-steady state frequency are greater than zero in each of the predicted fault scenarios, which reflects conservativeness of the model. In various scenarios, the absolute error between the frequency nadir and the quasi-steady-state frequency is approximately less than 0.0004 p.u. and 0.0001 p.u., which meets the requirements of engineering applications.
5 Conclusion
This paper presents a novel a transient frequency analytical method for the receiving-end power systems, particularly focusing on the impact of EFC following HVDC block faults. The proposed method has been validated through an actual power system model, demonstrating its accuracy and effectiveness. The main contents of this paper are as follows:
1) HVDC system control mode analysis. The paper introduces an analytical method that considers the basic control mode of HVDC systems and designs a control method for EFC participation. This approach allows for a more nuanced understanding of how HVDC systems can be leveraged to support frequency stability in the event of disturbances.
2) Aggregated system frequency response (ASFR) model. The important innovation is the development of the ASFR model, which simplifies the complex MM-SFR model by reducing the order of the generator governor equation, the EFC equation, and the load model equation. This model enables a rapid and precise calculation of the transient frequency nadir, which is crucial for assessing and ensuring frequency security.
3) Analytical method for frequency indices. The paper derives an analytical solution for the transient frequency indices of the receiving-end power systems considering EFC. This solution provides a time-efficient method to predict system frequency dynamics post-disturbance, which is vital for formulating timely and effective EFC strategies.
To further enhance the system security and stability, future research could focus on distributed energy resources, flexible loads participation with the help of edge computing and artificial intelligence.
Data availability statement
The original contributions presented in the study are included in the article/Supplementary Material, further inquiries can be directed to the corresponding author.
Author contributions
ZS: Data curation, Formal Analysis, Investigation, Methodology, Writing–original draft. HZ: Conceptualization, Supervision, Writing–review and editing. YW: Formal Analysis, Software, Supervision, Writing–original draft. YL: Conceptualization, Funding acquisition, Writing–original draft. LY: Conceptualization, Funding acquisition, Resources, Writing–original draft. XZ: Funding acquisition, Methodology, Validation, Writing–original draft. MZ: Data curation, Resources, Writing–review and editing.
Funding
The author(s) declare that no financial support was received for the research, authorship, and/or publication of this article.
Conflict of interest
Authors ZS, HZ, YW, and YL were employed by Economic and Technical Research Institute of State Grid Shanxi Electric Power Company. Author LY was employed by Yingda Chang’an Insurance Brokers Co., LTD. Author MZ was employed by Construction Company State Grid Shanxi Electric Power Company.
The remaining author declares that the research was conducted in the absence of any commercial or financial relationships that could be construed as a potential conflict of interest.
Publisher’s note
All claims expressed in this article are solely those of the authors and do not necessarily represent those of their affiliated organizations, or those of the publisher, the editors and the reviewers. Any product that may be evaluated in this article, or claim that may be made by its manufacturer, is not guaranteed or endorsed by the publisher.
References
Acosta, M. N., Andrade, M. A., Vazquez, E., Adiyabazar, C., Gonzalez-Longatt, F., Rueda, J. L., et al. (2020). “Improvement of the frequency response indicators by optimal UFLS Scheme Settings,” in 2020 IEEE 29th international symposium on industrial electronics (ISIE) Netherlands: Delft, 17-19 June 2020 (IEEE), 1250–1255.
Ahmadi, H., and Ghasemi, H. (2014). Security-constrained unit commitment with linearized system frequency limit constraints. IEEE Trans. Power Syst. 29 (4), 1536–1545. doi:10.1109/TPWRS.2014.2297997
Anderson, P. M., and Mirheydar, M. (1990). A low-order system frequency response model. IEEE Trans. Power Syst. 5 (3), 720–729. doi:10.1109/59.65898
Denholm, P., Mai, T., Kenyon, R. W., Kroposki, B., and O'Malley, M. (2020). Inertia and the power grid: a guide without the spin. OSTI. doi:10.2172/1659820
Du, P., and Li, W. (2021). Frequency response impact of integration of HVDC into a low-inertia AC power grid. IEEE Trans. Power Syst. 36 (1), 613–622. doi:10.1109/TPWRS.2020.2990304
Feldman, R., Tomasini, M., Amankwah, E., Clare, J. C., Wheeler, P. W., Trainer, D. R., et al. (2013). A hybrid modular multilevel voltage source converter for HVDC power transmission. IEEE Trans. Ind. Appl. 49 (4), 1577–1588. doi:10.1109/TIA.2013.2257636
Haes Alhelou, H., Hamedani-Golshan, M. E., Njenda, T. C., and Siano, P. (2019). A survey on power system blackout and cascading events: research motivations and challenges. Energies 12 (4), 682. doi:10.3390/en12040682
He, Y. (2023). “Comprehensive optimization of HVDCs control strategy for multi-DC feed-in weak AC systems,” in 2023 2nd asia power and electrical technology conference (APET) Shanghai, Cinna, 377–382.
Hoke, A., Boemer, J. C., Badrzadeh, B., MacDowell, J., Kurthakoti, D., Marszalkowski, B., et al. (2024). Foundations for the future power system: inverter-based resource interconnection standards. IEEE Power Energy M. 22 (2), 42–54. doi:10.1109/MPE.2023.3341795
Hou, Q., Du, E., Zhang, N., and Kang, C. (2020). Impact of high renewable penetration on the power system operation mode: a data-driven approach. IEEE Trans. Power Syst. 35 (1), 731–741. doi:10.1109/TPWRS.2019.2929276
Larsson, M. (2005). An adaptive predictive approach to emergency frequency control in electric power systems. in Proceedings of the 44th IEEE Conference on Decision and Control Seville, Spain, 15-15 December 2005 (IEEE), 4434–4439.
Li, S., Haskew, T. A., and Xu, L. (2010). Control of HVDC light system using conventional and direct current vector control approaches. IEEE Trans. Power Electron. 25 (12), 3106–3118. doi:10.1109/TPEL.2010.2087363
Li, X., Li, Y., Liu, L., Wang, W., Li, Y., and Cao, Y. (2020). Latin hypercube sampling method for location selection of multi-infeed HVDC system terminal. Energies 13 (7), 1646. doi:10.3390/en13071646
Liu, L., Li, W., Ba, Y., Shen, J., Jin, C., and Wen, K. (2020). An analytical model for frequency nadir prediction following a major disturbance. IEEE Trans. Power Syst. 35 (4), 2527–2536. doi:10.1109/TPWRS.2019.2963706
Shariati, O., Aghamohammadi, M. R., Potter, B., and Mirheydar, M. (2023). A novel approach to extended system frequency response model for complex power systems (ESFR). IEEE Access 11, 60777–60791. doi:10.1109/ACCESS.2023.3285756
Shaw, P., and Kumar Jena, M. (2021). A novel event detection and classification scheme using wide-area frequency measurements. IEEE Trans. Smart Grid. 12 (3), 2320–2330. doi:10.1109/TSG.2020.3039274
Shen, L., Jiang, L., Ming, Q., Wang, Q., and Wen, Y. (2023). A global sensitivity-based identification of key factors on stability of power grid with multi-outfeed HVDC. IEEE Lat. Am. Trans. 21 (11), 1181–1190. doi:10.1109/TLA.2023.10268273
Shi, Q., Li, F., and Cui, H. (2018b). Analytical method to aggregate multi-machine SFR model with applications in power system dynamic studies. IEEE Trans. Power Syst. 33 (6), 6355–6367. doi:10.1109/TPWRS.2018.2824823
Shi, Z., Xu, Y., Wang, Y., He, J., Li, G., and Liu, Z. (2023). Coordinating multiple resources for emergency frequency control in the energy receiving-end power system with HVDCs. IEEE Trans. Power Syst. 38 (5), 4708–4723. doi:10.1109/TPWRS.2022.3215201
Shi, Z., Xu, Y., Wu, X., and He, J. (2018a). “Coordinated emergency control strategy for transient stability enhancement of AC/DC hybrid power systems based on EEAC theory,” in IEEE conference on China international electrical and energy conference Beijing, China, 04-06 November 2018, (IEEE), 88–93.
Son, Y., Ha, Y., and Jang, G. (2024). Frequency nadir estimation using the linear characteristics of frequency control in power systems. Energies 17 (5), 1061. doi:10.3390/en17051061
Tang, G., Xu, Z., Dong, H., and Xu, Q. (2016). Sliding mode robust control based active-power modulation of multi-terminal HVDC transmissions. IEEE Trans. Power Syst. 31 (2), 1614–1623. doi:10.1109/TPWRS.2015.2429690
Wang, J., Hou, Q., Zhuo, Z., Jia, H., and Zhang, N. (2024). Voltage stability constrained economic dispatch for multi-infeed HVDC power systems. IEEE Trans Power Syst 39 (2), 2598–2610. doi:10.1109/TPWRS.2023.3277213
Xie, D., Xu, Y., Nadarajan, S., Viswanathan, V., and Gupta, A. K. (2024). Dynamic frequency-constrained load restoration considering multi-phase cold load pickup behaviors. IEEE Trans Power Syst 39 (1), 107–118. doi:10.1109/TPWRS.2022.3225798
Yu, L., Sun, H., Xu, S., Zhao, B., and Zhang, J. (2022). A critical system strength evaluation of a power system with high penetration of renewable energy generations. CSEE J. Power Energy Syst. 8 (3), 710–720. doi:10.17775/CSEEJPES.2021.03020
Zhang, N., Zhou, Q., and Hu, H. (2019). Minimum frequency and voltage stability constrained unit commitment for AC/DC transmission systems. Appl. Sci. 9 (16), 3412. doi:10.3390/app9163412
Keywords: analytical method, emergency frequency control (EFC), regional power systems, system frequency response (SFR) model, HVDC
Citation: Shi Z, Zhao H, Wang Y, Liang Y, Yan L, Zhang X and Zhang M (2024) The frequency analytical method for regional power systems considering the emergency frequency control. Front. Energy Res. 12:1354908. doi: 10.3389/fenrg.2024.1354908
Received: 13 December 2023; Accepted: 07 June 2024;
Published: 01 July 2024.
Edited by:
Rakibuzzaman Shah, Federation University Australia, AustraliaReviewed by:
Mohammad Hossein Mousavi, Razi University, IranNusrat Subah Binte Shakhawat, Federation University Australia, Australia
Copyright © 2024 Shi, Zhao, Wang, Liang, Yan, Zhang and Zhang. This is an open-access article distributed under the terms of the Creative Commons Attribution License (CC BY). The use, distribution or reproduction in other forums is permitted, provided the original author(s) and the copyright owner(s) are credited and that the original publication in this journal is cited, in accordance with accepted academic practice. No use, distribution or reproduction is permitted which does not comply with these terms.
*Correspondence: Zheng Shi, c2hpemhlbmdfc2djY0AxNjMuY29t
 Zheng Shi
 Haibo Zhao1
