 Jun Teng1
 Danhua Chen
95% of researchers rate our articles as excellent or good
Learn more about the work of our research integrity team to safeguard the quality of each article we publish.
Find out more
ORIGINAL RESEARCH article
Front. Energy Res. , 08 February 2024
Sec. Process and Energy Systems Engineering
Volume 12 - 2024 | https://doi.org/10.3389/fenrg.2024.1353617
This article is part of the Research Topic Advanced Technologies for Planning and Operation of Prosumer Energy Systems, volume III View all 32 articles
Since the dead-zone fault in substations often has a relatively long removal time, it may damage the insulation of power equipment and even threaten the stability of the power system. In this paper, the movement of the dead-zone fault electric arc in a 220-kV substation is investigated. The arc chain model for the dead-zone fault electric arc is developed; the influences of electromagnetic force, thermal buoyancy, and the air resistance stressed on the electric arc are comprehensively considered. The electric arc velocity and displacement are computed. Then, the spreading characteristics of the dead-zone electric arc under various conditions are studied. The spreading trend of the dead-zone fault electric arc is summarized. Finally, measures to inhibit the spreading of the electric arc are suggested. The study indicates that the movement of the electric arc in the dead zone during the early stage is primarily influenced by the electromagnetic force resulting from the overpass and conductor, and the arc is concave and has an irregular trajectory. The inclination angle of the conductor significantly affects the direction of the electromagnetic force. If the conductor is laid horizontally, the electric arc is subjected to a smaller force. The electromagnetic force stressed on the electric arc is mainly attributed to the fault phase conductor and the electric arc body itself, whereas those from the other phase conductors are minor. The initial position of the arc root has a certain impact on the movement of the electric arc. The use of the insulating materials restricts the arc root movement.
The demand for electricity has grown rapidly in the past decade with the development of the economy. In order to achieve the goal of carbon peak and carbon neutrality, China has accelerated the electrification and electric energy substitution process. Although the use of large-scale renewable energy faces many challenges, such as the high cost and the risk to power grid stability, wind power and photovoltaic power are still increasingly penetrated into the power grid in recent years, and they will become the main energy source. Considerable substations have been put into service.
Due to the land space limitation, overpasses are widely used in many substations constructed in urban areas, especially at a 220 kV voltage level, because of their convenient installation, operation, and maintenance. Some disconnecting switches can be installed above the overpasses. Such type of substation design significantly saves land occupation. However, the compact structure also makes these substations vulnerable to the line-to-ground fault. The dangerous fault electric arc would spread quickly and is very hazardous. Meanwhile, to limit the extent of the power system that is disconnected when a fault occurs, protection is arranged in zones. This is because accommodation for current transformers (CTs) is, in some cases, available only on one side of the circuit breakers (CBs). It leaves a section between CT and CB that is not completely protected against faults, forming the so-called dead zone. For dead-zone faults, the protection system has to balance the requirements of selectivity and speed (Wang et al., 2021). Therefore, in the case of fault, the clearing time is much longer than other locations, and it may even exceed 1 s. However, the movement speed of an electric arc is extremely fast. Prior to the removal of the fault, the electric arc with high temperature may have spread to other equipment, damaging the insulation of power equipment. It would even threaten other associated equipment.
Currently, research on dead zone protection mainly focuses on how to shorten the fault duration (Chen et al., 2014; Tang et al., 2014; Li et al., 2021; Lin et al., 2021; Xu et al., 2022). Several studies proposed a number of novel strategies with different judgment logics. Under the premise of guaranteeing a safe and stable operation, it still cannot achieve full speed, and the fault duration is still very long compared to the fast movement of electric arcs. During the fault interval, the high-temperature arc would harm the equipment. Wu and Lianjin (2017) suggested adding a set of CTs on both sides of the dead zone to meet the requirements of quick action, but the presence of such equipment would undoubtedly take more space in the substation. It is expensive and almost infeasible, especially in urban areas. It also contradicts the concept of a miniaturized substation design and is difficult to realize in most compact substations. The existing methods face difficulties in fully addressing the damage caused by dead-zone fault arcs to adjacent equipment, and the harm of dead-zone fault arcs to adjacent equipment still exists. Furthermore, there are limited measures to reduce the harm of dead-zone arcs. It is necessary to find a more effective solution to minimize the impact of dead-zone faults on adjacent equipment and improve the overall reliability of the power system.
In this paper, the movement of the dead-zone fault electric arc in a 220-kV substation is investigated. First, the arc chain model is used to simulate the current element of a dead-zone fault electric arc. The influences of electromagnetic force, thermal buoyancy, and the air resistance stressed on the electric arc are comprehensively considered. Using the MATLAB software package, the electric arc velocity and displacement are computed. Then, the spreading characteristics of the dead-zone electric arc under various conditions are studied. The spreading trend of the dead-zone fault electric arc is summarized. Finally, measures to inhibit the spreading of the electric arc are suggested.
Depending on the fault location, the dead zone in a substation can be categorized into three types: line protection dead zone, busbar protection dead zone, and transformer protection dead zone. These zones are generally located between CT and CB. Taking the transformer dead zone as an example, its occurrence area is depicted in Figure 1. Similar to the medium-voltage-side dead zone, those on the high- and low-voltage sides can also be obtained, i.e., on the 35 kV side, the dead zone is also located between CT and CB.

FIGURE 1. Diagram of the dead-zone area for transformers in the substation.
Depending on the dead-zone area, there are also various relay protection strategies (Tang et al., 2014; Liang, 2023). Taking the dead zone of a 220-kV three-winding transformer as an example, when a fault occurs in this area of 220 kV side, the main transformer differential protection for out-of-area faults will not act. Nevertheless, at the moment of t = 0 s, the busbar differential protection on that side will instantly clear all CBs on the 220-kV busbar of the transformer. However, since other two sides of the transformer are still connected to the power system, the fault would still exist. The differential protection for a busbar has not reset and still exists in a tripped state. After a certain delay, the 220-kV backup protection for the transformer would trip on other two sides, and the fault would be ultimately removed. The removal time for the fault is generally very long, between 0.6 s and 2 s, which is slightly different from the 220 kV side; however, the busbar differential protection is typically not implemented in the 35 kV side (Tang et al., 2014). Only when the backup protection on the high-voltage side is activated, and the three-side switches are tripped, the fault in the dead zone of 35 kV side can be cleared.
This study takes a 220-kV substation located in Jiangsu Electric Power Company as an example. The fault occurs in a traditional compact substation with the overpass, as illustrated in Figure 2. The overpass, which is vertical to the conductor in space, is above the CT. To mechanically support the equipment, a metal frame is fixed below it. The lead conductor connects the top of CB to the right-side of CT. The conductor has a certain inclination angle with respect to the horizontal plane. During the fault, a metal wire fell from the overpass to the lead conductor between the CB and CT of the transformer, the so-called dead zone for protection. Since there is an insufficient insulating distance between the high-voltage conductor and the overpass with ground potential, a single-phase-to-ground fault occurs. The high-current arc drifts very rapidly, and the fault current flows from the CT to the metal frame and finally into the ground. The metal wire immediately melts, and the metal vapor generated by the high-temperature arc further leads to the phase-to-phase fault.
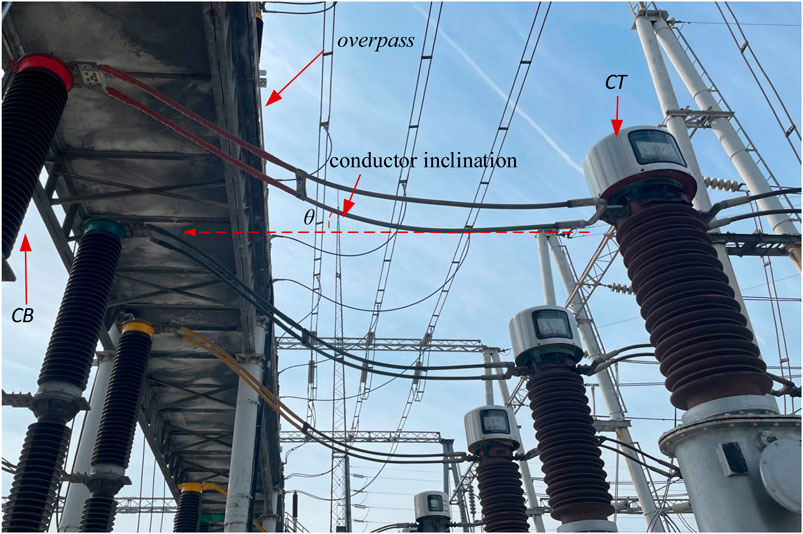
FIGURE 2. Photograph of the fault dead-zone area in the substation.
The current and voltage data for the dead-zone fault in a substation is recorded, as shown in Figure 3A. It experiences six stages as follows:
Stage 1: At t = 4 ms (Point A), the 110 kV differential protection for phase C of the auxiliary busbar acts, and the medium-voltage-side CBs are cleared.
Stage 2: At t = 50 ms (Point B), all CBs of the 110 kV auxiliary busbar trip, but the fault still exists.
Stage 3: At t = 480 ms (Point C), due to the motion of the fault electric arc, the fault is developed from the single-phase-to-ground fault (Phase C) to phase-to-phase ground fault (Phase B to C).
Stage 4: At t = 1,430 ms (Point D), the busbar differential judgment indicates a Phase B ground fault in the positive busbar zone, and the 110 kV positive busbar differential protection operates, causing the removal of the Phase B fault.
Stage 5: At t = 1,507 ms (Point E), the 220 kV side CB of the complex current section I on the medium voltage side of the second main transformer trips due to the action of the third time limit.
Stage 6: At t = 1,559 ms (Point F), the high-voltage-side CB of the transformer trips, and the dead-zone fault is removed.
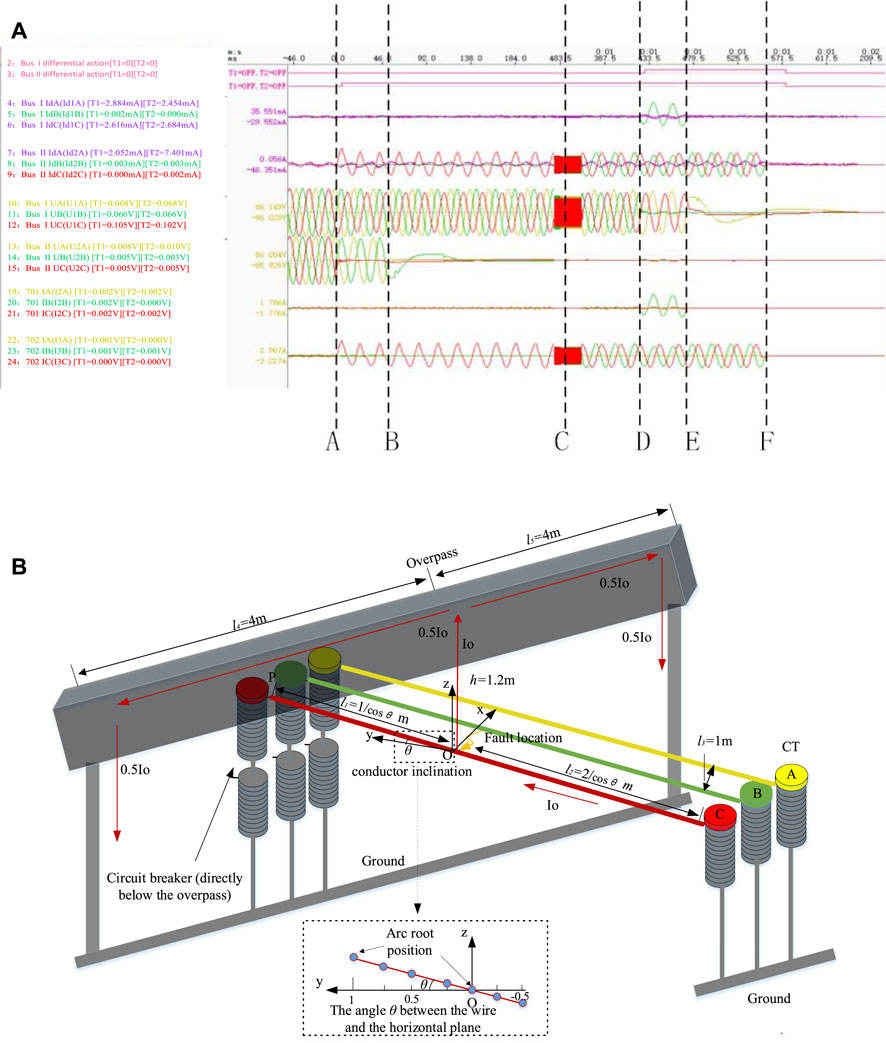
FIGURE 3. (A) Recorded data for the dead-zone fault in the substation; (B) dimension of the dead-zone area in the substation.
To prevent the equipment from damaging by an electric arc, the motion of a dead-zone fault electric arc and its spreading characteristics are investigated. The detailed dimension for the substation under study is depicted in Figure 3B.
The arc chain model is used to represent the high-current fault electric arc, and the force analysis is conducted on each current element. Consider the combined effects of electromagnetic force Fmi, thermal buoyancy Fti, and air resistance Fri (DONG et al., 2023; Sun et al., 2022; Murphy, 1995; Cong, H. et al., 2015b; Cong, H. et al., 2022; Cong, H. et al., 2022; Li et al., 2023; Li et al., 2019; Cong, 2015a), as shown in Figure 4.
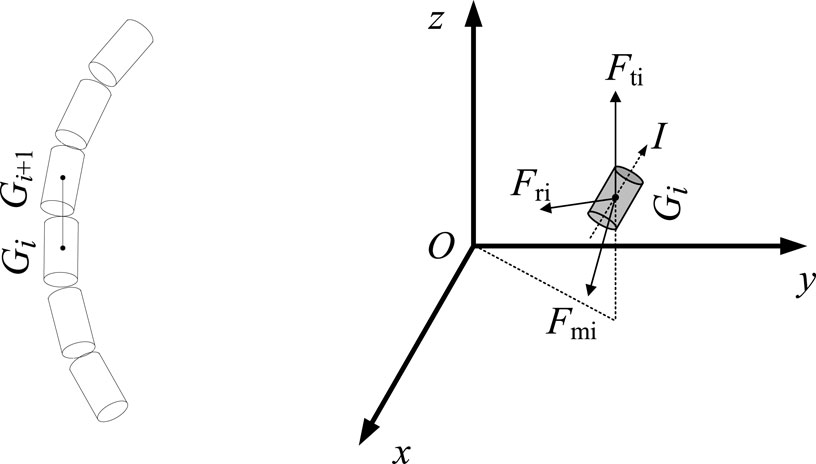
FIGURE 4. Current element model.
The equilibrium equation for the force stressed on the arc is
Here, a represents the acceleration of the fault arc current element. The electromagnetic force, denoted by Fmi, is mainly considered the effect of a certain dead interval three-phase conductor and grounded conductor:
where lai represents the length of the current element i, Iai represents the vector of the current element, and Bi represents the magnetic strength at the location of the current element.
The thermal buoyancy, denoted by Fti, is an upward force stressed on all arc current elements (Tanaka and Matsumura, 2009) and is given by the following equation:
where ρ0 represents the air density at standard atmospheric pressure, and its value is taken as 1.295 kg/m3; ρ represents the air density for the arc at high temperature, and its value is taken as 0.022 kg/m3;
The air resistance force is always opposite to the motion direction of the current element (Gu et al., 2006a), and it can be expressed as
where vi represents the velocity of motion of the ith current element.
The flowchart for the motion of the fault electric arc in the dead-zone area is shown in Figure 5.
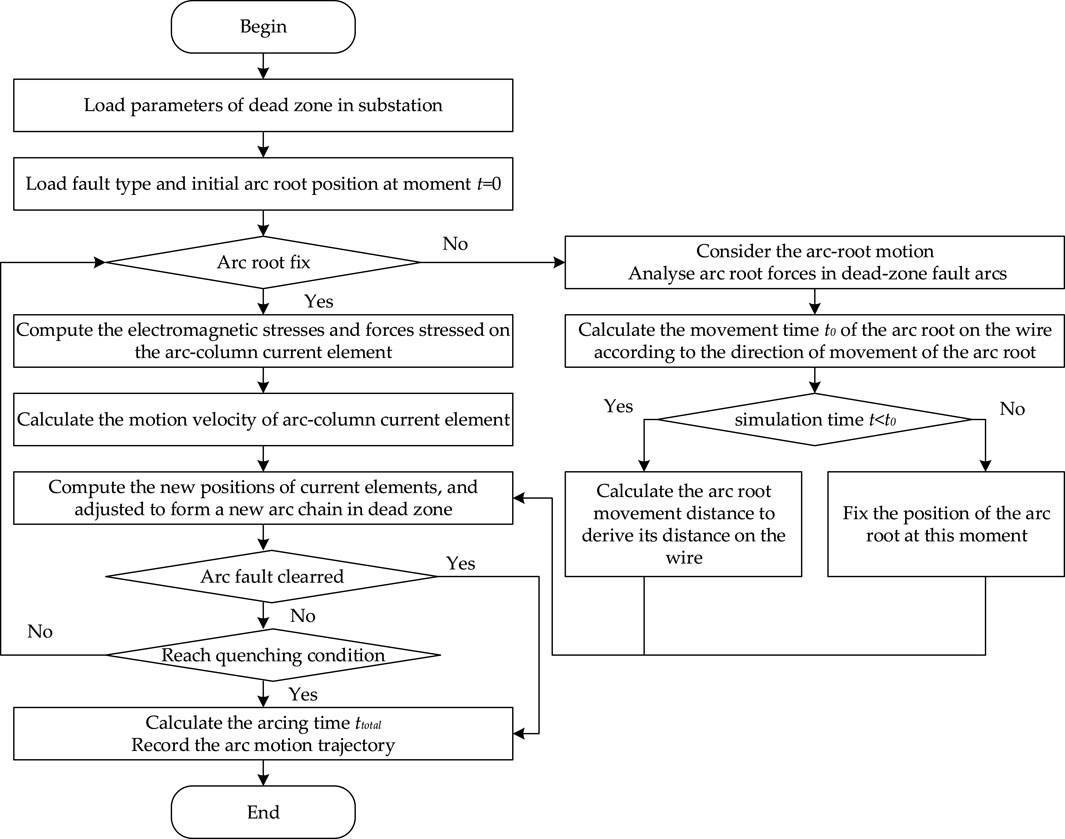
FIGURE 5. Flowchart of dead-zone fault electric arc motion.
It can be generally divided into following steps:
Step 1. Import the dead-zone fault parameter of the substation, including the fault type, the dead-zone dimension, the initial arc length, and the initial arc root position.
Step 2. Calculate the electromagnetic stress and compute the force stressed on the arc root and arc column. Determine the arc root motion time t0 in the conductor through the arc occurrence position and arc root speed. If the motion time t < t0, the arc root is in the motion stage, and the arc root position changes with each iteration. If the movement time t > t0, the arc root is fixed to the terminal, and only the arc column continues to move. Calculate the displacement of each current element of the arc, and form a new arc trajectory.
Step 3. Judge whether the fault is cleared. Since the short-circuit current is very high, it is difficult to extinguish the arc by itself within this short time. If the fault is not terminated, directly go to the next iteration and cycle. If the fault is ultimately removed, terminate the program and then capture the arc trajectory.
Based on the arc chain model and the detailed substation parameters, as shown in Figure 3, a set of simulations has been performed. Three phases, denoted by A, B, and C, have been remarked in the figure. The fault is supposed to occur at Phase C. The inclination angle between the conductor and horizontal plane is θ = 10°, the length of the conductor is set to l = 3/cosθ m (3.05 m), the distance between the initial fault point and the CB is approximately 1 m (l1 = 1/cosθ m), and the distance between the initial fault point and the CT is approximately 2 m (l2 = 2/cosθ m); the projection distance on the y-axis is l10 = 1 m, l20 = 2 m, and the radius r = 0.01 m; the distance between the conductors of each phase is 1 m; the current flows from the right side of the CT through the conductor connected to the top of the CB, and the current flows from the conductor through the dead-zone arcing from the overpass on both sides of the metal frame into the earth, l3 = l4 = 4 m. The two sides of the current have opposite directions but same magnitude, and the short-circuit current is I1 = I2 = 4,000 A. The distance between the overpass and conductor is h = 1.2 m. The upper arc root is supposedly fixed, and the lower arc root keeps moving due to the electromagnetic force resulting from the fault. The initial occurrence place is O (0, 0, and 0), and the end point is P (0, 1, and 0.17); the simulation time step is set to t = 0.002 s. Considering the operation of the backup protections, the simulation is terminated at tmax = 0.48 s.
The motion trajectory of a fault electric arc in the dead zone of a substation is shown in Figure 6.
(i) In the early stage, the electric arc mainly moves in the positive direction of x and y axes, the movement distance is short, and the arc trajectory is relatively simple.
(ii) In the middle stage, the arc continues its motion in the previous directions, and it goes upward due to the effect of the thermal buoyancy. The curvature of the arc slightly increases.
(iii) In the later stage, the morphology of the electric arc is very complex and becomes concave as a whole. The electric arc reaches its maximum motion in all directions (x, y, and z). The arc mainly moves in the positive direction toward x, y, and z axes; the arc root at the top and bottom moves very fast, whereas the arc column in the middle moves relatively slower. The electric arc length rises significantly, and the arc body moves far away from the conductor and the overpass.
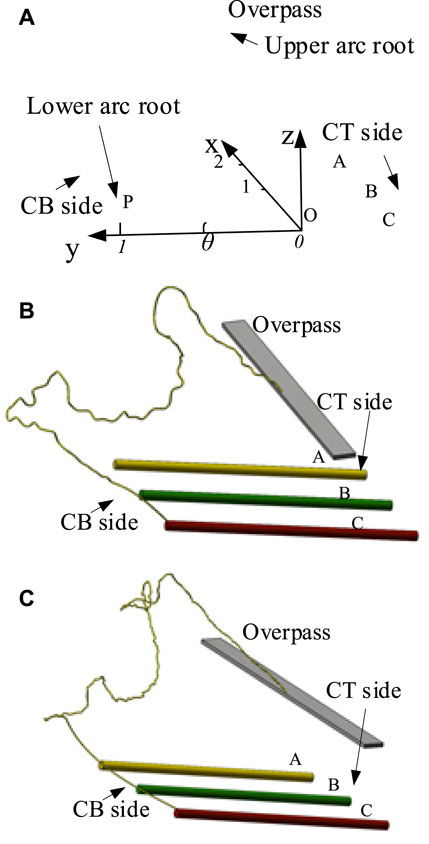
FIGURE 6. Motion trajectories of fault electric arcs in the dead zone of the substation. (A) t = 0.16 s; (B) t = 0.32 s; and (C) t = 0.48 s.
The movement of the electric arc is mainly affected by three forces: thermal buoyancy, air resistance, and electromagnetic force. The thermal buoyancy force is upward in direction and is related to the magnitude of the current; the air resistance force acts in the opposite direction to the arc motion and is mainly affected by its velocity; and the electromagnetic force directly affects the speed of the arc, and its magnitude continuously changes with time and position. The electromagnetic force stressed on the arc body is very crucial. According to the substation dead-zone arc structure, the electromagnetic force effect is as follows: the electromagnetic force from the Phase C conductor primarily drives the arc away from the conductor in the positive x-axis and y-axis directions; the electromagnetic forces from Phase A and Phase B conductors mainly push the arc toward the negative x-axis and y-axis directions; the electromagnetic force from the same-side overpass causes the arc to move in the negative x-axis direction; the opposite-side force causes the arc to move in the positive x-axis direction; the arc itself would also produce an electromagnetic force and cause a stress on the arc current elements.
Figure 7 shows the detailed electromagnetic force stressed on the electric arc. It can be decomposed into Fm1 ∼ Fm6, which corresponds to B1 ∼ B6. As shown in the figure, the electromagnetic forces that play a key role during the motion process are the electromagnetic force Fm1 within the arc and the electromagnetic force Fm2 from the Phase C conductor, whereas other electromagnetic forces on the arc movement has lesser impact. Since the arc internal role of an electromagnetic force does not directly act in a single direction, and in addition to the arc internal force Fm1, only the Phase C conductor force Fm2 is the largest, so the main direction of arc motion in the dead zone is in the positive x-axis and y-axis directions.
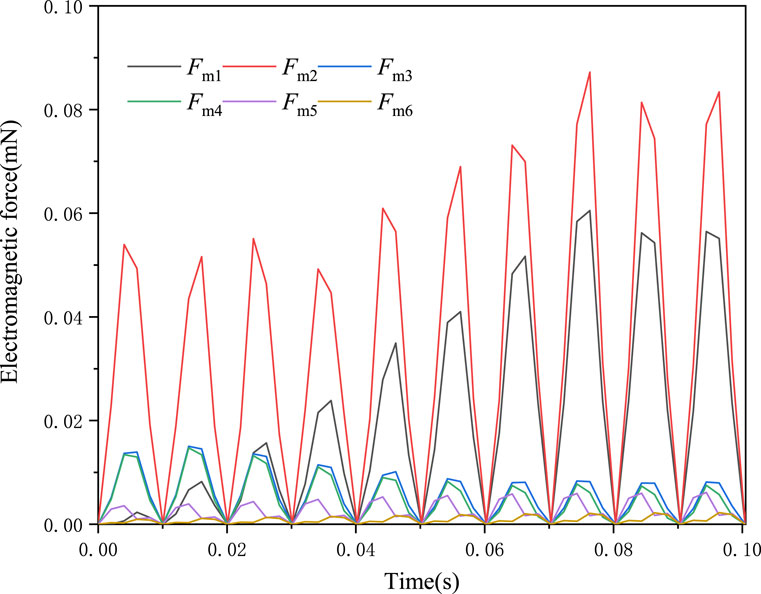
FIGURE 7. Decomposition of electromagnetic force stressed on the electric arc. Fm1 ∼ Fm6 corresponds to the electromagnetic strength B1 ∼ B6. B1 represents the magnetic induction strength of the interaction between arcs; B2, B5, and B6 represent the magnetic induction strengths generated by the three-phase conductors in the dead zones C, B, and A, respectively; B3 represents the magnetic induction strength generated by the current flowing through the right side of the catwalk; and B4 represents the magnetic induction strength generated by the current flowing through the left side of the overpass.
Considering that the displacement of the arc in the y-axis direction only affects the disconnecting switch within its interval, studying the effect of the arc motion on the neighboring phases, this paper mainly discusses the results of the arc in the x-axis. Figure 8 shows the distribution of electromagnetic forces on the arc in the x-axis direction. It can be seen that the arc movement can be divided into three stages: (i) in the early stage, the arc is subjected to a large force Fm3 and Fm4 in the direction of the overpass, and as the arc moves away from the overpass, these electromagnetic forces gradually decrease; (ii) in the middle stage, the forces from the Phase C conductor (Fm2) and the internal electromagnetic force within the arc (Fm1) increase rapidly. At this time, the arc movement is mainly affected by these two forces. Although the electromagnetic forces Fm5 and Fm6 from the adjacent phases (AB phases) also increase, however, compared to the electromagnetic force Fm2, it is small and can almost be ignored; (iii) in the later stage, due to the arc and the distance between the conductor of the current phase continue to increase, the force from the conductor decreases dramatically. At this time, the internal electromagnetic force Fm1 dominates the arc motion. Although the internal electromagnetic force also decreases, it still dominates the arc motion.
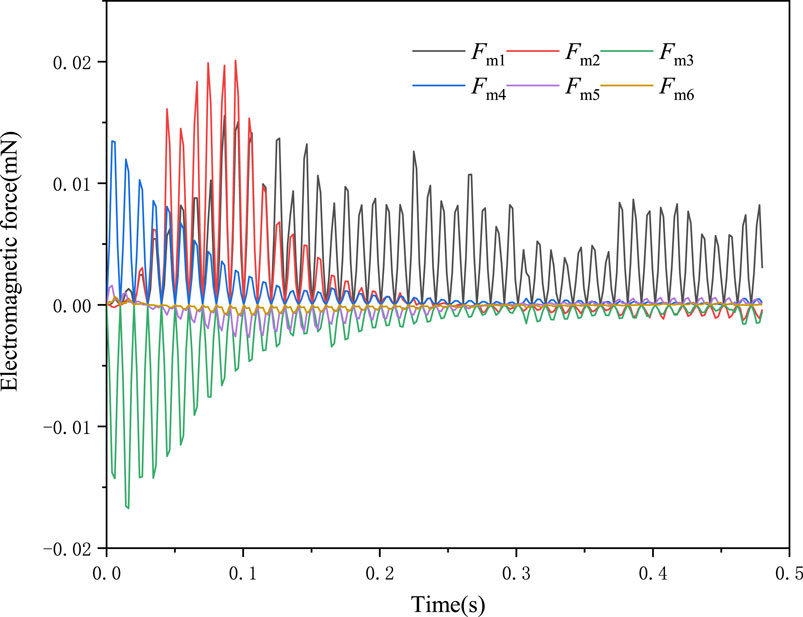
FIGURE 8. Electromagnetic forces in the x-axis direction.
Since the arc is subjected to a net force in the positive x-direction, the arc is shifted toward the positive x-axis. During the early and middle stages, the arc is mainly affected by the overpass and conductor electromagnetic forces, the arc root is closer to the conductor which increases the force, and the movement speed is faster than the middle arc column part, so the arc presents a concave shape to the x-axis positive direction. In the later stage, the arc is mainly affected by the arc electromagnetic force generated by the arc itself. This irregular electromagnetic force leads to the movement of the arc in a complex direction so that the electric arc becomes very complex. The force analysis agrees well with the observed motion behavior of the electric arc.
Considering the variations in arc motion due to the different phases of transmission conductors, this paper discusses the dead-zone arc faults separately for each phase. Single-phase dead-zone arc faults are set at the same location on Phases A, B, and C, with the current flowing through the arc, consistent in all three simulations. The simulation environments for all three cases are kept consistent, except for the phase difference. Based on the above conditions, simulations are conducted for each of the three scenarios of dead-zone arc faults, and the simulation results at the moment of t = 0.48 s are shown in Figure 9.
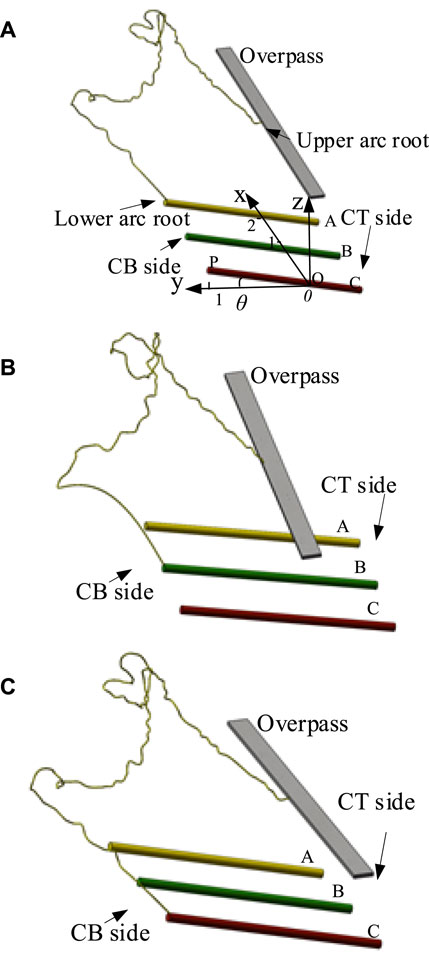
FIGURE 9. Motion trajectory versus initial fault phases. (A) Initial fault phase, Phase A; (B) initial fault phase, Phase B; and (C) initial fault phase, Phase C.
Figure 10 shows that there are great differences in the trajectory of the dead-zone arcs, but the maximum displacement in the x-axis is approximately the same. The displacements along x-axis for the three-phase dead-zone arcs A, B, and C are 1.43 m, 1.44 m, and 1.46 m, respectively. The forces in the x-axis direction are shown in Figure 11.
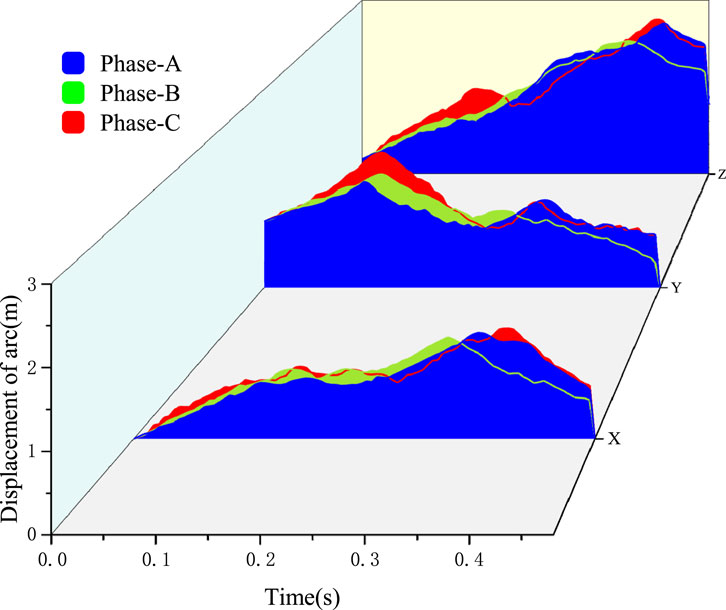
FIGURE 10. Comparison of dead-zone electric arc displacements versus fault phases.
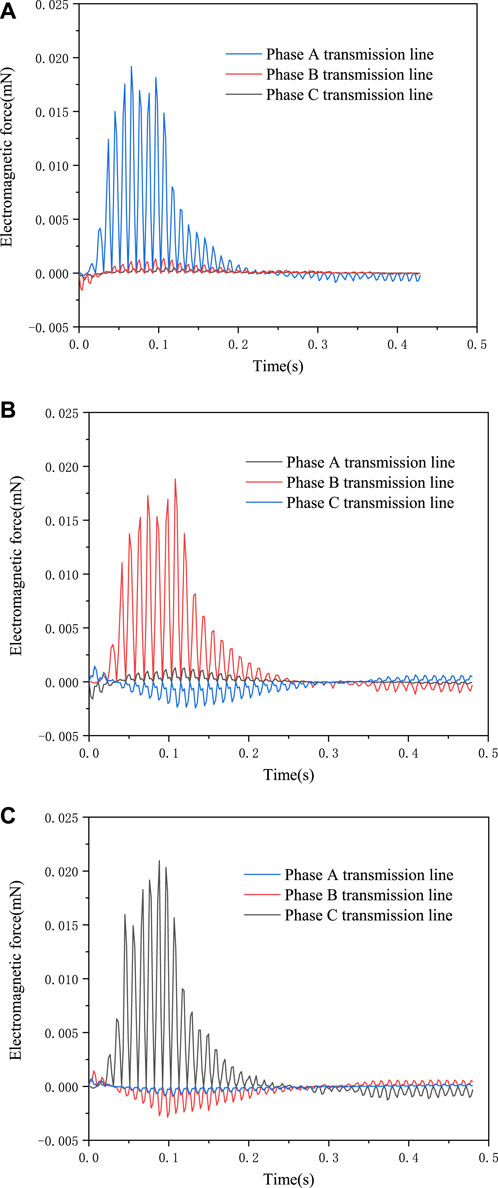
FIGURE 11. Variation in electromagnetic forces on the conductor by the arc versus fault phases. (A) Phase A; (B) Phase B; and (C) Phase C.
From Figure 11, it can be inferred that the electromagnetic force generated by the phase conductor is several times greater than that of the other phase conductor. Although the position of the other phase conductors in close proximity has a certain effect, the dominant factor is still the electromagnetic force generated by the fault phase conductor itself. Comparing Figures 11A–C, the arc occurs in different phases, but the electromagnetic forces are quite similar, and the fault phase has few effects on arc motion.
The arc root moves quickly on the lead conductor at the beginning. As it reaches the terminal of the lead conductor, the ending position of the arc root determines the initial length and angle of the arc, which has a great effect on the dead-zone arc movement. The effect of the arc root position on the conductor on the dead-zone arc movement is analyzed in this paper. The upper electric arc root position is on the overpass, and it is fixed at y = 0, as shown in Figure 3B; the ending position of the lower arc root on the lead conductor is fixed at y = 0. Assuming that the arc root stays in the conductor in the range of −0.5 m to 1 m, and the absolute value of its displacement in the x-axis is shown in Figure 12.
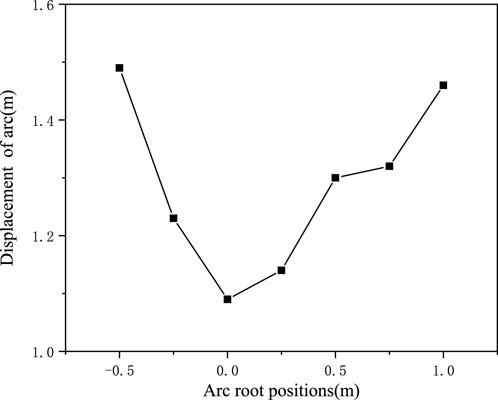
FIGURE 12. Maximum displacement of the arc on the x-axis direction versus arc root positions.
It can be seen that the closer the arc root position is, the closer the arc spreads on the x-axis. The position of the arc root is set in the range of y = 0.5 m–1 m, and the furthest displacement of the arc is reduced, but the magnitude of the reduction is negligible. In the range of y = −0.5 m to 0.5 m, the furthest displacement of the arc is reduced more obviously. The electromagnetic force generated on the x-axis by the arc root at y = −0.5 m, 0 m, and 0.5 m for the current phase conductor and the total electromagnetic force applied to the arc on the x-axis are plotted, as shown in Figure 13.
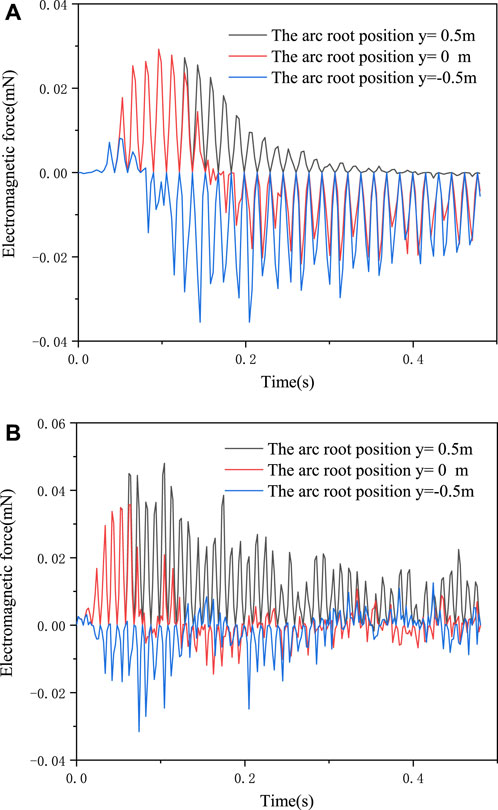
FIGURE 13. Electromagnetic force on the x-axis direction. (A) Electromagnetic force generated by the fault phase conductor in the x-axis direction; (B) total electromagnetic force exerted on the arc in the x-axis direction.
From previous analysis, it can be seen that the arc is mainly subjected to the electromagnetic force generated by the fault phase conductor and the arc body itself. (i) When the arc root is at y = 0.5 m, the electromagnetic forces resulting from the phase conductor are mostly positive, and the force acting on the arc along the x-axis is mainly positive as well; (ii) when arc root is at y = 0 m, the electromagnetic forces from the phase conductor become negative in the later stages of motion, leading to both positive and negative electromagnetic forces acting on the arc along the x-axis, causing the arc’s maximum movement distance along the x-axis to shorten; (iii) when the arc root is at y = 0.5 m, the electromagnetic forces from the phase conductor are negative, and the electromagnetic forces acting on the arc along the x-axis are mostly negative as well. This causes the arc to move to the other side, and its movement distance is not significantly different from when the arc root is at y = 0.5 m. It indicates that the position of the arc root has a great effect on the movement of the arc. When the distance between the upper and lower arc roots of the arc is closer, the relative displacement of the arc motion is smaller and vice versa.
The inclination angle θ of the conductor will affect the direction of the electromagnetic force and thus the motion of the electric arc. In practice, the inclination angle often has a certain range. Suppose θ is in the range from 0° to 30°, seven cases are computed by changing the inclination angle of the conductor with respect to the horizontal plane θ to study the trend of motion of the arc in the dead zone. The maximum displacement of the electric arc in the x-axis direction at various inclination angles is plotted, as shown in Figure 14.
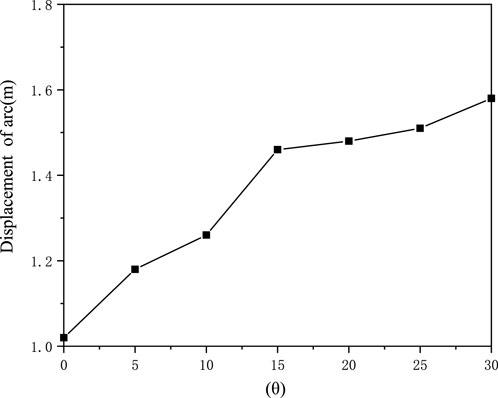
FIGURE 14. Maximum displacement of the electric arc in the x-axis direction versus inclination angle of the conductor.
Clearly, as the inclination angle increases, the maximum displacement of the electric arc in the x-axis direction also increases. If the inclination angle θ = 0°–15°, the displacement of the arc under the same angle change is larger. If the inclination angle θ = 15°–30°, it becomes relatively smaller.
Figure 15A shows that the larger the inclination angle θ, the greater the electromagnetic force in the direction of the x-axis applied to the arc. If the inclination angle is in the range of θ = 0°–15°, the difference in the electromagnetic force applied to the arc under the same angle change is larger; if the inclination angle is in the range of θ = 15°–30°, the difference in the electromagnetic force applied to the arc under the same angle change is relatively small, as shown in Figure 15B. The larger the difference in the electromagnetic force applied to the arc, the larger the displacement gap of the arc motion, which is consistent with the trend shown in Figure 14.
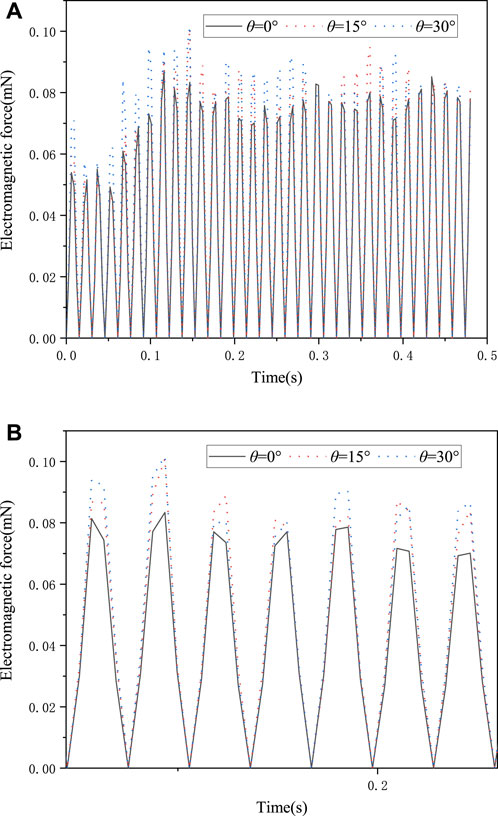
FIGURE 15. Variation in electromagnetic forces versus conductor inclination angle. (A) Total electromagnetic force generated in the x-axis by the conductor; (B) part of the electromagnetic force on the conductor in the x-axis.
The conclusions of this study are summarized as follows:
The movement of the fault electric arc in the dead zone of a substation is complicated. During the early and middle stages, the movement is primarily influenced by the electromagnetic force resulting from the overpass and conductor. Both the upper and lower arc roots are subjected to a larger force, and hence their speed is much faster than that of the arc column. The arc is concave in shape. In the later stage, the arc is mainly influenced by the electromagnetic force generated by the arc body, and the electromagnetic force drives the arc to many directions, resulting in an irregular trajectory and complex shapes.
The electromagnetic force stressed on the electric arc is mainly attributed to the fault phase conductor and the electric arc body itself. Those from the other phase conductors in close proximity on the arc motion are minor and can almost be ignored. The maximum spreading distances of the arc for three phases are close to each other.
The initial position of the arc root has a certain impact on the movement of the electric arc. Within the range of relatively close proximity between the upper and lower arc roots, the arc spreads to other phases in a shorter distance compared to other positions. The dead-zone conductor is suggested to be covered by insulating materials, the presence of which is able to restrict the arc root movement, and the arc is maintained in an appropriate position within the dead zone. Meanwhile, the inclination angle of the conductor affects the direction of the electromagnetic force. If the conductor is laid horizontally, the electric arc is subjected to a smaller force. Such inclination is able to lower the risk of the electric arc and prevent the spread of the electric arc to the neighboring phases.
The original contributions presented in the study are included in the article/Supplementary Material; further inquiries can be directed to the corresponding author.
JT: funding acquisition, investigation, project administration, and writing–review and editing. YZ: data curation, investigation, project administration, and writing–review and editing. DC: conceptualization, writing–original draft, and writing–review and editing. JS: funding acquisition, project administration, software, visualization, and writing–review and editing. SW: conceptualization, data curation, formal analysis, supervision, validation, and writing–review and editing. WH: methodology, resources, validation, and writing–review and editing.
The authors declare that this study received funding from the Science and Technology Project of State Grid Jiangsu Electric Power Co., Ltd. (No. J2022134). The funder was not involved in the study design, collection, analysis, interpretation of data, the writing of this article, or the decision to submit it for publication.
Authors JT, YZ, and JS were employed by State Grid Yangzhou Power Supply Company.
The remaining authors declare that the research was conducted in the absence of any commercial or financial relationships that could be construed as a potential conflict of interest.
All claims expressed in this article are solely those of the authors and do not necessarily represent those of their affiliated organizations, or those of the publisher, the editors, and the reviewers. Any product that may be evaluated in this article, or claim that may be made by its manufacturer, is not guaranteed or endorsed by the publisher.
Chen, D., Xia, Y., Liu, W., and Mantuano, S. (2014). Analysis and discussion of a dead-zone protection mal-operation case in Brazil. J. Mod. Power Syst. Clean Energy 2 (1), 87–91. doi:10.1007/s40565-014-0044-4
Cong, H., Han, D., Wang, S., Qiao, L., and Li, Q. (2022). Experimental study on the extinction characteristics of secondary arc under different secondary arc currents near outdoor insulator. IEEE Trans. Dielectr. Electr. Insulation 29 (1), 103–110. doi:10.1109/tdei.2022.3148433
Cong, H., Li, Q., Chen, Q., and Xing, J. (2015b). Spatial dynamics modeling of the secondary arcs with power transmission lines. Int. J. Appl. Electromagn. Mech. 47 (3), 737–746. doi:10.3233/jae-140079
Cong, H., Qingmin Li, , Jinyuan, X., and Siew, W. H. (2015a). Modeling study of the secondary arc with stochastic initial positions caused by the primary arc. IEEE Trans. Plasma Sci. 43 (6), 2046–2053. doi:10.1109/tps.2015.2422777
Cong, H., Wang, S., Zhao, W., Han, D., and Li, Q. (2022). Extinction accelerating device of secondary arc design based on wind load. IEEE Trans. Plasma Sci. 50 (5), 1291–1300. doi:10.1109/tps.2022.3165161
Dong, K., Wu, G., Qian, P., Xu, Z., Ma, Y., Yang, Z., et al. (2023). Research on dynamic characteristics of arc under electrode relative motion. Plasma Sci. Technol. 25 (4), 045502. doi:10.1088/2058-6272/ac9ddf
Gu, S., Jinliang, H., Bo, Z., Guozheng Xu, , and Shejiao Han, (2006a). Movement simulation of long electric arc along the surface of insulator string in Free Air. IEEE Trans. Magnetics 42 (4), 1359–1362. doi:10.1109/tmag.2006.871424
Li, K., Lin, J., Niu, F., Wang, Y., Li, Q., Guo, Z., et al. (2021). A novel fault leakage current detection method with protection dead zone elimination. IEEE Trans. Instrum. Meas. 70, 1–9. doi:10.1109/tim.2020.3035257
Li, M., Gong, P., Yang, H., and Guo, P. (2019). Investigation on the pressure rise and energy balance due to fault arcs in a closed container filled with different insulating gases. IEEE Trans. Plasma Sci. 47 (12), 5226–5233. doi:10.1109/tps.2019.2950331
Li, R., Liu, H., Lou, X., Song, P., Hou, W., Dai, S., et al. (2023). Study on the breakdown characteristics of multiple-reignition secondary arcs on EHV/UHV transmission lines. IEEE Trans. Plasma Sci. 51 (4), 1164–1172. doi:10.1109/tps.2023.3252799
Liang, J., et al. (2023). Research on deadzone fault and prevention measures of 110kV transformer. Electr. Switch 61 (02), 84–86.
Lin, X., Zheng, Y., Tong, N., Li, Z., and Sui, Q. (2021). Fast mutual-speed-up protection adaptive to dead-zone grounding-fault identification for VSC-MTDC. IEEE Trans. Power Deliv. 36 (6), 3393–3403. doi:10.1109/tpwrd.2020.3040493
Murphy, A. B. (1995). Transport coefficients of air, argon-air, nitrogen-air, and oxygen-air plasmas. Plasma Chem. Plasma Process. 15 (2), 279–307. doi:10.1007/bf01459700
Sun, G., et al. (2022). Research on differential bus dead zone protection of 4 Busbar based on the new six-unification standard, 2022 IEEE Asia-Pacific Conference on Image Processing, Electronics and Computers (IPEC).14-16 April 2021, China, IEEE.
Tanaka, S., and Matsumura, T. (2009). Simulation method of column behaviour on long gap free arc in air. IEEJ Trans. Power Energy 129 (7), 921–928. doi:10.1541/ieejpes.129.921
Tang, D. H., Chen, Y. M., and Cao, B. (2014). Relay protection scheme of rapid removal of 220kV transformer fault. Automation Electr. Power Syst. 38, 115–122.
Wang, F. G., Li, L., and Lv, H. (2021). Optimized solution scheme of bus protection for dead zone fault. Electr. Power Autom. Equip. 41, 219–224.
Wu, Y., and Lianjin, K. E. (2017). A survey of relay protection for high voltage dead-zone fault. Power Syst. Prot. Control 45, 148–154.
Keywords: renewable energy, substation, electric arc, dead zone of protection, fault propagation, electric arc root
Citation: Teng J, Zhang Y, Chen D, Sheng J, Wang S and Huang W (2024) Motion behavior of a high-current fault electric arc occurred in the dead zone of protection in a substation. Front. Energy Res. 12:1353617. doi: 10.3389/fenrg.2024.1353617
Received: 11 December 2023; Accepted: 17 January 2024;
Published: 08 February 2024.
Edited by:
Ting Wu, Harbin Institute of Technology, ChinaReviewed by:
Haoxi Cong, North China Electric Power University, ChinaCopyright © 2024 Teng, Zhang, Chen, Sheng, Wang and Huang. This is an open-access article distributed under the terms of the Creative Commons Attribution License (CC BY). The use, distribution or reproduction in other forums is permitted, provided the original author(s) and the copyright owner(s) are credited and that the original publication in this journal is cited, in accordance with accepted academic practice. No use, distribution or reproduction is permitted which does not comply with these terms.
*Correspondence: Danhua Chen, ZGFuaWVsY2hlbkBobnUuZWR1LmNu
Disclaimer: All claims expressed in this article are solely those of the authors and do not necessarily represent those of their affiliated organizations, or those of the publisher, the editors and the reviewers. Any product that may be evaluated in this article or claim that may be made by its manufacturer is not guaranteed or endorsed by the publisher.
Research integrity at Frontiers
Learn more about the work of our research integrity team to safeguard the quality of each article we publish.