 Donglai Tang
 Qiang Zhang1
95% of researchers rate our articles as excellent or good
Learn more about the work of our research integrity team to safeguard the quality of each article we publish.
Find out more
METHODS article
Front. Energy Res. , 26 January 2024
Sec. Smart Grids
Volume 12 - 2024 | https://doi.org/10.3389/fenrg.2024.1352356
This article is part of the Research Topic Planning, Operation and Control of Modern Power System with Large-scale Renewable Energy Generations, volume II View all 15 articles
The residential area refers to the power supply area from distribution transformers to the end users that contains multiple types of flexible resources, such as photovoltaics, energy storage, and power users. Focusing on the challenge of insufficient demand response incentives to multiple types of users in residential distribution areas, a tiered incentive price-based demand-side aggregated response method is proposed in this paper. Users in residential distribution areas are classified with an improved k-means clustering method for obtaining typical types of users. Thereafter, initial scores of users are calculated, and their grades are assigned based on their scores. Corresponding tiered incentive prices are designed for different grades. On this basis, a leader–follower game is proposed to obtain the demand response base price, and tiered incentives are provided to users of different grades to increase their enthusiasm for participating in demand response. In the case study, an actual urban residential distribution area is studied. The results show that the proposed user clustering method has an accuracy of 99.8% in classifying users in a residential distribution area. In addition, the proposed method has better performance in terms of improving the benefit of the load aggregator and users in the residential distribution area compared with methods such as potential game, hidden Markov, and Monte Carlo. Specifically, from the results, the benefit of load aggregators is increased by 101.96%, 76.07%, and 112.37%, and the income of the users is increased by 54.51%, 36.94%, and 64.91%.
Through guiding and motivating power users to proactively optimize their energy consumption behaviors and trading strategies in markets, while exploring the response potential of demand-side flexible resources in depth, demand response (DR) can help mitigate the gap between load peak and load valley, smooth the load curve, support power grid operation and regulation, and maintain the dynamic balance of supply and demand. DR has become an important promotion to the revitalization of massive demand-side flexible resources and development of emerging power systems (Chen et al., 2022). With the widespread connection of distributed resources in residential distribution areas (RDAs) and continuous improvement of power distribution automation levels, DR programs gradually extend from commercial buildings and industrial parks to cover controllable energy resources, such as rooftop photovoltaics and energy storage systems (Urban et al., 2019; Pan et al., 2020). However, because resources of users in RDAs are usually widely dispersed, the response potential of a single user is limited, the current market entry threshold is relatively high, direct control is not fully realized, and a large number of DR resources have not been fully exploited. Therefore, using the idea of aggregation to integrate resources in RDAs and fully exploiting the scale effect to promote DR has become the key to promote source–load interaction (Klaucke et al., 2020; Preeti et al., 2022; Tan and Zeng, 2022).
The RDA users mainly include power users, rooftop photovoltaic users, and users with energy storage. The number of these users is large. However, their individual capacities are small, and they hardly participate in the DR independently. The RDA load aggregator participates on behalf of users in the DR programs. Through guiding contracted users to proactively change their energy consumption behaviors (Wang BB. et al., 2022; Fan et al., 2022), the RDA load aggregator achieves flexible regulation of resources in the RDA, such as rooftop photovoltaics, energy storage systems, and controllable loads (Hassanniakheibari et al., 2020; Zhang et al., 2021), while maximizing the benefit. However, due to limited participation willingness of RDA users caused by lack of incentives (Duan et al., 2021), the effectiveness of DR programs is not as expected. Therefore, effective incentive mechanisms for multiple types of RDA users are urgently needed.
In recent years, incentive-based DR programs have been extensively studied. Guo et al. (2020) elaborates on the construction of an incentive-based DR model between a single load aggregator and multiple RDA users. RDA users receive incentives through the load aggregator’s DR compensation. However, in Guo et al. (2020), RDA users are regarded as static price takers and their dynamic price bidding features cannot be reflected.
Qi et al. (2022); Striani et al. (2021) considered the dynamic response characteristics of RDA users and designed a method for load aggregators to guide RDA users to participate in the DR. It solves the problem of the dynamic bidding adaptability of RDA users through dynamic parameters, but this method lacks the analysis of users’ willingness of participating in the DR. Wei et al. (2021); Xu et al. (2021); Sun et al. (2022) analyzed the correlation between user response willingness and RDA response potential. Then, a comprehensive DR optimization incentive strategy is designed, using a multi-period subsidy strategy to increase user enthusiasm for participating in the DR. However, this method focuses on the exploration of a single DR incentive measure, and the willingness of different types of RDA users to participate in DR varies significantly. Therefore, exploring the DR incentive mechanism for multiple types of users is of significance for promoting the DR participation of the RDA.
Designing reasonable incentives is the key to fully exploring the system’s flexibility, maintaining the dynamic balance of supply and demand, and effectively motivating users to participate in DR. To this end, from the perspective of the RDA load aggregator, users in an RDA are classified and graded to different levels. On this basis, a tiered incentive price-based demand-side aggregated response method is proposed. In addition, the impacts of different incentives on multiple types of users are revealed.
The contributions of this paper are threefold:
(1) An RDA user classification method based on an improved k-means clustering algorithm that improves the accuracy of RDA user classification by dynamically adjusting the number of clusters to adapt data volume is proposed.
(2) An RDA demand response pricing model based on a leader–follower game between load aggregators and multi-type RDA users is proposed, through which the optimal benefit for all participants can be achieved.
(3) Incentive mechanisms for multiple types of RDA users are designed to increase their enthusiasm in participating in DR.
The structure of the RDA low-voltage distribution network takes edge computing as the core, forming a source–grid–load–storage collaborative and interactive system. By relying on intelligent integrated terminals, plug and play, situational awareness, intelligent interaction, and collaborative control (Sheng et al., 2021; Avordeh et al., 2022; Gharibshah and Zhu, 2022) of resources in an RDA, such as rooftop photovoltaics, electric vehicle charging piles, and household energy storage systems, can be realized. The structure is shown in Figure 1.
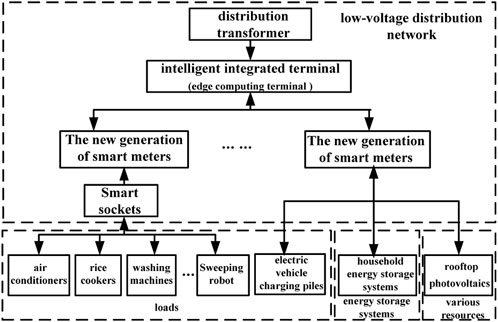
FIGURE 1. Structure of the RDA low-voltage distribution network.
The intelligent integrated terminal is an edge computing terminal developed by the State Grid Company of China in 2019 and an open platform that integrates data aggregation, edge computing, and intelligent applications. It now serves as the main carrier for the RDA to participate in DR (Yang et al., 2022). Data aggregation is realized through applying AC sampling, high-speed power line carriers, micro-power wireless, and other advanced methods. Data are collected from various sources, such as loads and energy storage systems, in an RDA. In addition, edge computing and applications are deployed with the software development platform, realizing multiple types of users in the RDA being able to participate in DR.
The new generation of smart meters is an energy router developed by the State Grid Company in 2020 that integrates data collection, communication, and control functions (Rashidizadeh-kermani et al., 2020). The smart meter can accept DR control tasks sent by intelligent integrated terminals and issue energy control instructions to various resources, loads, and energy storage systems in an RDA.
Smart sockets, as a household appliance energy control device, can collect energy consumption data of household appliances, such as air conditioners, rice cookers, and washing machines, and perform intelligent control to those household appliances, such as tripping and power consumption adjustment, based on DR instructions issued by the smart meter (Zheng et al., 2022).
The tiered RDA DR is a user-level incentive program. After the RDA load aggregator receives the DR request from the main grid, it adjusts the power according to the capacity of the users’ interruptible and adjustable loads, the generation of rooftop photovoltaics, and the stored energy of the energy storage system. The compensation price is adjusted according to the grades of the users for increasing their enthusiasm in DR participation.
The framework of the tiered incentive price-based demand-side aggregated response method in the RDA is shown in Figure 2.
(1) User classification and grading
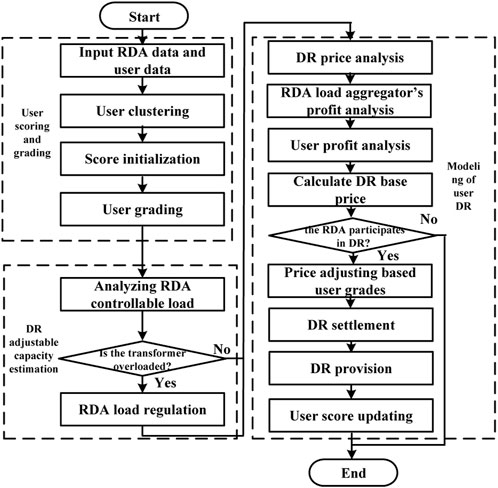
FIGURE 2. RDA demand response framework.
First, clustering analysis is conducted based on the characteristics of RDA users and classifies user grades based on their initial credits.
(2) Measuring RDA adjustable power
The characteristics of the RDA adjustable loads are analyzed, and the adjustable power from resources, including rooftop photovoltaics, home energy storage systems, interruptible loads, and adjustable loads, is calculated. On this basis, the overload status of the distribution transformer is monitored. When overload happens, the RDA emergency program is activated and the load is regulated to reduce the power through the transformer.
(3) RDA user demand response model
The RDA aggregator conducts load aggregation and user benefit analysis based on the DR instructions sent by the main grid and determines the baseline DR strategy. Then, the RDA aggregator determines if the RDA participates in the DR. If yes, the RDA aggregator formulates a tiered DR strategy based on the number and grades of users that participate in the DR in the RDA and organizes users to follow instructions according to grades. After demand response, compensations to users are settled and the grades of users participating in DR are adjusted for increasing their enthusiasm for future participation.
The RDA demand response program is designed to motivate RDA users to actively participate in DR, alleviate distribution line congestion, and guarantee RDA peak load supply. Different household users have different response willingness. For example, high-income household users may show lower DR willingness. Based on the characteristics shown by the daily load profiles of RDA users, Liu et al. (2020); Liu H. et al. (2022) classified them into afternoon and evening peak load, evening single peak, afternoon peak load, and evening sub-peak load and identified the degree of willingness of RDA users. In this section, RDA users are classified to explore the degrees of their willingness in participating in DR.
Since 2016, the State Grid Company has been carrying out the construction of the “Friendly Interaction between Supply and Demand” project. By upgrading the low-voltage power line high-speed carrier (HPLC) module, the energy consumption data of RDA users on a time scale of 15 min can be collected. This lays the foundation of data for RDA users interacting with the main grid (Wan and Song, 2021).
In order to improve the accuracy of RDA user classification, clustering features are selected following the typical recommendation from the Electric Power Industry Association, as shown in Table 1.
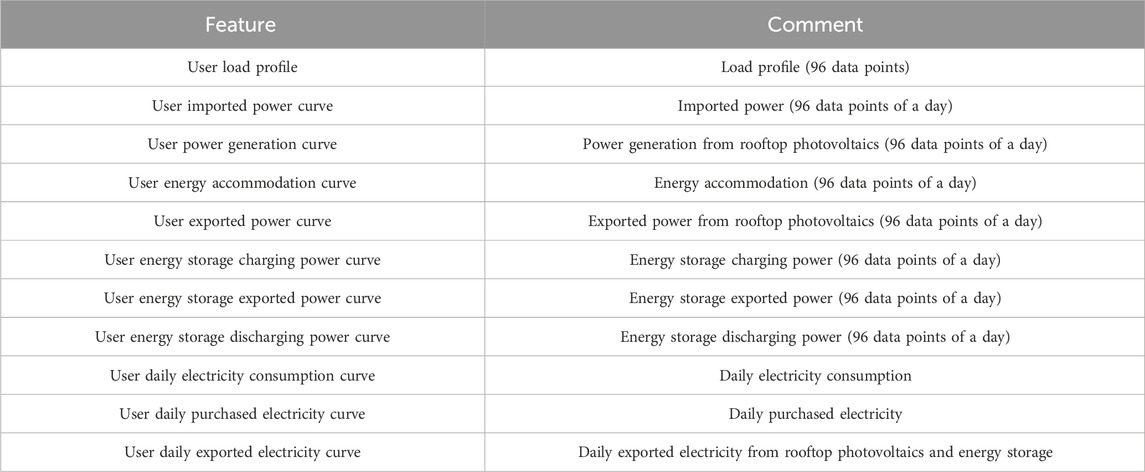
TABLE 1. Clustering features of RDA users.
The k-means clustering method is an unsupervised iterative clustering method. This method can divide the data into k clusters. First, k users are randomly selected as initial cluster centers. Then, each remaining user is assigned to a cluster based on the distances to the cluster centers, and thereafter the cluster centers are updated. This process is repeated until convergence (Zhao et al., 2020). The k-means clustering method has a high efficiency and a relatively high accuracy, which makes it widely used. However, the k, namely the number of clusters, needs to be determined in advance, which is difficult. To this end, in this section, the traditional K-means clustering algorithm is improved so that it can dynamically adjust the number of clusters, being adaptable to the number of users in clusters. In other words, when the number of users in a cluster is less than a certain threshold, the cluster will be merged into others. When the number of users in a certain cluster is too large, the cluster will be split into two.
The steps of the improved k-means clustering algorithms are as follows:
Step 1. Randomly select k RDA users as the initial clustering centers.
Step 2. Calculate the Euclidean distance Dj(k) of each RDA user to the cluster center, as in Eq. 1, where Xj represents the values of clustering features, and assign each RDA user to the nearest cluster.
Step 3. Based on the number of clusters after Step 2, if in any cluster, the number of users is less than the threshold Δy, the cluster is removed, and all users in it are assigned to the other clusters according to their Euclidean distances.
Step 4. With the RDA users’ feature values, update the cluster centers Zj(k) as in Eq. 2. In Eq. 2, Fj is the number of users in the jth cluster, and cRDA represents the feature values.
Step 5. Determine whether a cluster needs to be split with Eq. 3, where △a represents the cluster splitting threshold. If Eq. 3 is satisfied, perform cluster splitting. In Eq. 3, △a is the splitting threshold.
Step 6. Determine whether clusters need to be merged with Eq. 4, where △b represents the cluster merging threshold. If Eq. 4 is satisfied, perform cluster merging. In Eq. 4, △b is the merging threshold.
Step 7. Calculate the squared error to check whether the convergence condition is met. The squared error of the jth cluster can be calculated as in Eq. 5.
When the square error is less than the preset threshold over iterations, the algorithm is terminated, and RDA user classification is obtained.
In this paper, different DR incentive prices are adopted for users with different scores. As an example, Wang L. et al. (2022) scores positive points for users consuming electricity at load valley periods and negative points at load peak periods. We adopt a 100-point system for scoring users. The incentive area is 60–100 points, within which the RDA load aggregator is rewarded on the basis of the benchmark DR price, and the penalty area is 0–59 points, within which the RDA load aggregator is punished on the basis of the benchmark DR price.
With the user’s initial score according to the features of RDA users and typical weights from the industry association as shown in Table 1, a user’s standard score can be calculated as in Eq. 6.
In Eq. 6, nRDA is the number of RDA users; dFEA i represents the feature values of RDA users; and wj represents the weights corresponding to the features.
The initial score of a user can be calculated as in Eq. 7, where dR i is the industry typical value of the features of different types of RDA users and 60 is the passing score in the 100-point system.
The RDA aggregator designs the grades, corresponding score ranges, and floating price scales referring to the standards from the Electric Power Industry Association. Clustering results based on features in Table 1 determine the types of users, and each type has the categories as shown in Table 2.
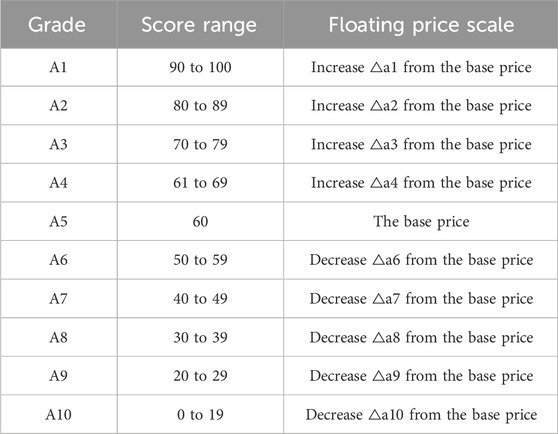
TABLE 2. Tiered demand response incentives to RDA users.
As given in Table 2, users with different scores will be assigned to different grades and have different floating prices which are designed for providing diverse incentives.
RDA controllable resources include, but are not limited to, residential loads, rooftop photovoltaics, and energy storage systems. Residential loads can be divided into two categories: non-controllable and controllable. The former includes lighting loads and televisions which will not participate in DR. Controllable loads can be further divided as interruptible and adjustable. Interruptible loads can be interrupted during operation, and adjustable loads can adjust the power consumption in a certain range. Typical controllable loads are shown in Table 3.
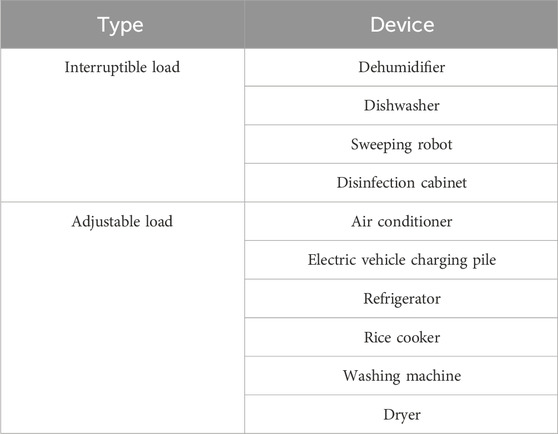
TABLE 3. Typical controllable loads of RDA users.
The interruptible power of RDA users, PINT(t), can be calculated as in Eq. 8.
In Eq. 8, mINT is the number of interruptible loads participating in DR in the RDA and pUNIT i(t) is the interruptible power of different PRD interruptible loads in time interval t. The range of the interruptible power from RDA users is 0 to PINT(t).
The adjustable power of RDA users, PREG(t), can be calculated as in Eq. 9.
In Eq. 9, mREG is the number of adjustable loads that participate in DR; pUREG i(t) is the rated power of adjustable loads of RDA users; λi represents the power reduction ratios of adjustable loads of different RDA users; and tREG i represents the adjustable load power ratios of different RDA users. During time interval t, the adjustable power range of RDA users is 0 to PREG(t).
When the total RDA load is greater than the rated capacity of the distribution transformer, distribution transformer overload happens. A traditional dry-type transformer can only operate for 60 min, being overloaded by 20% (Liu ZH. et al., 2022). In severe cases, the distribution transformer will be burned out, resulting in a power outage. Therefore, load regulation should be conducted at the first time, when the distribution transformer is overloaded. In this paper, the overload time of the transformer is set to 1% of the typical value, namely, 0.6 min, to prevent from burning out.
When the distribution transformer is overloaded, the RDA load aggregator implements the RDA emergency load control strategy to reduce the RDA load within the normal operating range of the distribution transformer. This leads to no compensation to RDA users. During the overload period of the distribution transformer, the reduced load POL(t) can be represented as in Eq. 10.
In Eq. 10, PPV(t) is the power generation that can be provided by the rooftop photovoltaics and PES(t) is the power from energy storage discharging.
The essence of RDA demand response is that after the RDA load aggregator receives the instructions from the main grid, it estimates the capacity of available DR and determines whether participating in DR can be profitable. If yes, it will organize users in the RDA to participate in DR. The compensation prices will be adjusted according to the user grades to increase the enthusiasm of RDA users to participate in DR.
In this paper, the load aggregators are of two levels: the transformer distribution area level and regional level. The transformer distribution area level load aggregators are responsible for integrating RDA resources within the scope of a single distribution transformer, and the regional load aggregators are responsible for further integrating the load aggregators of transformer distribution areas. Controllable loads are aggregated by aggregators to participate in DR, and RDA users of different types are incentivized as in Table 2. RDA users’ photovoltaic and energy storage systems can sell electricity to load aggregators for profit.
The comprehensive income function of a regional level load aggregator, fAREA, can be formulated as in Eq. 11, where mRDA is the number of residential distribution areas of distribution area level load aggregator and fRDA i represents the incomes of transformer distribution area level load aggregators.
The income function of a distribution area level load aggregator can be formulated as in Eq. 12.
In Eq. 12 to Eq. 14, fGET is the profit of the load aggregator obtained from the main grid operator for participating in DR; fBUYU is the compensation to users in the RDA for participating in the DR; fBUYPE is the compensation from the load aggregator to the RDA users for using the rooftop photovoltaics and energy storage in participating in DR; pUSER i(t) is the power of different RDA users during the DR period; vUSER represent the prices for different RDA users to participate in DR; mPE is the number of rooftop photovoltaics and energy storage systems in the RDA; pPE i(t) represents the power from the rooftop photovoltaics and the energy storage system in the DR period; and vPE i represents the price for the rooftop photovoltaic and the energy storage system for exporting power to the main grid.
The constraint of the adjustable load can be formulated as in Eq. 15, where pRPL i(t) is the rated power of the RDA transformer.
RDA DR pricing is to set the benchmark price for RDA users in DR. When the RDA load aggregator benefits from participating in DR, it obtains the price from the equilibrium of the game considering the DR price from the main grid, energy export prices to rooftop photovoltaic generation, and energy export prices to energy storage discharging. The equilibrium will be used to derive the DR base price.
The leader–follower game is a static game model with complete information. The leader takes the lead in making decisions, and the followers make decisions based on the leader’s decisions. The above process is repeated until a Nash equilibrium is reached (Huang et al., 2023) to maximize the benefits of participants. The leader–follower game is a classic game model with the advantages of high efficiency, flexibility, and reliability and has been widely used in the field of power systems. Based on the user classification results, this section uses the leader–follower game to implement the demand response pricing game between the RDA load aggregator and RDA users of different types. In the game, the RDA load aggregator is considered the leader, and different types of RDA users who participate in DR through load adjustment, rooftop photovoltaic power generation, and energy storage system discharging are considered followers. After several iterations, the game is terminated when reaching the Nash equilibrium, achieving optimal benefits for the leader and the followers.
The objective of the RDA demand response pricing game, zSG, can be formulated as in Eq. 16.
In Eq. 16 to Eq. 17, lRA, lUSER, lPV, and lES represent the RDA load aggregator, RDA users participating in DR load reduction, rooftop photovoltaic power generation, and energy storage discharging, respectively. Different types of RDA users have different capacities on load reduction, rooftop photovoltaic power generation, and energy storage discharging. {lUSER 1, lUSER 2, …, lUSER m} represent the m categories of RDA users who participate in DR load reduction; {lPV 1, lPV 2, …, lPV m} represent the m categories of RDA users who participate in rooftop photovoltaic power generation; and {lES 1, lES 2, …, lES m} represent the m categories of RDA users participating in energy storage discharging. rRA, rUSER, rPV, and rES are the price bidding strategies of the above four game participants, respectively. vINIT and vRAP are the DR basic price and reward/penalty incentive price for the RDA load aggregator, respectively. In addition, pUSER i(t) represents the power consumption of RDA users participating in DR load reduction; pPV i(t) is the power consumption of RDA users participating in rooftop photovoltaic power generation; pEV i(t) is the power consumption of RDA users participating in energy storage discharging. QRA, QUSER, QPV, and QES are the utility functions of the RDA load aggregator, RDA users participating in DR load reduction, RDA users participating in rooftop photovoltaic power generation, and RDA users participating in energy storage discharging, respectively.
In the leader–follower game, the RDA load aggregator, RDA user rooftop photovoltaics, and RDA user energy storage systems take maximizing the utility as the objective. RDA users participate in the game, taking minimizing the utility as the objective. The iterative process is repeated until the Nash equilibrium is reached and game participants stop updating their strategies. The basic price vBASIC from the Nash equilibrium can be written as in Eq. 18.
In Eq. 18, pLUSER i(t) is the power consumption of RDA users in the Nash equilibrium solution; pLPV i(t) is the rooftop photovoltaic power generation in the Nash equilibrium solution; and pLES i(t) is the energy storage discharging power in the Nash equilibrium solution.
The power consumption of RDA users in the Nash equilibrium solution should satisfy Eq. 19.
The rooftop photovoltaic power generation pLPV should satisfy Eq. 20.
The energy storage discharging power pLES i should satisfy Eq. 21.
With the Nash equilibrium, the RDA load aggregator, RDA users, RDA rooftop photovoltaics, and RDA energy storage systems cannot gain more profit by unilaterally changing their strategy. The solving process of the game can be referred to Huang et al. (2020), and due to the space limitation, it is not repeated in this paper.
(1) Power constraint
In Eq. 22, pDR i(t) is the integrated power from the RDA load aggregator.
The power from rooftop photovoltaics and energy storage discharging should satisfy Eq. 23.
(2) Price constraint
The highest compensation price paid by the RDA load aggregator to RDA users, vMAX, should satisfy Eq. 24.
In Eq. 24, vGRID is the price sent by the main grid to the RDA load aggregator.
In order to avoid the fact that an RDA user’s willingness to participate in DR decreases after it already has a high score, the RDA demand response model proposed in this paper deducts scores after users enjoyed the DR incentives for realizing sustainable incentives to RDA users. The score adjustment rules, as shown in Table 4, are based on the typical settings of the power industry.
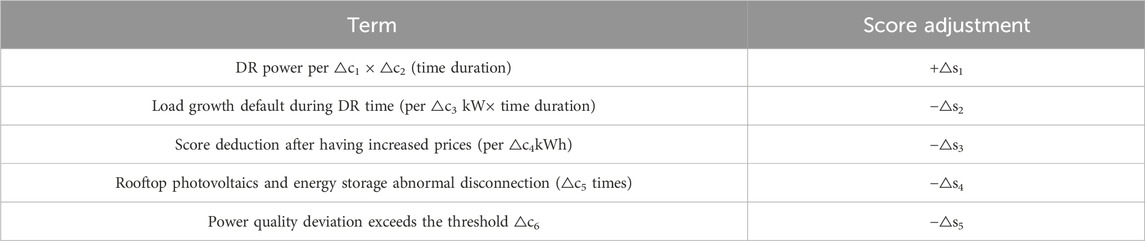
TABLE 4. RDA user score adjustment rules.
In the settlement, the RDA load aggregator updates the scores of RDA users according to Table 4 and adjusts the corresponding tiers. The adjusted scores, Ve, for RDA users can be calculated as in Eq. 25.
In Eq. 25, Vb represents the initial scores of RDA users; wa is the provided demand response; wb is the load growth default during DR time; wc is the score deduction after having increased prices; wd is the number of abnormal disconnections of rooftop photovoltaics and energy storage systems; we represents the power quality deviation of rooftop photovoltaic power generation and energy storage discharging. In addition, △s1, △s2, △s3, △s4, and △s5 are the score adjustments, as shown in Table 4.
With the real data from a residential distribution area in a city of China in June 2022, the proposed tiered incentive price-based demand-side aggregated response method is verified in this section. One residential distribution area corresponds to one distribution transformer. There are 18 distribution transformers in this residential area with a total capacity of 22.5 MVA. There are 6,120 residential users, including 516 users for rooftop photovoltaics, with a total capacity of 3.2 MW, and 672 users for energy storage systems. The total discharging power can reach 2.2 MW, and the total energy storage capacity is 3.6 MWh. The average solar irradiance is considered 4800 MJ/m-2. Tiered demand response incentives to RDA users and RDA user score adjustment rules are shown in Tables 5, 6. The cluster splitting threshold Δa and the merging threshold Δb are both set as 2. The proposed model is compared with mainstream methods such as potential game (Hong et al., 2020), hidden Markov (Kadadha and Otrok, 2021), and Monte Carlo (Zhang et al., 2020). The numerical simulation in this paper is implemented on a server with Intel Xeon Silver 4214R CPU and Windows Server 2019.
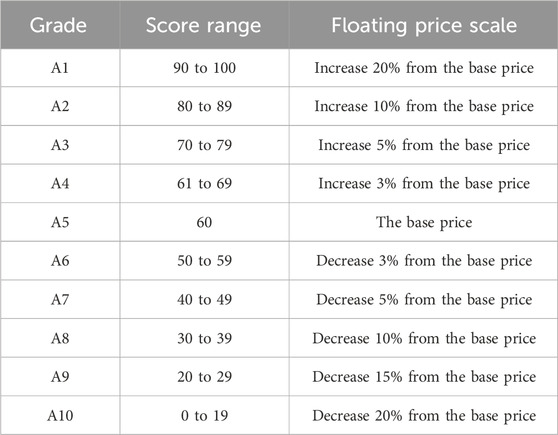
TABLE 5. Tiered demand response incentives to RDA users in the studied case.
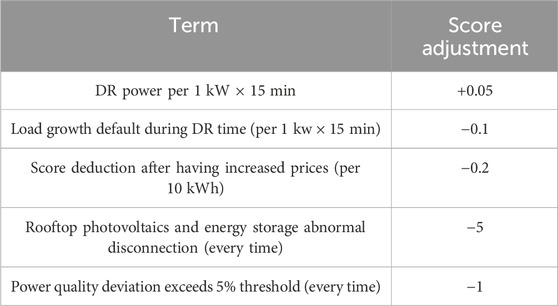
TABLE 6. RDA user score adjustment rules of the studied case.
This section classifies users based on the features shown in Table 1. The typical daily load profiles of users and the daily electricity consumption curves are shown in Figure 3. The classification results are shown in Table 5.
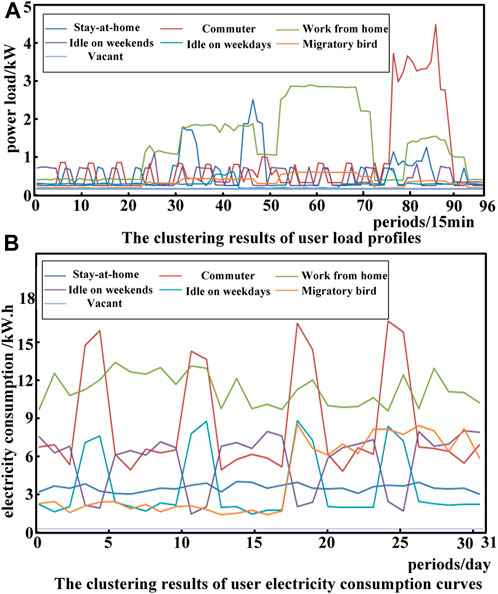
FIGURE 3. (A, B) Typical load profiles and daily electricity consumption curves of RDA users.
As shown in Figure 3; Table 7, RDA users can be classified into seven categories.
(1) Stay-at-home type
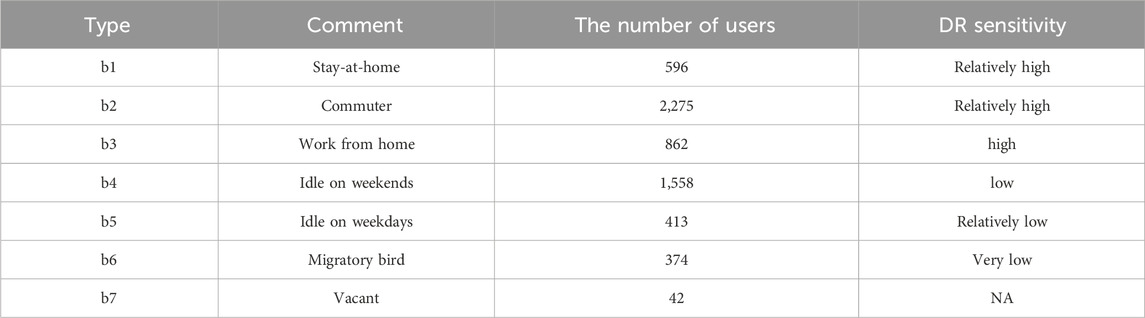
TABLE 7. RDA user classification result.
As shown in Figure 3A, these users have peak power consumption from 7:30 to 9:00, 11:00 to 12:30, and 19:00 to 21:30. The power consumption in other periods is low. As shown in Figure 3B , the daily electricity consumption of this type of users fluctuates slightly. As they always stay at home, they are more sensitive to DR incentives and are willing to participate in DR.
(2) Commuter type
As shown in Figure 3A, these users have peak power consumption between 19:00 and 22:30, and the power consumption in other periods is low. As shown in Figure A1B, the user consumes less electricity on weekdays than on weekends. These users are relatively sensitive to DR incentives and are willing to participate in DR.
(3) Work-from-home type
As shown in Figure 3A, these users have peak power consumption during 9:00–12:00, 14:00–18:00, and 20:30–23:00, and their daily electricity consumption fluctuates slightly. They are highly sensitive to DR incentives and are willing to participate in DR.
(4) Idle on weekends type
For this type of users, the statistical period is weekdays. As shown in Figure 3A, the peak electricity consumption hours are 7:00–8:00 and 18:00–22:00. As shown in Figure A1B, the electricity consumption of this type of users on weekdays is several times of that on weekends. The economic conditions of these users are good, and the DR participation willingness is not high.
(5) Idle on weekdays type
For this type of users, the statistical period is weekends. As shown in Figure 3A, the users go out to work, and the power load is small. As shown in Figure 3B, this type of user consumes less electricity on weekdays and consumes several times more on weekends. They usually have good economic conditions and low DR participation willingness.
(6) Migratory bird type
Migratory bird type means user absence during the part of the studied period. As shown in Figure 3A, during the study period, the power load of this type of users is small. As shown in Figure 3B, the electricity consumption of this type of users from the 18th to 31st is several times of that from the 1st to 17th. Usually, their economic conditions are good and their willingness to participate in DR is not high.
(7) Vacant type
As shown in Figures 3A, B, these users have no data. Therefore, they are not considered.
In order to ensure the fairness of user classification, experts are invited to classify users based on the typical classification specifications of the Community Housing Industry Association. The results are used as the benchmark to evaluate the classification accuracy. In addition, the proposed method is compared with the fuzzy c-means (FCM) method. Classification accuracy is defined as the degree of overlap with the benchmark result. A total of 500, 1,000, 2000, 3,000, 4,000, and 5,000 users are respectively used to verify the accuracy of the improved k-means clustering method proposed in this paper. The comparison of the results is shown in Figure 4.
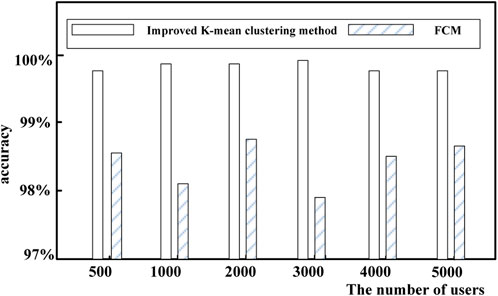
FIGURE 4. Accuracy of the classification result.
As can be seen from Figure 4, the accuracy of the improved k-means clustering method is 99.8%, while the accuracy of the FCM clustering method is 98.4%. This is because FCM determines the category that an RDA user belongs to through the membership function. When users of different types are unbalanced, i.e., the number of users in a certain cluster is much greater than the number of users in other clusters, the probability of new users being misclassified into a larger cluster will increase, resulting in larger errors.
Except for the 42 vacant users, the remaining 6,078 users are graded. The grading results are shown in Table 8.

TABLE 8. Grading results of RDA users.
In order to make the user scoring system operate effectively, the RDA load aggregator would balance the floating price scales to DR users and will use the fine from users in A6–A10 grades to reward users in A1–A4 grades. From Table 8, there are 3,029 users in A1–A4 grades whose DR benchmark price has been increased and 3,032 users in A6–A10 grades whose DR benchmark price has been decreased. The number of users whose DR benchmark price has been increased is close to that of users whose DR benchmark price has been decreased, ensuring that the scoring system operates effectively. In addition, there are 17 users of A5 grade, whose DR benchmark price remains unchanged.
The real-time DR price to the RDA load aggregator is 12 yuan/kWh, and the DR benchmark price is set as 9 yuan/kWh (Tu et al., 2020). On the basis of RDA classification, namely b1–b7 types, RDA users participate in DR load reduction, load reduction, rooftop photovoltaic generation, and energy storage discharging. The RDA aggregator updates the DR compensation price until the Nash equilibrium is reached. The process of the pricing game is shown in Figure 5.
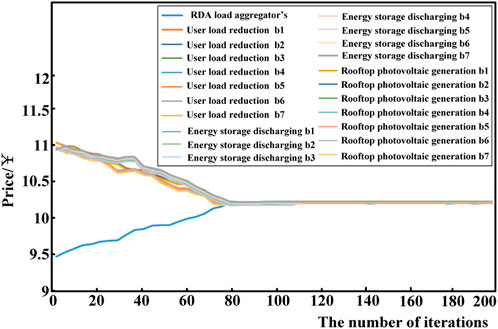
FIGURE 5. RDA demand response pricing game.
As shown in Figure 5, the RDA load aggregator’s initial DR price bidding is 9.5 yuan, and users in categories b1–b7 follow the load aggregator’s bidding for load reduction, rooftop photovoltaic generation, and energy storage discharging. The price range is between 10.9 yuan and 11.2 yuan. The load aggregator increases the price based on the price bids of b1–b7 users. This process repeats until the Nash equilibrium is reached after 80 iterations. The price corresponding to the equilibrium is 10.42 yuan/kWh.
With the Nash equilibrium, the final prices to RDA users in categories b1–b7 are adjusted based on the floating price scales according to their grades. Based on the DR base price of 10.42 yuan, the DR prices of different users are shown in Table 9.
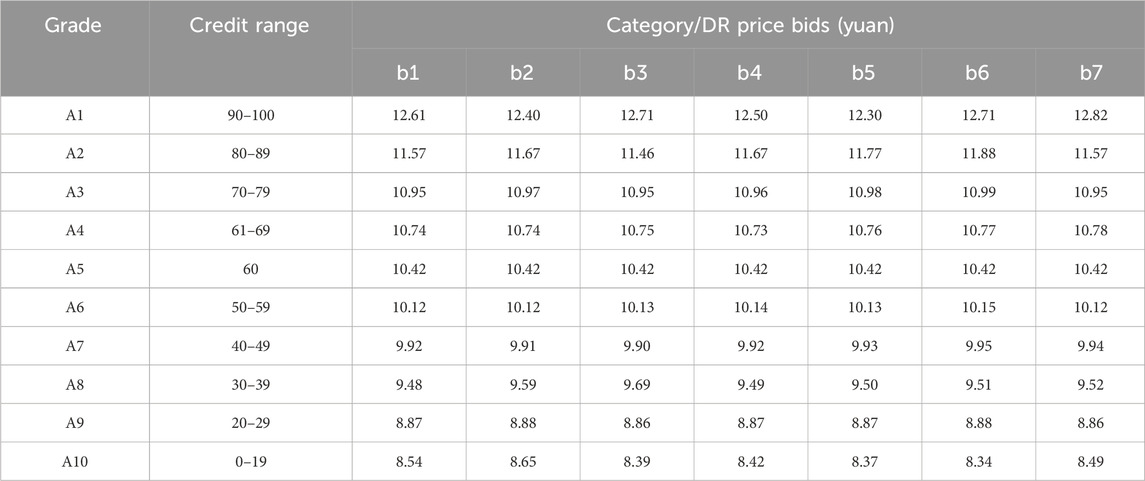
TABLE 9. Adjusted DR prices to RDA users of different types.
For simplicity, only the load profile of a transformer distribution area load aggregator is analyzed in this section. Comparisons are carried out with data of 21 June 2021. The method proposed in this paper is compared with the potential game method, the hidden Markov method, and the Monte Carlo method. The RDA load profiles are shown in Figure 6.
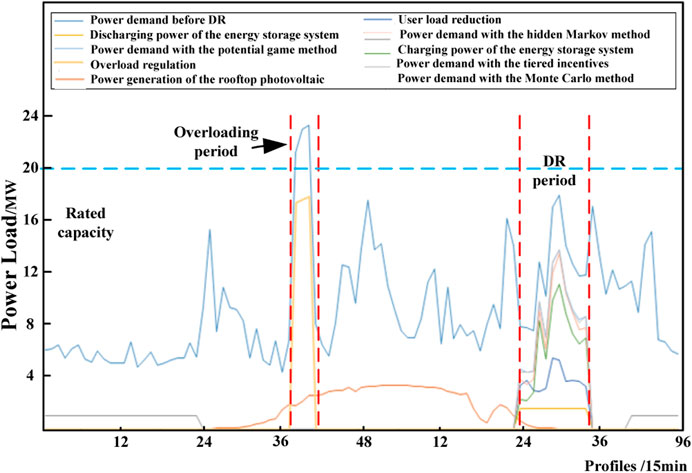
FIGURE 6. Load profile of the regional RDA load aggregator.
As shown in Figure 6, the transformer is overloaded during 9:30 to 10:00. The RDA load aggregator implements the emergency load control strategy to reduce the RDA load within the normal operating range of the distribution transformer. The RDA load aggregator participates in DR from 18:00 to 20:30. As shown in Figure 6, the load with the Monte Carlo method is higher, indicating that the DR effect is the worst. By comparison, the load with the proposed method is the lowest, which shows that it provides the best incentive to users in participating in DR.
The income of the RDA load aggregator in this demonstration residential area on 21 June 2021 is studied and compared with the results for the other three methods. The DR price to the RDA load aggregator from the main power is 12 yuan/kWh. The DR price from the load aggregator to users is 10.42 yuan/kWh. The aggregator’s income is equal to the price difference. The comparison results are shown in Table 10.
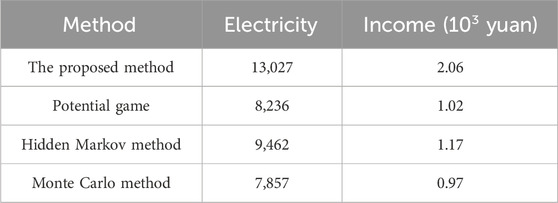
TABLE 10. Income comparison results.
As shown by the RDA load profile in Figure 6; Table 10, the load analyzed by the Monte Carlo method is obviously higher and the amount of electricity in DR is the least, 7,857 kWh. The load aggregator’s income is 9,700 yuan, which is the lowest among the four methods. The load profiles from the potential game and the hidden Markov method are higher than that from the Monte Carlo method. The amounts of electricity in DR are 8,236 kWh and 9,462 kWh. The RDA load aggregator’s incomes are 10,200 yuan and 11,700 yuan. The proposed method achieves the lowest load and maximizes the amount of electricity in DR power as 13,027 kWh. The load aggregator’s income is 20,600 yuan, which is the highest among the four methods. Compared with the potential game, the hidden Markov, and the Monte Carlo methods, the income is, respectively, increased by 101.96%, 76.07%, and 112.37%.
Similarly, the smaller the user’s load, the greater the amount of electricity in DR; conversely, the larger the user’s load, the smaller the amount of electricity in DR. The comparison results of the incomes of RDA users in different grades are shown in Table 11. It can be seen from Figure 5 and Table 11 that the load from the Monte Carlo method is the highest, leading to the lowest income of 81,870 yuan. The loads from the potential game method and the hidden Markov method are higher than that from the Monte Carlo method. The RDA users’ incomes are 87,380 yuan and 98,590 yuan. The proposed method gives the lowest load and the highest user income, which is 135,010 yuan. Compared with the potential game, the hidden Markov, and the Monte Carlo methods, the income is, respectively, increased by 54.51%, 36.94%, and 64.91%.
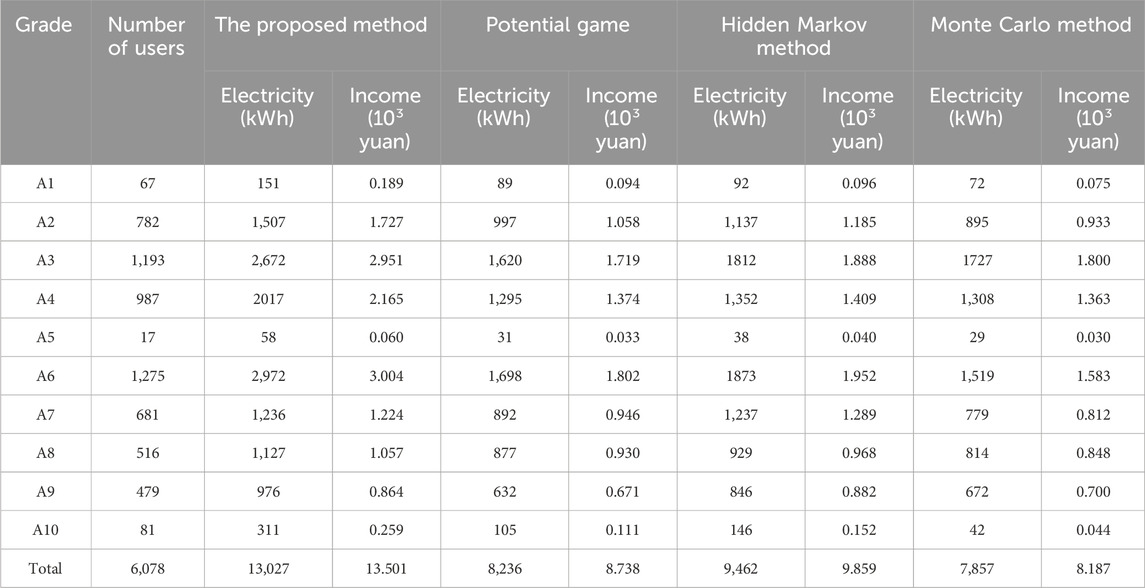
TABLE 11. Comparison of the incomes of RDA users.
Focusing on the problem of insufficient demand response incentives for multiple types of RDA users, a demand-side aggregated response method based on tiered incentive price is proposed. The proposed method is to improve the DR benefit of both load aggregators and users in the RDA. By classifying and grading users in the RDA, tiered incentives for users of different grades are provided to increase their enthusiasm for participating in DR. The case study shows a better performance of the proposed method compared to other demand response methods such as the potential game method, the hidden Markov method, and the Monte Carlo method. Specifically, the results demonstrate that the proposed user clustering method has an accuracy of 99.8% in classifying users in a residential distribution area. Compared with the potential game, the hidden Markov method, and the Monte Carlo method, from the results, the income of load aggregators is increased by 101.96%, 76.07%, and 112.37%, respectively, and the income of the users is increased by 54.51%, 36.94%, and 64.91%, respectively. Our future work is to improve the demand response capability of the entire RDA.
The raw data supporting the conclusion of this article will be made available by the authors, without undue reservation.
DT: methodology, software, supervision, and writing–original draft. QZ: supervision and writing–review and editing. TM: software and writing–review and editing. YO: data curation and writing–review and editing. LW: data curation, software, and writing–review and editing. JT: software and writing–review and editing.
The author(s) declare that no financial support was received for the research, authorship, and/or publication of this article.
Authors DT, QZ, YO, LW, and JT were employed by Aostar Information Technology Co., Ltd.
The remaining author declares that the research was conducted in the absence of any commercial or financial relationships that could be construed as a potential conflict of interest.
All claims expressed in this article are solely those of the authors and do not necessarily represent those of their affiliated organizations, or those of the publisher, the editors, and the reviewers. Any product that may be evaluated in this article, or claim that may be made by its manufacturer, is not guaranteed or endorsed by the publisher.
Avordeh, T. K., Gyamfi, S., and Opoku, A. A. (2022). The role of demand response in residential electricity load reduction using appliance shifting techniques. Int. J. Energy Sect. Manag. 16 (4), 605–635. doi:10.1108/ijesm-05-2020-0014
Baek, K., Lee, E., and Kim, J. (2021). Resident behavior detection model for environment responsive demand response. IEEE Trans. smart grid 12 (5), 3980–3989. doi:10.1109/tsg.2021.3074955
Chen, L., Xu, Q. S., Yang, Y. B., Gao, H., and Xiong, W. (2022). Community integrated energy system trading: a comprehensive review. J. Mod. Power Syst. Clean Energy 10 (6), 1445–1458. doi:10.35833/mpce.2022.000044
Duan, Q. G., Chen, Y. C., Wang, Y., Wu, M. X., Bie, P., and Dong, P. (2021). Trading mechanism and clearing model of incentive demand response in electricity spot market. Electr. Power Constr. 42 (6), 145–156. doi:10.12204/j.issn.1000-7229.2021.06.015
Fan, R., Sun, R. J., and Liu, Y. T. (2022). A load restoration amount reduction method considering demand response of air conditioning loads. Trans. China Electrotech. Soc. 37 (11), 2869–2877. doi:10.19595/j.cnki.1000-6753.tces.210633
Gharibshah, Z., and Zhu, X. Q. (2022). User response prediction in online advertising. ACM Comput. Surv. 54 (3), 1–43. doi:10.1145/3446662
Guo, K. J., Gao, C. W., Lin, G. Y., Lu, S. X., and Feng, X. F. (2020). Optimization strategy of incentive based demand response for electricity retailer in spot market environment. Automation Electr. Power Syst. 44 (15), 28–35. doi:10.7500/AEPS20190726002
Hassanniakheibari, M., Hosseini, S. H., and Soleymani, S. (2020). Demand response programs maximum participation aiming to reduce negative effects on distribution networks. Int. Trans. Electr. Energy Syst. 30 (8), 1–14. doi:10.1002/2050-7038.12444
Hong, Y., Liu, Y. J., Xu, Q. S., Yin, H. Y., Huang, Y., and Hu, Y. (2020). Hybrid targeted demand response strategy of electric vehicles based on integral system and time-of-use electricity price. Electr. Power Autom. Equip. 40 (11), 106–114. doi:10.16081/j.epae.202007017
Huang, C., Huang, J. L., Jia, Y. Q., and Xu, J. (2023). A hybrid Aquila optimizer and its K-means clustering optimization. Trans. Inst. Meas. Control 45 (3), 557–572. doi:10.1177/01423312221111607
Huang, K., Hao, S. P., Song, G., Le, J. Y., Wu, Q., and Zhang, X. L. (2020). Layered optimization of AC/DC hybrid microgrid with three-port power electronic transformer. Electr. Power Autom. Equip. 40 (3), 37–43. doi:10.16081/j.epae.202003003
Kadadha, M., and Otrok, H. (2021). A blockchain-enabled relay selection for QoS-OLSR in urban VANET: a Stackelberg game model. Ad hoc Netw. 117, 102502–102511. doi:10.1016/j.adhoc.2021.102502
Klaucke, F., Hoffmann, C., Hofmann, M., and Tsatsaronis, G. (2020). Impact of the chlorine value chain on the demand response potential of the chloralkali process. Appl. energy 276 (15), 115366. doi:10.1016/j.apenergy.2020.115366
Liu, H., Zhao, W., Wen, K. H., He, H. J., Li, S. S., and Huang, S. L. (2022a). Construction scheme and realization of modularized intelligent fusion terminal in low-voltage distribution station areas. Electr. Meas. Instrum. 59 (1), 168–175. doi:10.19753/j.issn1001-1390.2022.01.023
Liu, Z. H., Li, Y. M., and Shi, S. D. (2022b). Impulsive noise suppressing method in power line communication system using sparse iterative covariance estimation. Radio Sci. 57 (4), 1–8. doi:10.1029/2022rs007424
Liu, Z. Y., Liu, Z. F., Zhao, H. Y., and Wu, Y. (2020). Intelligent socket design based on STM32 and GSM Technology. Automation Instrum. 35 (1), 95–99. doi:10.19557/j.cnki.1001-9944.2020.01.021
Pan, Y., Cheng, X. D., Gao, M. Y., Fu, Y., Feng, J., Ahmed, H., et al. (2020). Dual-functional multichannel carbon framework embedded with CoS2 nanoparticles: promoting the phase transformation for high-loading Li-S batteries. ACS Appl. Mater. interfaces 12 (29), 32726–32735. doi:10.1021/acsami.0c07875
Preeti, V., Seethalekshmi, K., and Bharti, D. (2022). A cooperative approach of frequency regulation through virtual inertia control and enhancement of low voltage ride-through in DFIG-based wind farm. J. Mod. Power Syst. Clean Energy 10 (6), 1519–1530. doi:10.35833/mpce.2021.000092
Qi, B., Zheng, S. L., Sun, Y., Li, B., Tian, S. M., and Shi, K. (2022). A model of incentive-based integrated demand response considering dynamic characteristics and multi-energy coupling effect of demand side. Proc. CSEE 42 (5), 1783–1798. doi:10.13334/j.0258-8013.pcsee.202351
Rashidizadeh-kermani, H., Vahedipourdahraie, M., Shafie-khah, M., and Siano, P. (2020). A regret-based stochastic bi-level framework for scheduling of DR aggregator under uncertainties. IEEE Trans. Smart Grid 11 (4), 3171–3184. doi:10.1109/tsg.2020.2968963
Ren, H., Lu, H. T., Lu, J. L., and Jin, Z. P. (2020). Analysis of LA demand response characteristics considering cyber physical system coupling and user’s response difference. Power Syst. Technol. 44 (10), 3927–3936. doi:10.13335/j.1000-3673.pst.2019.1202
Sang, B., Zhang, T., Liu, Y. J., Chen, Y. D., Liu, L. S., and Wang, R. (2020). Theories, energy management system research of multi-microgrid: a review. Proc. CSEE 40 (10), 3077–3092. doi:10.13334/j.0258-8013.pcsee.191436
Sheng, H. Z., Wang, C. F., Li, B. W., Liang, J., Yang, M., and Dong, Y. (2021). Multi-timescale active distribution network scheduling considering demand response and user comprehensive satisfaction. IEEE Trans. Industry Appl. 57 (3), 1995–2005. doi:10.1109/tia.2021.3057302
striani, A., Y, L., Shafiullah, G. M., and Shahnia, F. (2021). Incentive determination of a demand response program for microgrids. Appl. energy 292 (15), 116624. doi:10.1016/j.apenergy.2021.116624
Sun, Y., Hu, Y. J., Zheng, S. L., Li, B., and Qi, B. (2022). Integrated demand response optimization incentive strategy considering users' response characteristics. Proc. CSEE 42 (4), 1402–1412. doi:10.13334/j.0258-8013.pcsee.202244
Tan, Z. K., and Zeng, M. (2022). Real-time demand response theory based on load regulation capability model. South. Power Syst. Technol. 16 (1), 58–66. doi:10.13648/j.cnki.issn1674-0629.2022.01.006
Torff, B., Kimmons, K., Budris, A., Solosky, E., Maqsood, J., Benincasa, J., et al. (2020). Response, demand, and control: evaluating a three-factor model and measure of teachers' interactional styles. Microbiol. Mol. Biol. Rev. 84 (2), 140–149. doi:10.1080/00131725.2020.1702434
Tu, J., Zhou, M., Li, G. Y., and Luan, K. N. (2020). A potential game based distributed optimization strategy for the electricity retailer considering residential demand response. Proc. CSEE 40 (2), 400–410. doi:10.13334/j.0258-8013.pcsee.190093
Urban, J. J., Menon, A. K., Tian, Z. T., Jain, A., and Hippalgaonkar, K. (2019). New horizons in thermoelectric materials: correlated electrons, organic transport, machine learning, and more. J. Appl. Phys. 125 (18), 1–11. doi:10.1063/1.5092525
Wan, C., and Song, Y. H. (2021). Theories, methodologies and applications of probabilistic forecasting for power systems with renewable energy sources. Automation Electr. Power Syst. 45 (1), 2–16. doi:10.7500/AEPS20200811008
Wang, B. B., Xu, P., Wang, X. Y., Zhang, H., and Ning, P. (2022a). Distributionally robust modeling of demand response and its large-scale potential deduction method. Automation Electr. Power Syst. 46 (3), 33–41. doi:10.7500/AEPS20210622002
Wang, L., Liu, Y., Li, W. F., Zhang, J., Xu, L. X., and Xin, Z. M. (2022b). Two-Stage power user classification method based on digital feature portraits of power consumption behavior. Electr. Power Constr. 43 (2), 70–80. doi:10.12204/j.issn.1000-7229.2022.02.009
Wei, Z. B., Zhang, H. T., Wei, P. Y., Liang, Z., Ma, X. R., and Sun, Z. B. (2021). Two-stage optimal dispatching for microgrid considering dynamic incentive-based demand response. Power Syst. Prot. Control 49 (19), 1–10. doi:10.19783/j.cnki.pspc.201605
Xu, H. S., Lu, J. X., Yang, Z. H., Li, J., Lu, J., Jun, , et al. (2021). Decision optimization model of incentive demand response based on deep reinforcement learning. Automation Electr. Power Syst. 45 (14), 97–103. doi:10.7500/AEPS20200208001
Yang, X. P., Zhang, F. F., Xie, Q., Zhang, M., and Gao, M. H. (2022). Situation orientation method of active distribution network based on incentive demand response. Acta Energiae Solaris Sin. 43 (3), 133–140. doi:10.19912/j.0254-0096.tynxb.2020-0587
Zhang, G., Xue, S., Fan, M. H., and Zhang, H. (2021). Theories, design of demand-response market mechanism in accordance with China power market. Electr. Power Constr. 42 (4), 132–140. doi:10.12204/j.issn.1000-7229.2021.04.015
Zhang, L. L., Gang, D. U., Jun, W. U., and Ma, Y. J. (2020). Joint production planning, pricing and retailer selection with emission control based on Stackelberg game and nested genetic algorithm. Expert Syst. Appl. 161, 1–11. doi:10.1016/j.eswa.2020.113733
Zhao, J. Q., Xia, X., Liu, Z. W., Xu, C. L., Su, D. W., and San, X. (2020). User electricity consumption feature selection and behavioral portrait. Power Syst. Technol. 44 (9), 3488–3496. doi:10.13335/j.1000-3673.pst.2019.2138
Zheng, R. N., Li, Z. H., Tang, Y. J., Ni, C. W., Li, G. J., and Han, P. (2022). Incentive demand response model and evaluation considering uncertainty of residential customer participation degree. Automation Electr. Power Syst. 46 (8), 154–162. doi:10.7500/AEPS20210404001
Keywords: tiered incentives, residential distribution areas, demand response, leader–follower game, adjustable load
Citation: Tang D, Zhang Q, Ma T, Ou Y, Wu L and Tang J (2024) Aggregated demand-side response in residential distribution areas based on tiered incentive prices. Front. Energy Res. 12:1352356. doi: 10.3389/fenrg.2024.1352356
Received: 08 December 2023; Accepted: 08 January 2024;
Published: 26 January 2024.
Edited by:
Youbo Liu, Sichuan University, ChinaReviewed by:
Zao Tang, Hangzhou Dianzi University, ChinaCopyright © 2024 Tang, Zhang, Ma, Ou, Wu and Tang. This is an open-access article distributed under the terms of the Creative Commons Attribution License (CC BY). The use, distribution or reproduction in other forums is permitted, provided the original author(s) and the copyright owner(s) are credited and that the original publication in this journal is cited, in accordance with accepted academic practice. No use, distribution or reproduction is permitted which does not comply with these terms.
*Correspondence: Donglai Tang, dGFuZ2RvbmdsYWlAc29odS5jb20=
Disclaimer: All claims expressed in this article are solely those of the authors and do not necessarily represent those of their affiliated organizations, or those of the publisher, the editors and the reviewers. Any product that may be evaluated in this article or claim that may be made by its manufacturer is not guaranteed or endorsed by the publisher.
Research integrity at Frontiers
Learn more about the work of our research integrity team to safeguard the quality of each article we publish.