 Zijia Hui1
 Wenwen He
 Xiong Wu
- 1Economic and Technological Research Institute of State Grid Shaanxi Electric Power Co Ltd., Xi’an, China
- 2School of Electrical Engineering, Xi’an Jiaotong University, Xi’an, China
The integration of renewable energy units into power systems brings a huge challenge to the flexible regulation ability. As an efficient and convenient flexible resource, energy storage systems (ESSs) have the advantages of fast-response characteristics and bi-directional power conversion, which can provide flexible support for the power system. This paper establishes an optimization model for the ESS based on a bi-level programming model. The upper-level model optimizes the decision strategy of ESS configuration planning. The lower-level model is based on scenario analysis theory to simulate the operation of typical daily scenarios. Flexibility requirement constraints are added to characterize the required flexibility resources of the power system. In addition, the conditional value-at-risk (CVaR) is applied to characterize the risk of wind curtailment and load shedding during operation. To simplify the model, a set of association constraints is introduced to convert the original bi-level programming model into a direct-solvable single-level mixed-integer linear programming (MILP) model. Finally, the effectiveness of the proposed model is verified through case studies.
1 Introduction
Gradually advancing renewable energy generation represents a significant initiative in the establishment of a new power system and is pivotal in achieving the dual-carbon goal (Mitra and Nguyen, 2022). In recent years, rapid development has been witnessed in the sphere of renewable energy generation, notably in the forms of wind and solar power (Aaslid et al., 2022). Although renewable energy offers substantial environmental benefits, its inherent randomness and uncertainty have contributed to increasingly complex operating conditions within traditional power systems (Han et al., 2022). The scarcity of flexible resources within the power system has resulted in commonplace occurrences of wind power curtailment and load shedding (Naversen et al., 2022). Consequently, it is of paramount importance to comprehensively evaluate the flexibility and operational risks of power systems in order to devise a prudent energy storage system (ESS) configuration strategy.
Current research on the definition of power system flexibility is generally aligned. The flexibility characterization system entails the requisite adjustment capacity to promptly respond to power fluctuations and uphold power balance (Jiang et al., 2023). Flexibility serves as a critical attribute of power systems, essential for mitigating disturbances and ensuring secure and stable operations (Clegg and Mancarella, 2016; Avramidis et al., 2022). Typically, flexibility resources are derived from the generation side, known as operational reserves (Li et al., 2022). In recent studies, a market-based framework has been proposed to optimize the flexibility of renewable energy in distribution and transmission systems (Pourghaderi et al., 2023). Furthermore, novel mathematical formulations have been introduced to augment flexibility within the power system, particularly in light of the uncertainty associated with wind power in stochastic scheduling (Zhou et al., 2021). Additionally, models have been developed to integrate flexibility considerations into generation expansion planning, thereby optimizing the utilization of external flexibility resources and maximizing the benefits for distribution network operators (Oikonomou et al., 2020; Dai et al., 2021). Notably, a security-constrained economic dispatch (SCED) model has been formulated to mitigate wind power curtailment by leveraging the potential flexibility of high-voltage direct current (HVDC) systems (Huang et al., 2021). However, the majority of existing literature overlooks the impact of uncertain renewable energy output on the flexibility planning of power systems. Conditional value-at-risk (CVaR) has emerged as a common method to quantify risk losses associated with wind power and load shedding (Zhang et al., 2018). Leveraging the advantages of CVaR, this paper proposes a planning model that integrates flexibility requirements and operational risks.
ESS devices serve as a flexible resource for the power system, offering rapid responsiveness and bi-directional conversion capabilities to provide essential support to the power system (Zhou et al., 2023). Recent studies have proposed a two-stage active distribution network management approach, incorporating power flexibility considerations, to facilitate the provision of flexibility to the higher-level power grid through the ESS (Kalantar-Neyestanaki and Cherkaoui, 2021). Similarly, a model has been developed to structure flexibility within microgrids, focusing on flexibility services and collaborative network operations, thereby enhancing the flexibility and economic competitiveness of microgrids through the utilization of hybrid ESS devices (Garcia-Torres et al., 2021). Furthermore, a multi-stage robust optimization operation model has been proposed, integrating the ESS into power system operations to enhance system resilience while neglecting the potential of flexibility resources (Shi et al., 2021). Additionally, a two-stage adaptive robust planning model has been developed, incorporating the ESS and dynamic thermal rating systems to optimize the integration of wind power into the power system (Dehghan et al., 2020). Other studies have focused on modeling large-scale renewable energy entities to reduce the flexibility demand of power systems and investigated coordinated operation strategies for ESSs and pumped storage power stations (Teng et al., 2019). Moreover, a framework for flexibility recovery guarantees for the ESS has been proposed, aiming to ensure full cycle capacity and accurate loss accounting (Evans et al., 2022). Notably, existing literature is predominantly centered on the planning and optimal operation of the ESS within distribution networks (Alharbi and Almutairi, 2021) and microgrids (Shen et al., 2021), warranting further research into the configuration strategy of the ESS within the transmission system to bolster the flexibility resource reserve of the power system.
The contributions of this paper can be summarized below.
• The key innovation of this research lies in the comprehensive modeling of flexibility requirements within the power system. Traditional power systems were predominantly designed to accommodate centralized and dispatchable generation sources, with limited consideration for the dynamic and decentralized nature of renewable energy integration. By incorporating a robust modeling framework for flexibility demands, this research contributes to a more nuanced understanding of the operational challenges imposed by renewable energy integration and provides a foundation for optimizing ESS configuration to meet these demands.
• The application of CVaR to characterize operational risks in power system operations represents a significant advancement in quantifying and managing uncertainties. CVaR provides a more comprehensive risk assessment framework than traditional risk measures, offering insights into the potential downside risk associated with operational decisions. By leveraging CVaR, this research enhances the capability to assess and mitigate operational risks, thereby improving the decision-making process for ESS configuration under uncertain operating conditions.
• An optimization bi-level model for ESS configuration is proposed. Compared to traditional ESS configuration models, this bi-level optimization model introduces a novel and effective approach to ESS planning. By simultaneously considering the strategic planning of the ESS at the upper level and simulating daily operations under typical scenarios at the lower level, this research facilitates a holistic and integrative perspective on ESS configuration, aiming to optimize both long-term planning and short-term operational considerations. By adding a set of association constraints, the bi-level model is simplified into a directly solvable single-level mixed-integer linear programming (MILP) model.
The remainder of the paper is organized as follows: in Section 2, a bi-level programming model is formulated; The solution method is shown in Section 3; Section 4 presents case studies based on the historic data; and Section 5 concludes the paper.
2 Bi-level programming model
2.1 Framework of the bi-level programming model
To enhance the rationality of the planning scheme, a bi-level programming model shown as Eq. 1 is adopted, which takes the planning and operation layers into consideration. In addition, the volatility of wind power, constructing several typical scenarios based on the Monte Carlo sampling method (Vongsing and Raphisak, 2021) and K-means clustering method, is considered (Liu et al., 2021).
where s is the index of scenarios, xinv is the variable sets in the planning layer, xopr s is the variable sets in the operation layer of scenario s, Cinv is the cost of the planning layer, Copr is the cost of the operation layer, G and H are the constraints in the planning layer, and gs and hs are the constraints in the operation layer.
2.2 Flexibility requirement and operational risks
The flexibility requirements of the power system are calculated using the net load curve of each scenario. Equation 2 is the formula of net load; Eq. 3 is the formula of flexibility requirement.
where t is the index of the time period,
Flexible resources can suppress the impact of uncertainty in the renewable energy output of the power system. Thermal power units are the most important flexibility resources in the power system. For operating thermal units, the flexibility resources are determined by the ramping rate and the gap between the current output and limits of the output. The charging and discharging characteristics of the ESS can provide flexibility for bi-directional adjustment. The upward and downward flexibility resource supply capacity of the power system during time period t shown as Eqs 4, 5, respectively.
where
In the power system, the prediction deviation of the wind power output will pose risks to the safety, stability, and economic operation of the system. Therefore, CVaR is applied to measure the impact of uncertainty in the wind power output. As a common risk measurement method, CVaR is developed based on the model and foundation of value-at-risk (VaR) (Ran et al., 2023). VaR refers to the maximum expected amount of a financial asset or its combination within a certain confidence level and interval. CVaR refers to the conditional expectation that a loss amount exceeds VaR, which represents the average level of excess loss. CVaR evaluates the probability and magnitude of system losses to measure the operation risks. Therefore, based on the expected cost of wind curtailment and load shedding, the operation risks of the wind curtailment and load shedding are shown as Eqs 6, 7, respectively.
where CCVaR,W and CCVaR,L are CVaRs of wind power curtailment and load shedding, respectively; β is the risk avoidance parameter; α is the unit confidence level; ξW, ξL, ηW, and ηL are the auxiliary variables to calculate CVaR; and πs is the probability of scenario s.
2.3 Planning model
The decision variables of the upper-level model are the location and quantity of ESS devices. The objective function of the planning model is to minimize the investment cost and operational risks of the system, which is shown in Eq. 8. Equation 9-11 are formulas of investment cost of ESS, returen on investment, and site collection cost of ESS respectively. The planning period for the ESS is 1 year.
where Cinvest is the investment cost of the ESS; Csite is the site selection cost; TN is the service life of the ESS; λ is the return on investment; cess is the unit investment cost of the ESS; σk is a binary variable, indicating whether to install the ESS at node k, where 1 means installation and otherwise, 0; r is the discount rate; and
Constraint (12) limits the maximum planned number of ESSs in the power grid.
where Ness is the maximum number of ESSs allowed to be installed in the power grid.
2.4 Operation model
The lower-level model simulates the sub-problems of operation in each typical scenario. The optimal operation strategy can be obtained by solving this model. The objective function is to minimize the operational cost of the system, which is shown in Eq. 13. The operation costs of ESS and thermal power units are calculated by Eqs 14, 15, respectively.
where Com is the operation cost of the ESS, com is the operation cost coefficient of the ESS, Cth is the operation cost of thermal power units, and ci,k is the operation cost coefficient in power output range i of the thermal power unit at node k.
The constraints of the operation model are shown below.
2.4.1 Node power balance constraint
In the power system, the generation and consumption of electricity need to be consistent all the time. In extreme cases, there is a risk of wind power curtailment and load shedding. The amount of wind power curtailment and load shedding is represented by a node power balance constraint. Equation 16 is node power balance constraint.
2.4.2 Constraints of thermal power units
The operational constraints of thermal power units include climbing restrictions, shown as Eq. 17, and power output restrictions, shown as Eq. 18.
2.4.3 Constraints of the wind turbine
For a wind turbine, the sum of the wind power output and wind power curtailment is the predicted wind power. Equation 19–20 are limit constraints for wind power out and wind power curtailment, respectively, Eq. 21 is the power balance equation for wind power output.
where
2.4.4 Constraints of the ESS
The constraints of the ESS include discharging and charging power limitations, shown as Eqs 22–24, the power balance constraint, shown as Eq. 25, and state of charge constraints, shown as Eqs 26, 27.
where
2.4.5 Line flow constraint
When the transmission system operates safely and stably, the power through the line cannot exceed the transmission capacity. Because the focus of this paper is on the flexibility of active power, it is assumed that each node has sufficient reactive power. Considering that the reactance of the transmission network system is much greater than the resistance, DC power flow is adopted. The line flow constraint based on the DC power flow is shown in Eq. 28:
where
2.4.6 Flexibility requirement constraints
To ensure the smooth operation of the power system, the planned flexibility resources need to exceed the flexibility requirements. Equation 29–30 are the up/down flexibility requirement constraints, respectively.
2.4.7 Auxiliary constraints to calculate CVaR
Equation 31–32 are auxiliary constraints for wind power curtailment and load shedding to calculate CVaR, respectively.
where λW and λL are punishment coefficients of wind power curtailment and load shedding, respectively.
3 Solution method
The optimization configuration model for the ESS is divided into the upper-level planning model and lower-level operation model. The optimal strategy of the bi-level model needs to be obtained by continuously iterating between the upper-level model and the lower-level model, which is a complex solution method. Therefore, association constraints shown as Eqs 33, 34 are introduced to simplify the entire bi-level model into an easily solved single-level MILP model.
The converted single-level model is as follows:
By solving the model (Eq. 35), an optimized configuration plan for the ESS can be obtained. The solving process is shown in Figure 1.
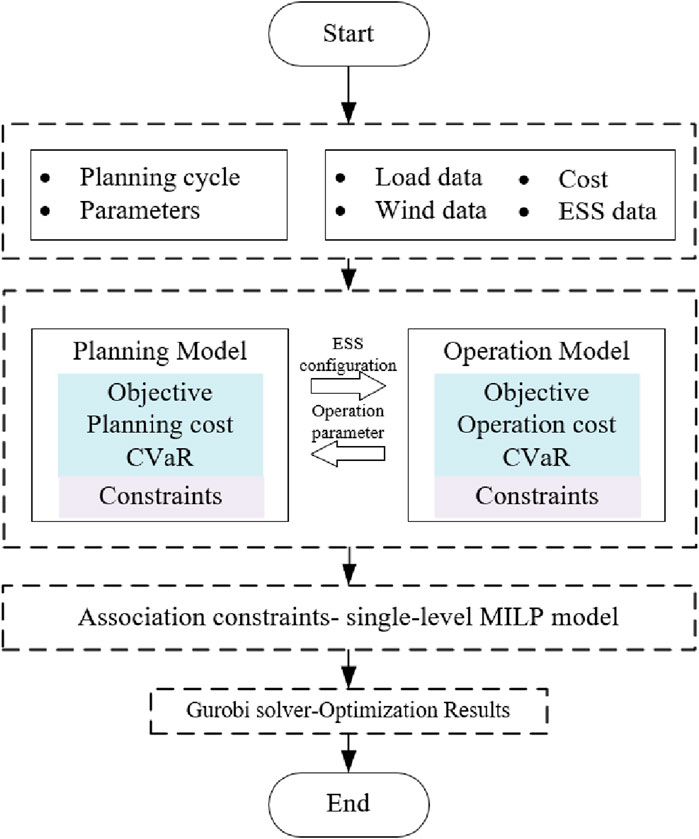
Figure 1. Model solving process.
4 Case study
In this section, using the configuration model formulated in Section 2, the optimal planning strategy of the IEEE-57 system is obtained, which can be found in the MATPOWER toolbox. The optimization model is modeled using the YALMIP language and solved using Gurobi in MATLAB R2018b.
4.1 Basic data
The system structure is shown in Figure 2. The thermal power units are located at nodes 1, 2, 3, 6, 8, 9, and 12. The wind farm is located at node 14. There are 26 candidate ESS nodes, and the site selection costs for each candidate nodes are shown in Figure 3. The K-means method is used to reduce scenarios and ultimately retain five typical wind power scenarios. The predicted power curves for the wind farm and load are shown in Figure 4. The other parameters are shown in Table 1.
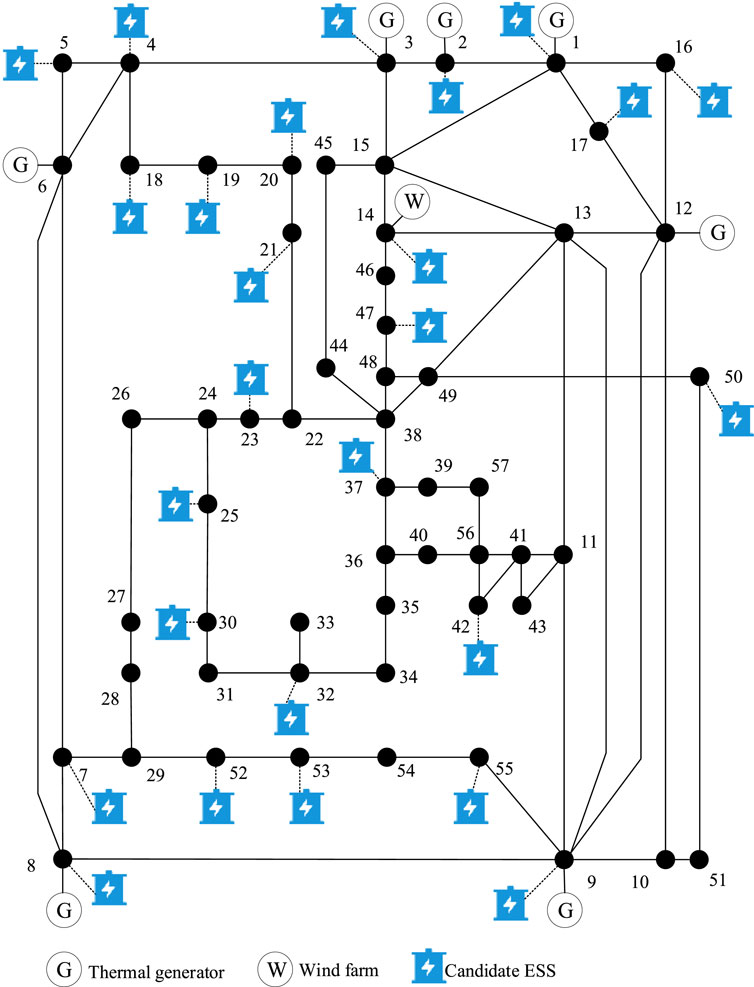
Figure 2. System structure diagram.
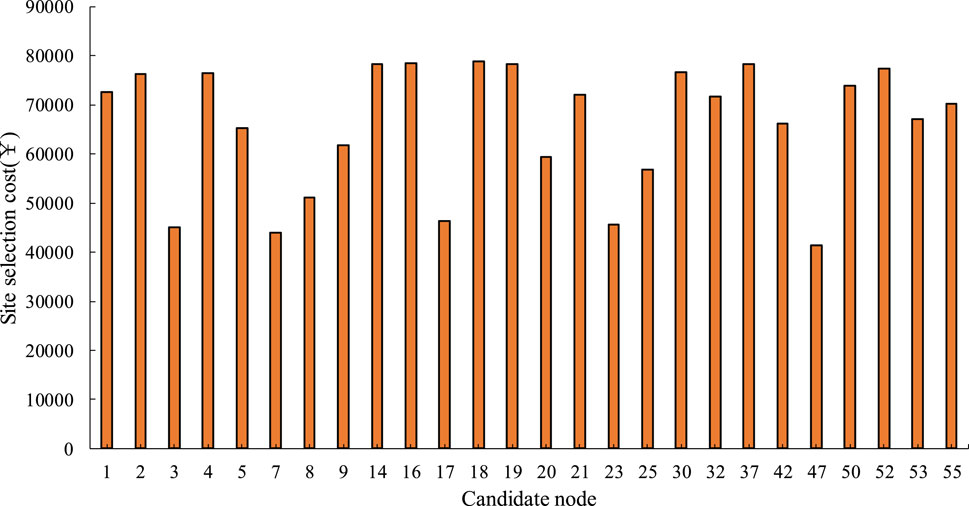
Figure 3. Site selection cost of candidate nodes.
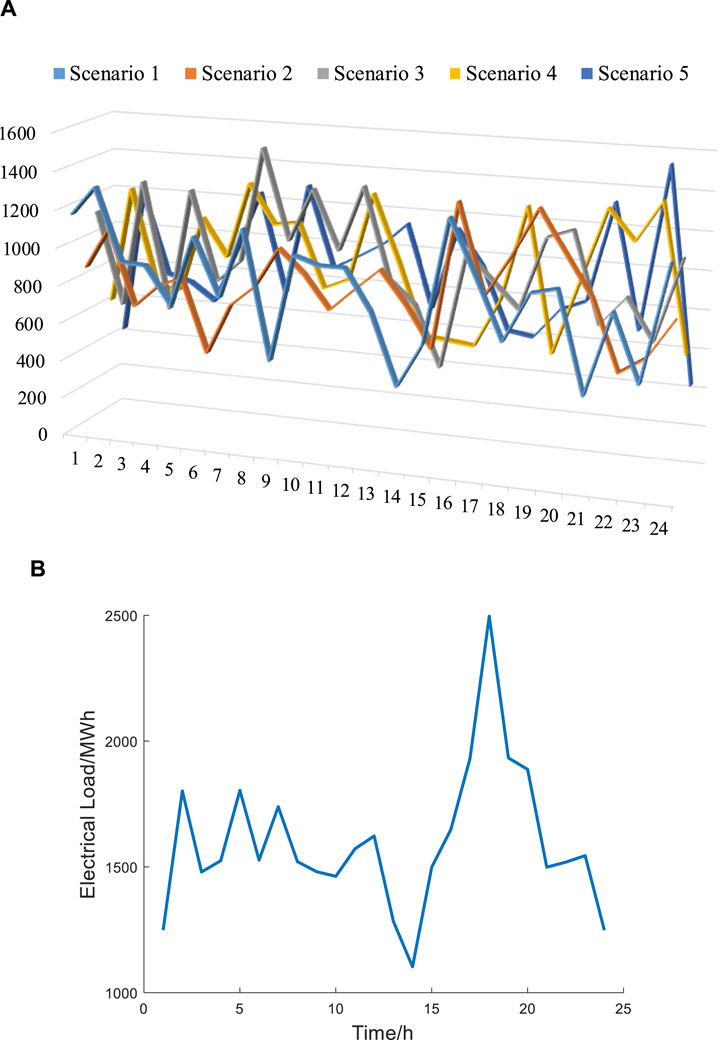
Figure 4. Predicted power of the wind farm and total loads: (A) wind farm; (B) total load curve.
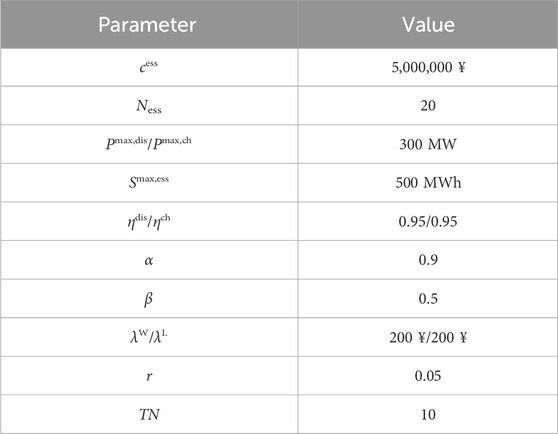
Table 1. Parameters.
4.2 Analysis of the ESS configuration results
To verify the effectiveness of the model established in this paper, the model is solved under three conditions: condition 1 is before configuration, condition 2 is after configuration considering flexibility requirement constraints, and condition 3 is after configuration without considering flexibility requirement constraints. The result comparisons of these three conditions are shown in Table 2.
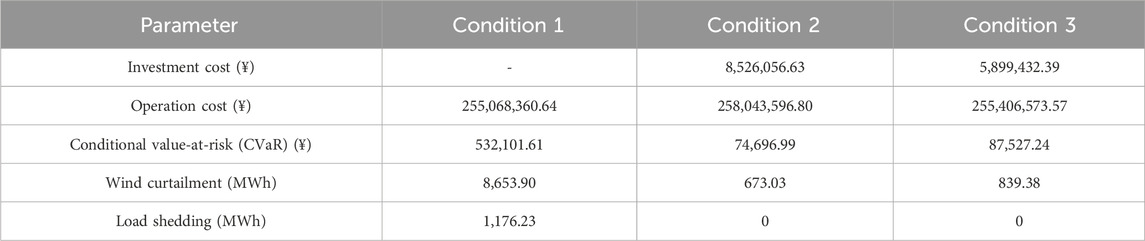
Table 2. Result comparisons before and after energy storage system (ESS) configuration.
Observing the results given in Table 2, although the investment cost and operation cost under condition 2 are larger than that under condition 1, the operational CVaR of condition 2 is only 14% of the CVaR of condition 1 which is reduced by 457,404.62
The results of ESS planning under conditions 2 and 3 are shown in Figure 5, while the flexibilities of the three conditions are shown in Figure 6. The overall ESS planning amounts for conditions 2 and 3 are 13 and 8, respectively. In contrast to condition 2, due to the fact that condition 3 does not require consideration of flexibility requirements, it will strive to optimize the equilibrium between planning expenses and system operating costs. This signifies that the system exhibits a predisposition toward selecting nodes with reduced site selection costs and endeavoring to minimize the number of ESS installations. To meet the flexibility requirements of the system, more ESS devices will be configured under condition 2 than under condition 3. Although this may result in heightened investment and operational expenses, it concurrently mitigates the operational risks encountered by the system.
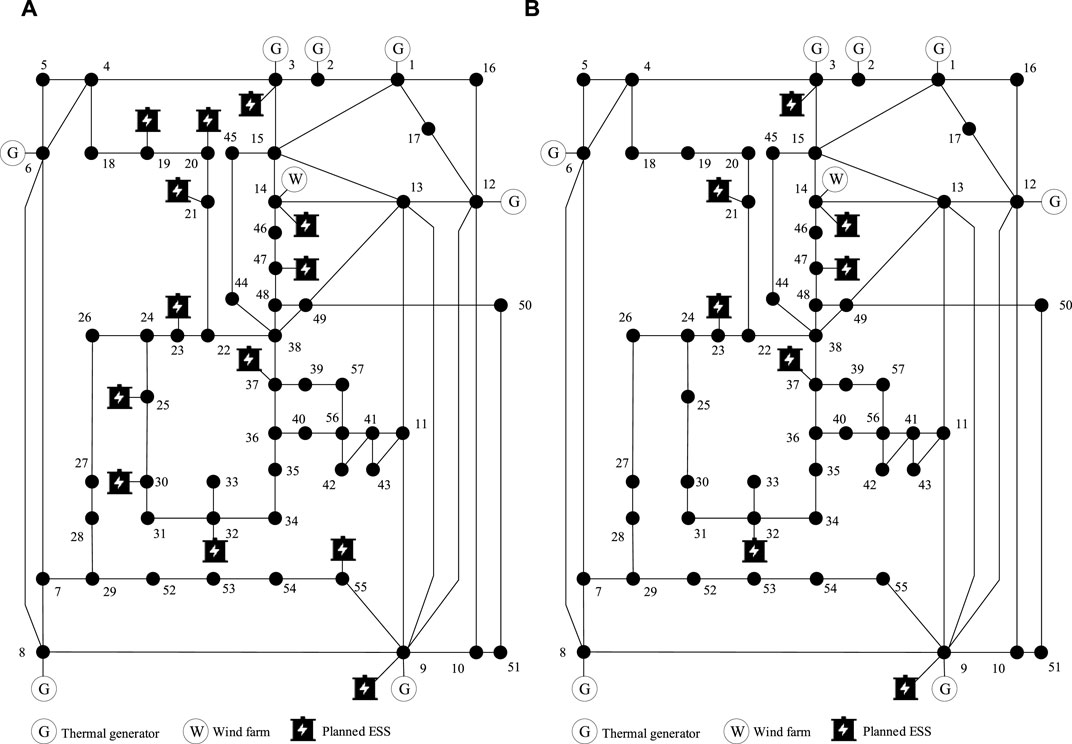
Figure 5. Energy storage system (ESS) planning results under conditions 2 and 3. (A) Condition 2 and (B) condition 3.
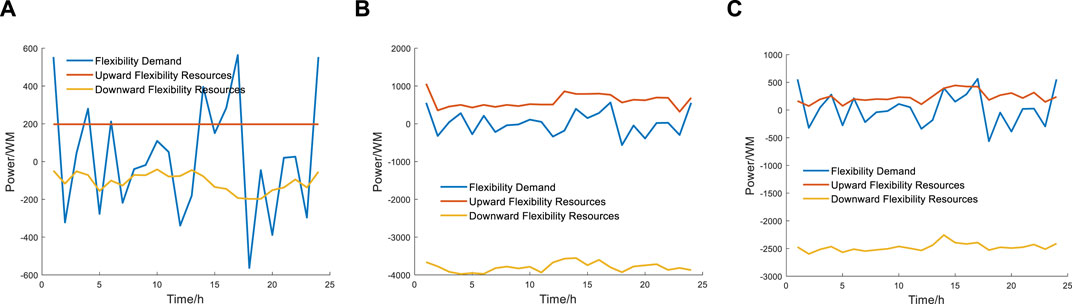
Figure 6. Flexibility under different conditions: (A) condition 1; (B) condition 2; and (C) condition 3.
Under condition 1, it is observed that the flexibility demand of the power system surpasses the available flexibility resource, consequently resulting in significant wind curtailment and load shedding. Such a scenario is evidently detrimental to the economic operation of the power system. Upon the integration of the ESS, the system exhibits an enhanced capacity to swiftly modify its charging and discharging states, thereby effectively storing surplus power and significantly augmenting the overall flexibility resources. As a result, under condition 2, the system consistently ensures that the flexibility demand remains within the available flexibility resource. Nonetheless, it is important to note that without considering the constraints of flexibility requirements, which is condition 3, there exists the potential for the flexibility demand to exceed the available flexibility resource at specific instances.
4.3 Analysis of operational flexibility
4.3.1 Improvement of the net load curve
Figure 7 shows a comparison of the net load curve before and after ESS configuration. Before ESS configuration, the daily net load difference in the peak to the valley is 1,523 MW, which accounts for 61% of the peak load. After ESS configuration, the ESS is charged during periods of high wind power generation and nighttime low-level load, which promotes the consumption of renewable energy. The difference in the peak to the valley of the net load curve is reduced to 1,456 MW, alleviating the scheduling pressure of the power system.
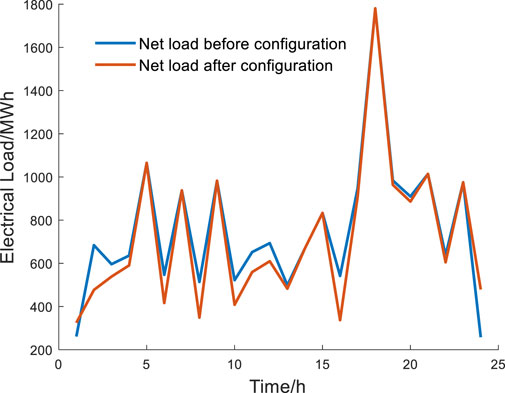
Figure 7. Net load curve before and after ESS configuration.
4.3.2 Improvement of thermal unit power output
Figure 8 shows the thermal power generation curves before and after ESS configuration. Before ESS configuration, thermal power units were limited by the capacity of transmission lines and in a low output state. After planning the ESS, the spatiotemporal transfer of electricity energy in the ESS can be used to increase the power output of thermal power units and reduce the load shedding.
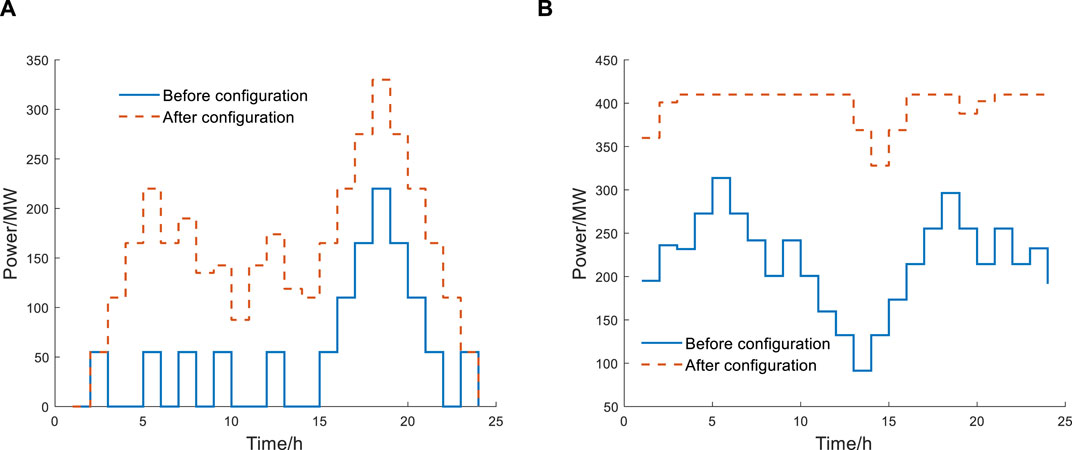
Figure 8. Thermal power generation curves before and after ESS configuration: (A) unit 5 and (B) unit 7.
4.3.3 Improvement of the transmission line load rate
The integration of wind power into the grid exacerbates the uncertainty of net load changes, which can lead to uncertainty in the power flow of the power system. Therefore, it is necessary to leave a certain margin in the load rate of each transmission line to ensure the reliability of power supply. The maximize line load rate is defined by Ll comparing the maximum value of the active power flow of the transmission line to the absolute value of the transmission capacity of the line: Equation 36 is the formula to calculate the maximum line load rate.
where
Once the flexibility requirements of the system are considered, Table 3 illustrates the maximum line load rates of certain lines pre- and post-ESS deployment. The maximum line load rates of these lines notably decrease following the implementation of the ESS, leading to a reduction in instances of power flow congestion. This indicates that the incorporation of energy storage devices within the transmission network can effectively ameliorate instances of line overloading.
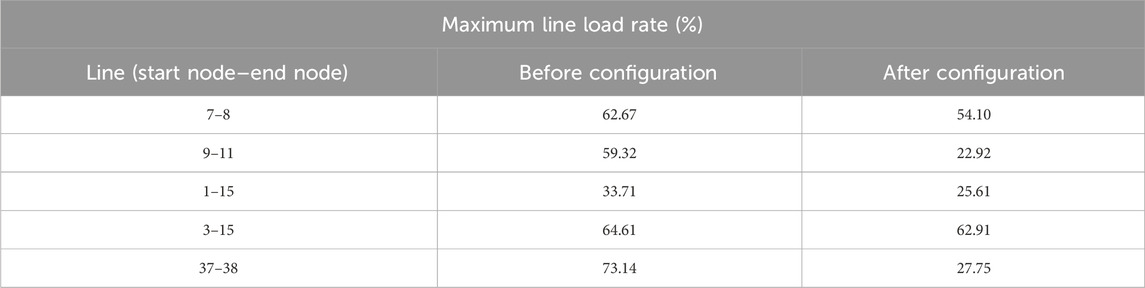
Table 3. Comparison of maximum line load rates before and after energy storage system (ESS) configuration.
To further elucidate the impact of energy storage on transmission lines, the case of lines (9–11) is examined. Figure 9 depicts a comparative curve of the line load rates of this line pre- and post-ESS deployment, while Figure 10 displays the variation in energy storage system capacity at node 9. It is evident that, subsequent to the implementation of energy storage devices, the line load rates of this line consistently remain below 0.3. The variation in capacity at node 9 is similar to the load fluctuation curve. This demonstrates that through charging and discharging activities, ESS devices enhance the power flow distribution of the system, effectively mitigating instances of line overloading.
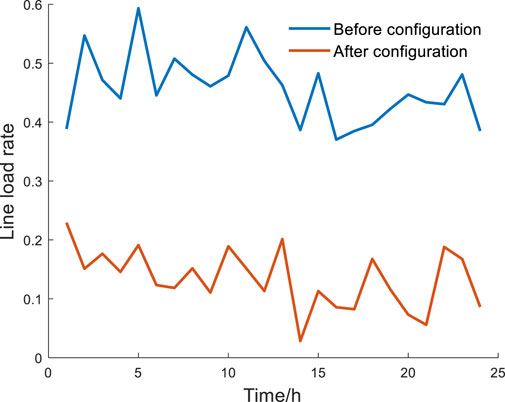
Figure 9. Comparison of the line load rate of lines (9–11) before and after ESS configuration.
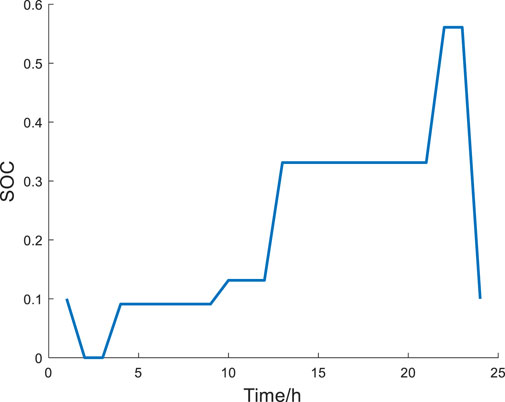
Figure 10. SOC of the ESS on node 9.
4.4 Comparison of different planning strategies
The total wind and load shedding curves in different values of β are shown in Figure 11. Parameter comparisons under different values of β is shown in Table 4. These curves show that there is a significant phenomenon of wind power curtailment and load shedding before configuration. In different values of risk avoidance parameters, the trend of wind power curtailment and load shedding in the power system is generally consistent. The analysis further reveals a marked enhancement in the operational performance of the power system. Notably, as β increases, there is a consistent reduction in the operation risk cost, wind power curtailment, and load shedding. However, this is accompanied by a corresponding increase in the operational costs of the power system. Consequently, it becomes imperative for power system operators to judiciously select an optimal value of β in order to maximize benefits within the ESS configuration strategy.
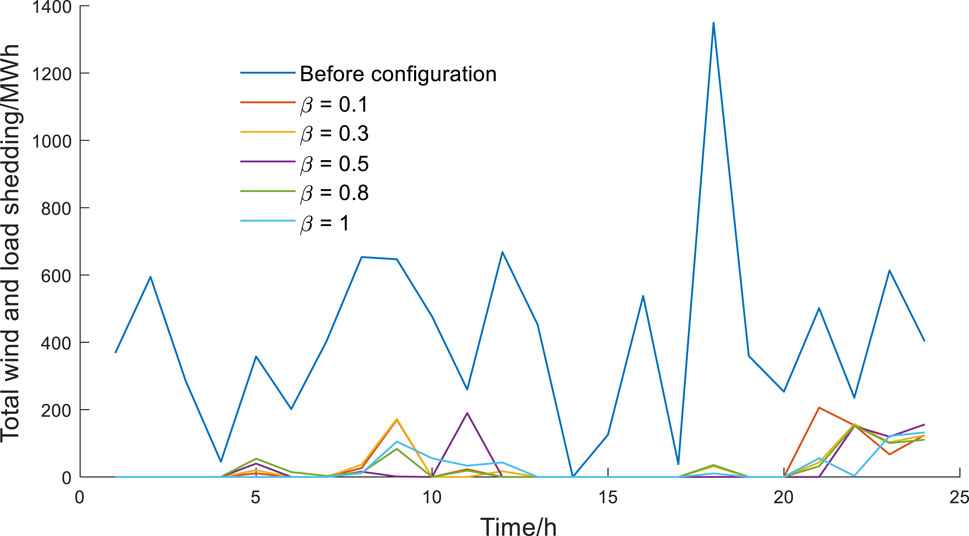
Figure 11. Total wind and load shedding curve in different values of β.
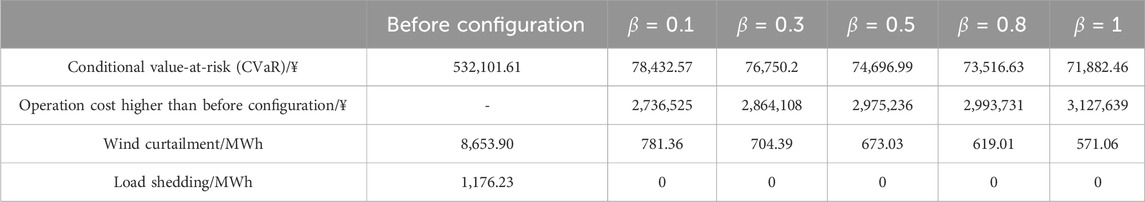
Table 4. Result comparisons under different values of β
5 Conclusion
This paper presents a bi-level ESS configuration optimization model that incorporates considerations of flexibility requirements and operational risks within the power system. To analyze the impact of wind power uncertainty, scenario analysis theory and CVaR are used. The upper-level model focuses on optimizing the planning strategy for the ESS in the power system, while the lower-level model simulates daily operations under typical scenarios. In order to simplify the original model, a set of coupling constraints is introduced to transform the bi-level model into a solvable single-level MILP model.
The findings indicate that following the implementation of ESS planning, operational risks within the power system are significantly mitigated. The total amount of wind curtailment and load shedding represents only 6.85% of the pre-planning levels, with the CVaR reduced to 14% of the pre-planning values. Additionally, the flexibility resources experience notable enhancements. Optimization of wind power consumption and the peak–valley net load curve contributes to the safe and stable operation of the power system. Through comparison of results across various values of risk avoidance parameters, power system operators are advised to select an appropriate value of β to achieve a balance between the economic and operational flexibility aspects of the system. As part of future research, the impact of flexible ESS configuration on power system line load rates will be a key focus.
Data availability statement
The raw data supporting the conclusion of this article will be made available by the authors, without undue reservation.
Author contributions
ZH: writing–original draft, methodology, investigation, and funding acquisition. HY: writing–review and editing, software, resources, and project administration. BL: writing–original draft, visualization, validation, and supervision. WH: writing–review and editing and writing–original draft. XW: writing–review and editing, formal analysis, data curation, and conceptualization.
Funding
The author(s) declare financial support was received for the research, authorship, and/or publication of this article. This work was supported by the Science and Technology Project of State Grid Shaanxi Electric Power Company (No. 5226JY230004).
Conflict of interest
Authors ZH, HY, and BL were employed by the Economic and Technological Research Institute of State Grid Shaanxi Electric Power Co Ltd.
The remaining authors declare that the research was conducted in the absence of any commercial or financial relationships that could be construed as a potential conflict of interest.
The authors declare that this study received funding from the Science and Technology Project of State Grid Shaanxi Electric Power Company (No.5226JY230004). The funder had the following involvement in the study: data collection.
Publisher’s note
All claims expressed in this article are solely those of the authors and do not necessarily represent those of their affiliated organizations, or those of the publisher, the editors, and the reviewers. Any product that may be evaluated in this article, or claim that may be made by its manufacturer, is not guaranteed or endorsed by the publisher.
References
Aaslid, P., Korpås, M., Belsnes, M. M., and Fosso, O. B. (2022). Stochastic optimization of microgrid operation with renewable generation and energy storages. IEEE Trans. Sustain. Energy 13 (3), 1481–1491. doi:10.1109/TSTE.2022.3156069
Alharbi, W., and Almutairi, A. (2021). Planning flexibility with non-deferrable loads considering distribution grid limitations. IEEE Access 9, 25140–25147. doi:10.1109/ACCESS.2021.3057553
Avramidis, I., Capitanescu, F., and Deconinck, G. (2022). Grid-friendly smart sustainable buildings: flexibility-to-cost mapping. IEEE Trans. Sustain. Energy 13 (3), 1857–1860. doi:10.1109/TSTE.2022.3160886
Clegg, S., and Mancarella, P. (2016). Integrated electrical and gas network flexibility assessment in low-carbon multi-energy systems. IEEE Trans. Sustain. Energy 7 (2), 718–731. doi:10.1109/TSTE.2015.2497329
Dai, W., Shi, B., Zhang, D., Goh, H., Liu, H., and Li, J. (2021). Incorporating external flexibility in generation expansion planning. IEEE Trans. Power Syst. 36 (6), 5959–5962. doi:10.1109/TPWRS.2021.3101700
Dehghan, S., Amjady, N., and Aristidou, P. (2020). A robust coordinated expansion planning model for wind farm-integrated power systems with flexibility sources using affine policies. IEEE Syst. J. 14 (3), 4110–4118. doi:10.1109/JSYST.2019.2957045
Evans, M. P., Tindemans, S. H., and Angeli, D. (2022). Flexibility framework with recovery guarantees for aggregated energy storage devices. IEEE Trans. Smart Grid 13 (5), 3519–3531. doi:10.1109/TSG.2022.3173900
Garcia-Torres, F., Báez-Gonzalez, P., Tobajas, J., Vazquez, F., and Nieto, E. (2021). Cooperative optimization of networked microgrids for supporting grid flexibility services using model predictive control. IEEE Trans. Smart Grid 12 (3), 1893–1903. doi:10.1109/TSG.2020.3043821
Han, P., Li, P., Xie, X., and Zhang, J. (November 2022). “Coordinated optimization of power rating and capacity of battery storage energy system with large-scale renewable energy,” in Proceedings of the 2022 IEEE 6th conference on energy internet and energy system integration Chengdu, China: EI2, 189–193. doi:10.1109/EI256261.2022.10116240
Huang, H., Zhou, M., Zhang, S., Zhang, L., Li, G., and Sun, Y. (2021). Exploiting the operational flexibility of wind integrated hybrid AC/DC power systems. IEEE Trans. Power Syst. 36 (1), 818–826. doi:10.1109/TPWRS.2020.3014906
Jiang, T., Wu, C., Zhang, R., Li, X., Chen, H., and Li, G. (2023). Flexibility clearing in joint energy and flexibility markets considering TSO-DSO coordination. IEEE Trans. Smart Grid 14 (2), 1376–1387. doi:10.1109/TSG.2022.3153634
Kalantar-Neyestanaki, M., and Cherkaoui, R. (2021). Coordinating distributed energy resources and utility-scale battery energy storage system for power flexibility provision under uncertainty. IEEE Trans. Sustain. Energy 12 (4), 1853–1863. doi:10.1109/TSTE.2021.3068630
Li, H., Lin, Y., Lu, Z., Qiao, Y., Qin, J., Kang, C., et al. (2022). Long duration flexibility planning challenges and solutions for power system with ultra high share of renewable energy. IEEE Open Access J. Power Energy 9, 412–424. doi:10.1109/OAJPE.2022.3208835
Liu, L., Li, H., Yang, J., and Yuan, Z. (December 2021). “Research on user classification method of electricity market based on K-means,” in Proceedings of the 2021 3rd international conference on machine learning Taiyuan, China: Big Data and Business Intelligence MLBDBI, 385–390. doi:10.1109/MLBDBI54094.2021.00079
Mitra, J., and Nguyen, N. (2022). Grid-scale virtual energy storage to advance renewable energy penetration. IEEE Trans. Industry Appl. 58 (6), 7952–7965. doi:10.1109/TIA.2022.3202515
Naversen, C. Ø., Parvania, M., Helseth, A., and Farahmand, H. (2022). Continuous hydrothermal flexibility coordination under wind power uncertainty. IEEE Trans. Sustain. Energy 13 (4), 1900–1912. doi:10.1109/TSTE.2022.3175430
Oikonomou, K., Parvania, M., and Khatami, R. (2020). Deliverable energy flexibility scheduling for active distribution networks. IEEE Trans. Smart Grid 11 (1), 655–664. doi:10.1109/TSG.2019.2927604
Pourghaderi, N., Fotuhi-Firuzabad, M., Moeini-Aghtaie, M., Kabirifar, M., and Lehtonen, M. (2023). Exploiting DERs’ flexibility provision in distribution and transmission systems interface. IEEE Trans. Power Syst. 38 (2), 1963–1977. doi:10.1109/TPWRS.2022.3209132
Ran, X., Zhang, J., and Liu, K. (2023). An interval–probabilistic CVaR (IP-CVaR) and modelling for unknown probability distribution of some random variables. IEEE Trans. Power Syst. 38 (3), 2035–2045. doi:10.1109/TPWRS.2022.3185214
Shen, X., Luo, Z., Xiong, J., Liu, H., Lv, X., Tan, T., et al. (2021). Optimal hybrid energy storage system planning of community multi-energy system based on two-stage stochastic programming. IEEE Access 9, 61035–61047. doi:10.1109/ACCESS.2021.3074151
Shi, Y., Dong, S., Guo, C., Chen, Z., and Wang, L. (2021). Enhancing the flexibility of storage integrated power system by multi-stage robust dispatch. IEEE Trans. Power Syst. 36 (3), 2314–2322. doi:10.1109/TPWRS.2020.3031324
Teng, Y., Wang, Z., Li, Y., Ma, Q., Hui, Q., and Li, S. (2019). Multi-energy storage system model based on electricity heat and hydrogen coordinated optimization for power grid flexibility. CSEE J. Power Energy Syst. 5 (2), 266–274. doi:10.17775/CSEEJPES.2019.00190
Vongsing, A., and Raphisak, P. (October 2021). “Peer-to-Peer electricity energy trading using Monte Carlo simulation,” in Proceedings of the 2021 international conference on power, energy and innovations (ICPEI) (Thailand: Nakhon Ratchasima), 21–24. doi:10.1109/ICPEI52436.2021.9690683
Zhang, Y., Han, X., Xu, B., Wang, M., Ye, P., and Pei, Y. (2018). Risk–based admissibility analysis of wind power integration into power system with energy storage system. IEEE Access 6, 57400–57413. doi:10.1109/ACCESS.2018.2870736
Zhou, B., Fang, J., Ai, X., Cui, S., Yao, W., Chen, Z., et al. (2023). Storage right-based hybrid discrete-time and continuous-time flexibility trading between energy storage station and renewable power plants. IEEE Trans. Sustain. Energy 14 (1), 465–481. doi:10.1109/TSTE.2022.3215839
Keywords: energy storage system, flexibility requirements, operational risks, planning strategy, conditional value-at-risk
Citation: Hui Z, Yan H, Li B, He W and Wu X (2024) Optimal configuration of energy storage considering flexibility requirements and operational risks in a power system. Front. Energy Res. 12:1351569. doi: 10.3389/fenrg.2024.1351569
Received: 06 December 2023; Accepted: 06 March 2024;
Published: 22 March 2024.
Edited by:
Michael Carbajales-Dale, Clemson University, United StatesReviewed by:
Hong Fan, Shanghai University of Electric Power, ChinaGuangsheng Pan, Southeast University, China
Copyright © 2024 Hui, Yan, Li, He and Wu. This is an open-access article distributed under the terms of the Creative Commons Attribution License (CC BY). The use, distribution or reproduction in other forums is permitted, provided the original author(s) and the copyright owner(s) are credited and that the original publication in this journal is cited, in accordance with accepted academic practice. No use, distribution or reproduction is permitted which does not comply with these terms.
*Correspondence: Xiong Wu, d3V4aW9uZ0BtYWlsLnhqdHUuZWR1LmNu