 Liang Feng1
 Ni Jianfu
 Zhang Kun
 Zhao Qianyu
 Wang Shouxiang
- 1Grid Electric Power Research Institute Corporation, Nari Group Corporation State, Nanjing, Jiangsu, China
- 2Tianjin Key Laboratory of Power System Simulation Control, Tianjin, China
- 3Key Laboratory of Smart Grid of Ministry of Education (Tianjin University), Tianjin, China
Mobile energy storage has the characteristics of strong flexibility, wide application, etc., with fixed energy storage can effectively deal with the future large-scale photovoltaic as well as electric vehicles and other fluctuating load access to the grid resulting in the imbalance of supply and demand. To this end, this paper proposes a coordinated two-layer optimization strategy for fixed and mobile energy storage that takes into account voltage offsets, in the context of improving the demand for local PV consumption. Among them, the upper layer optimization model takes into account the minimum operating cost of fixed and mobile energy storage, and the lower layer optimization model minimizes the voltage offset through the 24-h optimal scheduling of fixed and mobile energy storage in order to improve the in-situ PV consumption capacity. In addition, considering the multidimensional nonlinear characteristics of the model, the interaction force of particles in the Universe is introduced, and the hybrid particle swarm-gravitational search algorithm (PSO-GSA) is proposed to solve the model, which is a combination of the individual optimization of the particle swarm algorithm and the local search capability of the gravitational search algorithm, which improves the algorithm’s optimization accuracy. Finally, the feasibility and effectiveness of the proposed model and method are verified by simulation analysis with IEEE 33 nodes.
1 Introduction
With the large-scale integration and increasing penetration rate of distributed energy sources, the stochastic, intermittent, and fluctuating nature of their outputs constrains the absorptive capacity of the distribution network. Energy storage systems, leveraging their flexible energy management capabilities and rapid power regulation capabilities, can address issues such as wind and solar power curtailment, voltage violations, and insufficient peak shaving capacity in the distribution network. Properly configuring energy storage systems is of paramount importance for the efficient operation of the distribution network (Wang et al., 2014; Wang et al., 2021).
In recent years, scholars both domestically and internationally have conducted research on grid energy storage optimization strategies to facilitate the integration of renewable energy. In the realm of fixed energy storage systems, Fixed Energy Storage Systems (FESS), literature (Shi et al., 2021) establishes a joint configuration model for solar and storage with the objective of optimizing photovoltaic integration and system economy. Literature (Zhou et al., 2016), considering the impact of solar and storage as well as demand response, develops a microgrid investment profit model with the goals of optimizing photovoltaic utilization and operational economy. Literature (Pasetti et al., 2021) indicates that as the capacity and quantity of energy storage systems increase, they become susceptible to network attacks. Application of Man-in-the-Middle (MitM) attacks on BESS can decrease the lifespan of storage, lead to economic losses, and affect the security and stability of the power grid. Collaboration with Distribution System Operators (DSOs) through increased cross-checks is proposed as a preventive measure. Literature (Morstyn et al., 2018) reviews the progress of microgrid energy storage coordination control strategies and proposes a distributed intelligent microgrid control framework based on intelligent agent networks. The framework aims to provide a universally applicable control strategy for the development of intelligent decentralized power grids, offering insights into the future development of distribution networks. Literature (Lu et al., 2023) presents a dual-layer optimization model for the rapid recovery of EMS distribution systems. The upper layer minimizes system load shedding rate from a scheduling perspective, while the lower layer addresses post-disaster economic dispatch issues through Karush-Kuhn-Tucker (KKT) simplification into a single-layer mixed-integer linear programming problem. Focusing on flexible switchgear in AC/DC distribution networks, literature (Ma et al., 2023) considers equipment constraints, peak shaving, and voltage deviation constraints to build a real and reactive power dispatch model with the minimum operating cost as the primary objective. Through the construction of a two-stage stochastic-distributionally robust optimization model, solar output variability is simulated. Literature (Wei et al., 2023) proposes a flexible interconnection distribution network optimization and control strategy considering transformer and SOP loss characteristics. A dual-layer model is established with the upper layer aiming for the lowest annual comprehensive cost and the lower layer seeking the lowest comprehensive loss. Considering intelligent topology changes, literature (Pan et al., 2023) introduces a consistency algorithm and establishes a SOP cluster control model for distribution networks. Through an SOP cluster strategy based on the consistency algorithm, global SOP collaborative optimization is achieved, enhancing the balance of distribution network feeders. Literature (Liu et al., 2023) presents a dual-layer planning method for distributed power sources and generalized energy storage. The upper layer addresses location and capacity decisions considering system planning costs and response incentives, while the lower layer uses an adaptive parameter particle swarm optimization algorithm to solve the optimization problem based on the continuity and reliability of the distribution network. Literature (Yang et al., 2022) introduces a multi-objective dual-layer structure for energy storage systems. The inner layer aims to maximize operational revenue using the peafowl optimization algorithm, while the outer layer targets minimum operation and maintenance costs, minimum voltage fluctuation, and minimum load fluctuation using the multi-objective peafowl optimization algorithm. Literature (Mao et al., 2019) introduces a dual-layer optimization for generalized energy storage configuration, with the upper layer utilizing a genetic algorithm for energy storage configuration and the lower layer obtaining optimal energy storage operation using dynamic programming. In the aforementioned studies, joint planning of energy storage primarily focuses on the reliability and economic viability on the grid side, yet there is a lack of research on the impact of the uncertainty of distributed energy source outputs on energy storage planning and the optimization of distribution network operation.
Mobile Energy Storage Systems (MESS) are primarily composed of energy storage devices and mobile equipment. Compared to fixed energy storage, MESS can flexibly select access points and capacities based on load characteristics, reducing daily maintenance costs, peak shaving, and enhancing the flexibility of the distribution network. Literature (Astero et al., 2017) indirectly controls photovoltaic integration through electricity prices for electric vehicles. Literature (Kwon et al., 2020) establishes two-stage mobile energy storage optimization models. Literature (Abdeltawab and Mohamed, 2017) considers the fuel costs of mobile energy storage vehicles and the full lifecycle of energy storage. Literature (Yao et al., 2020) utilizes mobile energy storage as a backup power source for natural disasters or emergency situations. In summary, MESS possesses both mobility and energy storage functions, allowing flexible selection of access points and capacities based on grid operating conditions. This capability can effectively avoid redundant waste, reduce daily maintenance costs, and significantly improve the economic viability of peak shaving. However, its drawback lies in its smaller capacity. MESS can complement fixed energy storage, jointly participating in grid regulation. Through real-time monitoring of power system operations, rational control of both BESS and MESS is crucial for improving load characteristics (Chen et al., 2016).
This paper integrates FESS and MESS collaborative optimization methods, proposing energy storage configuration and operation strategies to enhance photovoltaic absorption capacity in extreme scenarios. Both upper and lower layers adopt an improved Particle Swarm Optimization-Gravitational Search Algorithm (PSO-GSA) method, combining the individual optimization capability of the particle swarm algorithm with the local search capability of the gravitational search algorithm to enhance global search capability. In the upper layer, decision variables include fixed energy storage site selection, capacity, and mobile energy storage access nodes and capacity, comprehensively considering the economic operation of FESS and MESS. The lower layer dynamically optimizes energy storage charging and discharging strategies with the objective of minimizing grid voltage deviation. In extreme photovoltaic scenarios, the goal is to enhance on-site photovoltaic absorption capacity and improve grid operation conditions.
2 Distribution network component model
2.1 Photovoltaic penetration rate definition
Photovoltaic penetration rate is defined as the ratio of the maximum photovoltaic output power to the maximum load output power:
In the formula 1:
People have different criteria for judging the level of photovoltaic penetration. Generally, when it is below 20%, it is considered a low-penetration stage, where the scale of photovoltaic integration into the grid is small, and its impact on the power grid is minimal. As the penetration of photovoltaics increases, when the photovoltaic penetration rate reaches 20%–80%, it becomes necessary to address the issue of enhancing the carrying capacity of photovoltaics in concentrated areas. At this stage, the significant integration of photovoltaics may lead to power reverse flow in the power system. When the photovoltaic penetration rate exceeds 100%, it can be considered a high-penetration stage. At this point, there is a substantial reverse flow of photovoltaic power into the power system, and the role of photovoltaic energy shifts to the supply side. The difficulty of on-site absorption of photovoltaics increases, requiring interventions such as energy storage to enhance the capacity for photovoltaic integration.
2.2 Photovoltaic on-site absorption rate definition
The on-site absorption of photovoltaic power is primarily influenced by the load and energy storage. In this paper, we define the on-site absorption rate of photovoltaic power as:
In the formula 2: Where
2.3 Distributed power generation model
2.3.1 Photovoltaic output model
The photovoltaic generation intensity is controlled by the regional solar irradiance. Solar irradiance is commonly considered to follow a Beta distribution, where the Beta probability density function is given by:
In the formula 3: Where
In the formulas 4, 5: Where
2.3.2 Fixed energy storage model
The charging and discharging model for fixed energy storage is as follows:
In the formula 6: Where
2.3.3 Mobile energy storage model
The charging and discharging model for mobile energy storage is as follows:
In the formulas 7–10: Where
2.4 Electric vehicle charging model
Monte Carlo sampling is used to analyze the electric vehicle charging model.
(1)Probability Distribution of Daily Driving Distance
Processing behavioral data on electric vehicle usage, it is determined that the daily driving distance follows a log-normal distribution, i.e.,:
In the formula 11: Where
(2)Probability Distribution of Initial Charging Time
The charging time of electric vehicles
In the formula 12: Where
3 Construction of dual-layer optimization model in electrical engineering terminology
The dual-layer optimization model as shown in Figure 1.
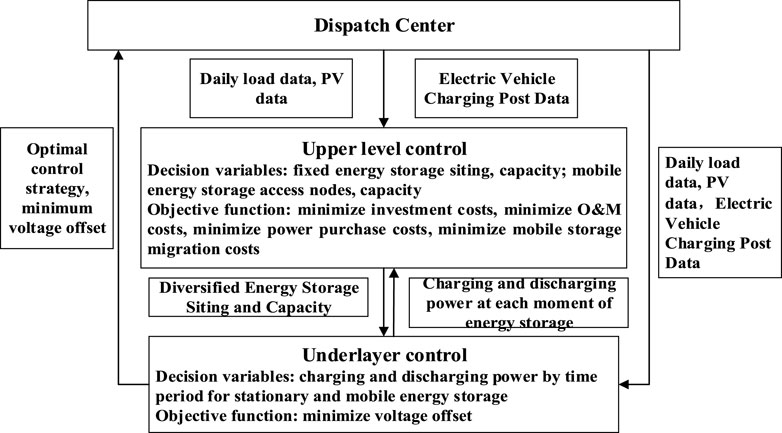
FIGURE 1. Dual layer optimization model.
The upper-layer optimization model has decision variables for fixed energy storage location, capacity, and mobile energy storage access nodes and capacity. The optimization objectives include minimizing investment costs, operating costs, power purchase costs, and mobile energy storage migration costs. The constraints involve energy storage output constraints and grid power purchase constraints.
The lower-layer optimization model has decision variables for the charging and discharging power of fixed and mobile energy storage during different time periods. The optimization objective is to minimize voltage offset. Constraints include voltage amplitude constraints, distributed renewable energy output constraints, and power balance constraints.
The dispatch center inputs photovoltaic data, daily load data, and electric vehicle charging station data. The upper layer solves the model to minimize operating costs, and the location and capacity of energy storage are passed as parameters to the lower layer. The lower layer controls the charging and discharging power of energy storage at each moment to minimize voltage offset. Iterations are performed until the optimal control strategy is obtained.
3.1 Upper-layer objective function
The upper layer involves multi-energy storage optimization configuration, with the objective function being the minimization of equipment investment costs, equipment operating costs, and grid power purchase costs.
In the formula 13: Where
(1) Minimize equipment investment costs
The equipment investment cost includes one-time investment costs for both energy storage devices and photovoltaic equipment.
In the formula 14:
(2) Minimize equipment operating costs
The operating cost of equipment refers to the costs associated with regular maintenance and repair of equipment damage.
In the formula 15:
(3) Minimize grid power purchase costs
In the formula 16:
(4) Minimize the cost of relocating mobile energy storage
In the formula 17: Where
3.2 Upper-layer objective constraints
(1) Energy Storage Output Constraint.
In the formula 18: Where
(2) Electricity Purchasing Power Constraint
In the formula 19: Where
3.3 Lower-level objective function
The lower level involves 24-h economic dispatch of the distribution network, with the minimization of voltage deviation as the objective function.
In power systems, voltage difference reflects the operational safety of the distribution network, as excessive voltage deviation can impact the operation of electrical equipment and the quality of electrical energy.
In the formulas 20, 21: Where
3.4 Lower-level objective constraints
(1) Voltage magnitude constraints
In the formula 22: Where
(2) Distributed New Energy Output Constraint
In the formula 23: Where
(3) Power Balance Constraint
In the equation 24:
4 Optimization solving algorithm based on PSO-GSA
The ultimate goal of heuristic algorithms is global optimization. To achieve this goal, the exploratory and exploitative capabilities of heuristic algorithms are particularly crucial.
4.1 Particle swarm algorithm
The particle swarm algorithm (Anantathanavit and Munlin, 2013) models each particle considering the current velocity, current position, and a distance-modifying function to pbest and gbest as follows.
In the equation 25:
In the formula 26: Where
4.2 Gravity search algorithm
GSA (Doraghinejad et al., 2012) originates from Newton’s fundamental theory: the interaction force among particles in the Universe, a force proportional to the particle mass and inversely proportional to the distance between them, is modeled as follows.
In the formula 27: Where
In the formula 28: Where
In the formula 29: Where
In the formula 30: Where represents
In the formula 31: Where
In the formula 32: Where
4.3 PSO-GSA hybrid algorithm
The PSO-GSA hybrid algorithm combines the individual optimization capability of PSO with the local search ability of GSA such as the formulas 33, 34. The improved convergence of PSO-GSA surpasses that of standalone PSO and GSA.
Initially, each particle is considered to have a candidate solution. After initialization, the gravitational force, gravitational constant, and resultant force between particles are calculated. During the iteration process, the algorithm updates to the current best solution, computes the velocity of particles for the (n+1)-th generation, and finally updates the positions of the particles.
The improved convergence of PSO-GSA is superior to that of PSO and GSA, as shown in Figure 2.
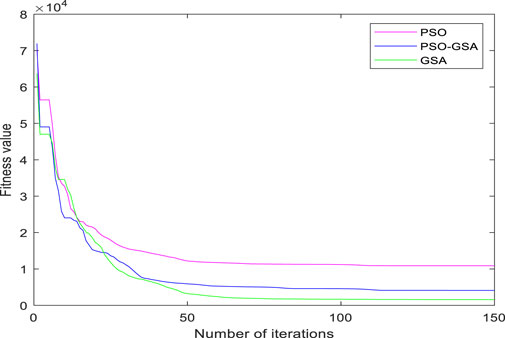
FIGURE 2. Comparison of convergence speed of different functions.
4.4 The Flowchart of the PSO-GSA Algorithm.
The flow chart of the PSO-GSA algorithm is shown in Figure 3.

FIGURE 3. Algorithm flowchart.
5 Case analysis
5.1 Case parameters
Simulations were conducted on the IEEE 33-node distribution network using Matlab 2021a software. The system’s base voltage is 12.66 kV, and the maximum load is 3.715 MW. To provide reserve capacity for photovoltaic integration at system nodes, the upper limit of node voltage is set to 1.05, and the lower limit is set to 0.95. Photovoltaic panels are integrated at nodes 9 and 28, while an electric vehicle charging station is added at node 20, as illustrated in Figure 4.
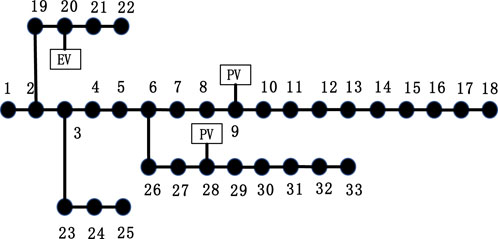
FIGURE 4. IEEE 33 node distribution network.
Monte Carlo simulations were employed to model the starting density and charging power of electric vehicles, with a total of 2000 vehicles. The simulation results are presented in Appendix Figure A1 and Figure A2.
This study focuses primarily on the impact of the fixed and mobile energy storage access points and capacities on the integration of photovoltaics. The basic information for both fixed and mobile energy storage is as follows: the energy storage maintenance coefficient is 0.02; the unit capacity investment cost is 1000 CNY/KW; the discount rate is 0.08; the service life is 20 years. For mobile energy storage, the cost per kilometer varies based on the distance traveled each time, and here it is calculated at a monthly cost of 3,000 Yuan. The energy storage electricity prices are 0.31 CNY/kWh from 0:00 to 8:00, 0.84 CNY/kWh from 9:00 to 11:00, 0.31 CNY/kWh from 12:00 to 13:00, 0.84 CNY/kWh from 14:00 to 21:00, and 0.31 CNY/kWh from 22:00 to 24:00.
To achieve coordinated optimization of fixed and mobile energy storage for enhancing the distribution network’s consumption capacity, a PSO-GSA hybrid algorithm is applied to both the upper-layer multi-energy storage optimization configuration and the lower-layer energy storage optimization scheduling. The fixed energy storage locations range from node 2 to 33, with capacities from 0.5 MW to 1 MW. The access nodes for mobile energy storage range from node 2 to 33 (assuming node 1 is the reference node), with capacities from 0.4 MW to 0.9 MW. Fixed energy storage charges during off-peak hours or when photovoltaic energy cannot be accommodated and discharges during peak electricity demand. In contrast, mobile energy storage offers more flexible charge and discharge regulation, responding dynamically to real-time situations in case of emergencies or when fixed energy storage cannot effectively regulate. The PSO-GSA hybrid algorithm is applied to both upper and lower layers with 50 particles each, 50 iterations, an individual learning factor of 0.5, and a global learning factor of 1.5.
5.2 Optimization result analysis
Firstly, without the addition of any energy storage, gradually increasing photovoltaics until the voltage exceeds the limit at nodes 9 or 28, marks the maximum photovoltaic capacity that the distribution network can bear. The maximum capacity is determined to be 2.9 MW.
Considering the future large-scale integration of photovoltaics and the transition of photovoltaic energy from the demand side to the supply side, there may be reverse power flows. In such scenarios, energy storage can be flexibly adjusted to enhance photovoltaic energy integration, reduce the risk of voltage exceeding limits, and improve the stability of the power system. When there is a sudden increase in photovoltaics and fixed energy storage devices cannot regulate effectively, flexible adjustments can be made using mobile energy storage. The following case considers an extreme photovoltaic output scenario of 2.9 MW and a charging station output of 0.6 MW.
To validate the effectiveness of the proposed model and method, a comparison is made across four different scenarios. Scenario One: integration of photovoltaics without energy storage; Scenario Two: integration of photovoltaics with optimized configuration of fixed energy storage; Scenario Three: integration of photovoltaics with coordinated optimization of fixed and mobile energy storage; Scenario Four: integration of photovoltaics, electric vehicle charging station, and coordinated optimization of fixed and mobile energy storage. The analysis includes voltage offset, multi-energy storage operating costs, and on-site photovoltaic integration rate, as shown in Table 4-1.
According to Table 1, compared to Scenario One, Scenario Two, which adds fixed energy storage, reduces the voltage offset by 0.0010 and increases the on-site photovoltaic integration rate by 3.01%. Scenario Three, with the addition of both fixed and mobile energy storage, reduces the voltage offset by 0.0018 and increases the on-site photovoltaic integration rate by 5.77% compared to Scenario One. In Scenario Four, with the addition of an electric vehicle charging station load, the voltage offset is 0.0033, the on-site photovoltaic integration rate is 71.39%. Compared to Scenario One, the voltage offset increases by 0.1638, and the curtailment rate decreases by 0.8081%. These results indicate that fixed energy storage adjustment has limitations, and through coordinated optimization of fixed and mobile energy storage, the on-site photovoltaic integration can be increased, and voltage offset can be reduced.
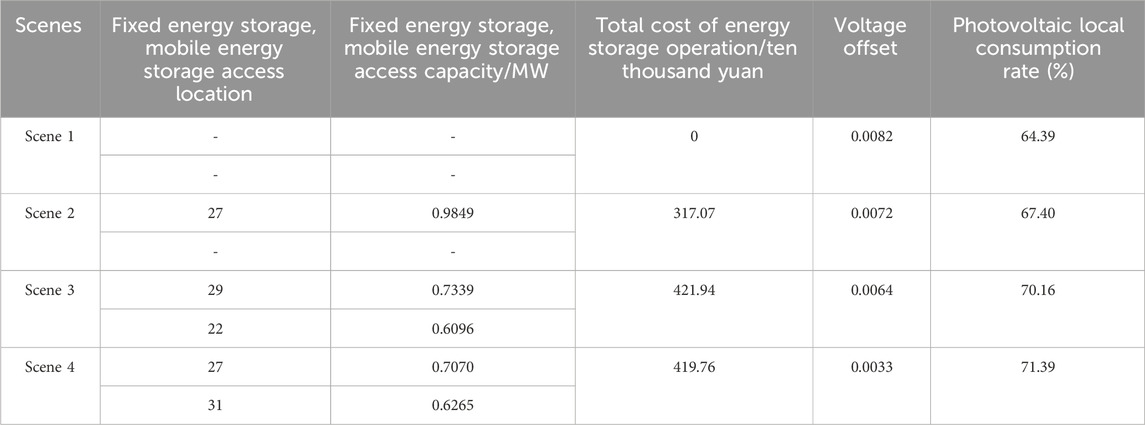
TABLE 1. Energy storage parameters.
To further illustrate the improvement in power grid stability through the coordinated optimization of fixed and mobile energy storage, a comparative analysis is conducted among Scenario One, Scenario Two, and Scenario Three.
As shown in Figure 5, Figure 6, and Figure 7, in extreme photovoltaic Scenario One, voltage exceeds the limit at nodes 9 and 28 when photovoltaics are added. From the node voltage diagram in Scenario Two, it is evident that by adding fixed energy storage, only node 9 experiences a voltage limit exceedance, and the degree of voltage offset is smaller compared to Scenario One. The node voltage diagram in Scenario Three indicates that through the coordinated action of fixed and mobile energy storage, all nodes are within the range of 0.95 p. u. to 1.05 p. u., demonstrating the efficient synergy between fixed and mobile energy storage. This synergy can significantly enhance the capacity for photovoltaic integration.
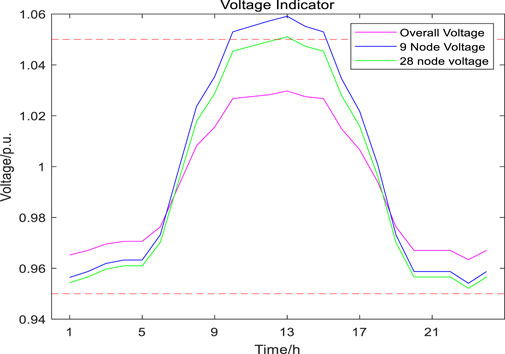
FIGURE 5. Scene 1 target node voltage.
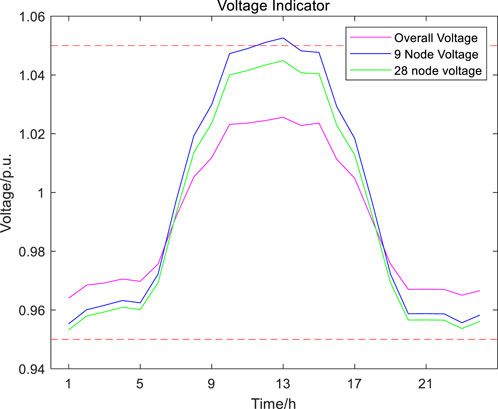
FIGURE 6. Scene 2 target node voltage.
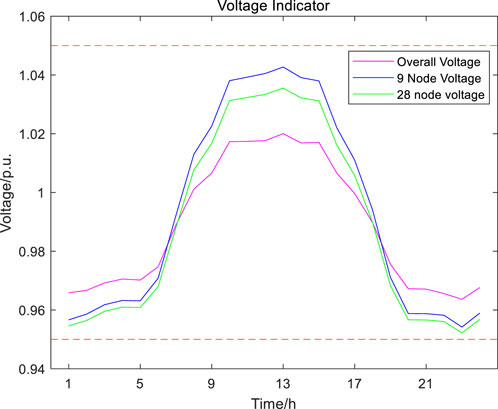
FIGURE 7. Scene 3 target node voltage.
As shown in Figure 8, for the charge and discharge strategy of fixed energy storage, during 3:00–7:00 when the grid load is relatively low, the energy storage system remains in the charging state. During 10:00–14:00 when the load is high and there is sufficient photovoltaic output, fixed energy storage discharges at a lower power. From 19:00 to 22:00, when the load is high, fixed energy storage discharges, and when fixed energy storage cannot meet the load requirements, coordinated operation with mobile energy storage is employed to jointly provide power support to the grid.

FIGURE 8. Charging and discharging strategy for stationary energy storage in Scenario 3.
As illustrated in Figure 9, due to the uncertainty of photovoltaic output, there are two charging methods for the charge and discharge strategy of mobile energy storage: one is during 3:00–7:00 when the electricity price is lower, mobile energy storage utilizes grid electricity for charging; the other is during 14:00–16:00 when the load is low and photovoltaics cannot fully integrate, mobile energy storage is charged at the access node. During peak electricity demand periods at 10:00–14:00 and 19:00–22:00, if fixed energy storage cannot effectively regulate the grid voltage, coordinated discharge of mobile and fixed energy storage is implemented to maintain the stable operation of the power system.
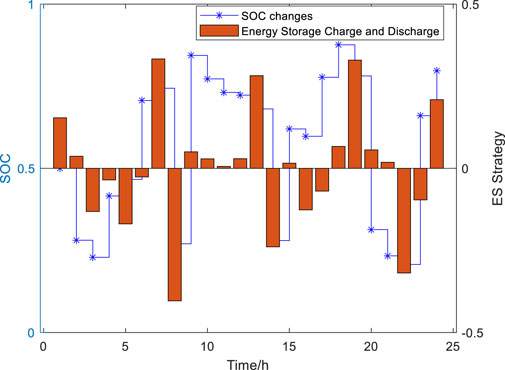
FIGURE 9. Mobile energy storage charging and discharging strategy in scenario 3.
6 Conclusion
Energy storage, due to its flexible output and dynamic adjustment characteristics, can provide rich elastic support for the grid, facilitating the efficient integration of large-scale distributed new energy sources and ensuring the stable operation of the grid. This paper proposes a multi-energy storage coordinated optimization strategy that takes into account voltage offset. Initially, a two-layer model is established around the optimal operation cost of Mobile Energy Storage System and Fixed Energy Storage System, as well as minimizing the grid voltage offset. The model is solved and validated using the PSO-GSA algorithm in the IEEE 33-node distribution system, leading to the following conclusions.
(1) In extreme photovoltaic scenarios, based on predicted load data, using the objectives of minimizing operating costs and minimizing voltage offset, BESS and FESS are optimized in terms of configuration and dispatch. Suitable parameters for energy storage are selected, and mobile energy storage is dispatched to different nodes to provide charging and discharging services. By comparing fixed energy storage with the coordinated operation of fixed and mobile energy storage, and optimizing the configuration and operational strategies of energy storage, the results show that coordinated operation of fixed and mobile energy storage can improve on-site photovoltaic integration while reducing grid voltage offset.
(2) Guiding energy storage systems to participate in the optimal operation of distribution networks through time-of-use electricity prices and time-of-use loads. The strategy involves charging during low demand and discharging during high demand, balancing the demands of both the grid side and the load side. This approach reduces curtailment, minimizes the impact of distributed energy source output instability on the grid, and equips the distribution network with sufficient flexibility to adapt to peak-valley differences, fluctuations, and the growing normality of daily loads.
(3) The mathematical model presented in this paper exhibits multi-dimensional non-linear characteristics. The PSO-GSA hybrid algorithm is employed for model solving, combining the individual optimization of particle swarm algorithm with the local search ability of gravitational search algorithm. This hybrid approach offers better convergence for solving multi-dimensional non-linear problems.
The optimization strategies mentioned in this paper do not consider the impact of different seasons on photovoltaic output, the influence of mobile energy storage routes, and traffic congestion. In future work, these factors, along with the consideration of the impact of different seasons on photovoltaic output, traffic congestion, and the use of smart switches, could be incorporated into the analysis.
Data availability statement
The raw data supporting the conclusion of this article will be made available by the authors, without undue reservation.
Author contributions
LF: Writing–original draft, Writing–review and editing, Conceptualization, Funding acquisition, Supervision. NJ: Writing–original draft, Writing–review and editing, Funding acquisition, Investigation. YZ: Writing–original draft, Writing–review and editing, Funding acquisition, Methodology. ZK: Writing–original draft, Writing–review and editing, Conceptualization, Software. ZQ: Conceptualization, Data curation, Formal Analysis, Funding acquisition, Methodology, Supervision, Validation, Writing–original draft, Writing–review and editing. WS: Writing–original draft, Writing–review and editing, Funding acquisition, Investigation, Methodology.
Funding
The author(s) declare financial support was received for the research, authorship, and/or publication of this article. This research was funded by NR Group Science and Technology Project ‘Research on Functional Structure, System Architecture, Evaluation Index and Method of Distribution Network with High Proportion of New Energy’ (524608210241).
Conflict of interest
Authors LF, NJ, and YZ were employed by Nari Group Corporation State.
The remaining authors declare that the research was conducted in the absence of any commercial or financial relationships that could be construed as a potential conflict of interest.
Publisher’s note
All claims expressed in this article are solely those of the authors and do not necessarily represent those of their affiliated organizations, or those of the publisher, the editors and the reviewers. Any product that may be evaluated in this article, or claim that may be made by its manufacturer, is not guaranteed or endorsed by the publisher.
References
Abdeltawab, H. H., and Mohamed, Y. A.-R. I. (2017). Mobile energy storage scheduling and operation in active distribution systems. IEEE Trans. Ind. Electron. 64, 6828–6840. doi:10.1109/TIE.2017.2682779
Anantathanavit, M., and Munlin, M.-A. (2013). “Radius particle swarm optimization,” in 2013 International Computer Science and Engineering Conference (ICSEC), Nakorn Pathom, Thailand, September 4-6, 2013 (IEEE), 126–130. doi:10.1109/ICSEC.2013.6694765
Astero, P., Choi, B. J., and Liang, H. (2017). Multi-agent transactive energy management system considering high levels of renewable energy source and electric vehicles. IET Generation, Transm. Distribution 11, 3713–3721. doi:10.1049/IET-GTD.2016.1916
Chen, Y., Zheng, Y., Luo, F., Wen, J., and Xu, Z. (2016). Reliability evaluation of distribution systems with mobile energy storage systems. IET Renew. Power Gener. 10, 1562–1569. doi:10.1049/iet-rpg.2015.0608
Doraghinejad, M., Nezamabadi-pour, H., Hashempour Sadeghian, A., and Maghfoori, M. (2012). “A hybrid algorithm based on gravitational search algorithm for unimodal optimization,” in 2012 2nd International eConference on Computer and Knowledge Engineering (ICCKE), Mashhad, 18-19 October 2012, 129–132. doi:10.1109/ICCKE.2012.6395365
Kwon, S.-Y., Park, J.-Y., and Kim, Y.-J. (2020). Optimal V2G and route scheduling of mobile energy storage devices using a linear transit model to reduce electricity and transportation energy losses. IEEE Trans. Ind. Appl. 56, 34–47. doi:10.1109/TIA.2019.2954072
Liu, Z., Yu, P., and Li, J. (2023). Planning of distributed generation and generalized energy storage in distribution network considering operation characteristics. Dianli Zidonghua Shebei/Electric Power Autom. Equip. 43, 72–79. doi:10.16081/j.epae.202208029
Lu, Q., Jiang, L., Bie, Z., Zheng, J., Yang, Y., Yu, Z., et al. (2023). Post-disaster fault restoration strategy for distribution network considering optimal scheduling of user-side energy. Automation Electr. Power Syst. 47, 44–54. doi:10.7500/AEPS20220226001
Ma, Z., Wei, Z., Chen, S., Zheng, Y., and Wu, T. (2023). Active-reactive power optimal dispatch of AC/DC distribution network based on soft open point. Automation Electr. Power Syst. 47, 48–58. doi:10.7500/AEPS20220702002
Mao, M., Liu, Y., Zhang, L., and Zhang, J. (2019). Optimal configuration of generalized energy storage in distribution network with high-penetration renewable energy. Dianli Xit. Zidonghua/Automation Electr. Power Syst. 43, 77–85. doi:10.7500/AEPS20180615002
Morstyn, T., Hredzak, B., and Agelidis, V. G. (2018). Control strategies for microgrids with distributed energy storage systems: an overview. IEEE Trans. Smart Grid 9, 3652–3666. doi:10.1109/TSG.2016.2637958
Pan, Y., Geng, G., and Jiang, Q. (2023). Consistency algorithm based control strategy for soft open point cluster. Dianli Xit. Zidonghua/Automation Electr. Power Syst. 47, 101–109. doi:10.7500/AEPS20211017004
Pasetti, M., Ferrari, P., Bellagente, P., Sisinni, E., de Sá, A. O., Prado, C. B. do, et al. (2021). Artificial neural network-based stealth attack on battery energy storage systems. IEEE Trans. Smart Grid 12, 5310–5321. doi:10.1109/TSG.2021.3102833
Shi, M., Xu, K., Wang, J., Yin, R., and Zhang, P. (2021). Short-term photovoltaic power forecast based on grey relational analysis and GeoMAN model. Trans. China Electrotech. Soc. 36, 2298–2305. doi:10.19595/j.cnki.1000-6753.tces.200538
Wang, C., Wu, Z., and Li, P. (2014). The prospects and challenges of distributed electricity storage technology. Automation Electr. Power Syst. 38, 1–73. doi:10.7500/AEPS20140108002
Wang, S., Liu, Q., Zhao, Q., and Wang, H. (2021). Connotation analysis and prospect of distribution network elasticity. Automation Electr. Power Syst. 45, 1–9. doi:10.7500/AEPS20200112006
Wei, C., Li, J., Tu, C., Wang, X., Guo, Q., and Xiao, F. (2023). Optimal regulation and control strategy for flexible interconnected distribution network considering loss characteristics of transformers and soft open points. Dianli Xit. Zidonghua/Automation Electr. Power Syst. 47, 69–78. doi:10.7500/AEPS20220915007
Yang, B., Wang, J., Yu, L., Cao, P., Shu, H., and Yu, T. (2022). Peafowl optimization algorithm based Bi-level multi-objective optimal allocation of energy storage systems in distribution network. Shanghai Jiaot. Daxue Xuebao/Journal Shanghai Jiaot. Univ. 56, 1294–1307. doi:10.16183/j.cnki.jsjtu.2021.371
Yao, S., Wang, P., Liu, X., Zhang, H., and Zhao, T. (2020). Rolling optimization of mobile energy storage fleets for resilient service restoration. IEEE Trans. Smart Grid 11, 1030–1043. doi:10.1109/TSG.2019.2930012
Zhou, N., Fan, W., Liu, N., Lin, X., Zhang, J., and Lei, J. (2016). Battery storage multi-objective optimization for capacity configuration of PV-based microgrid considering demand response. Dianwang Jishu/Power Syst. Technol. 40, 1709–1716. doi:10.13335/j.1000-3673.pst.2016.06.015
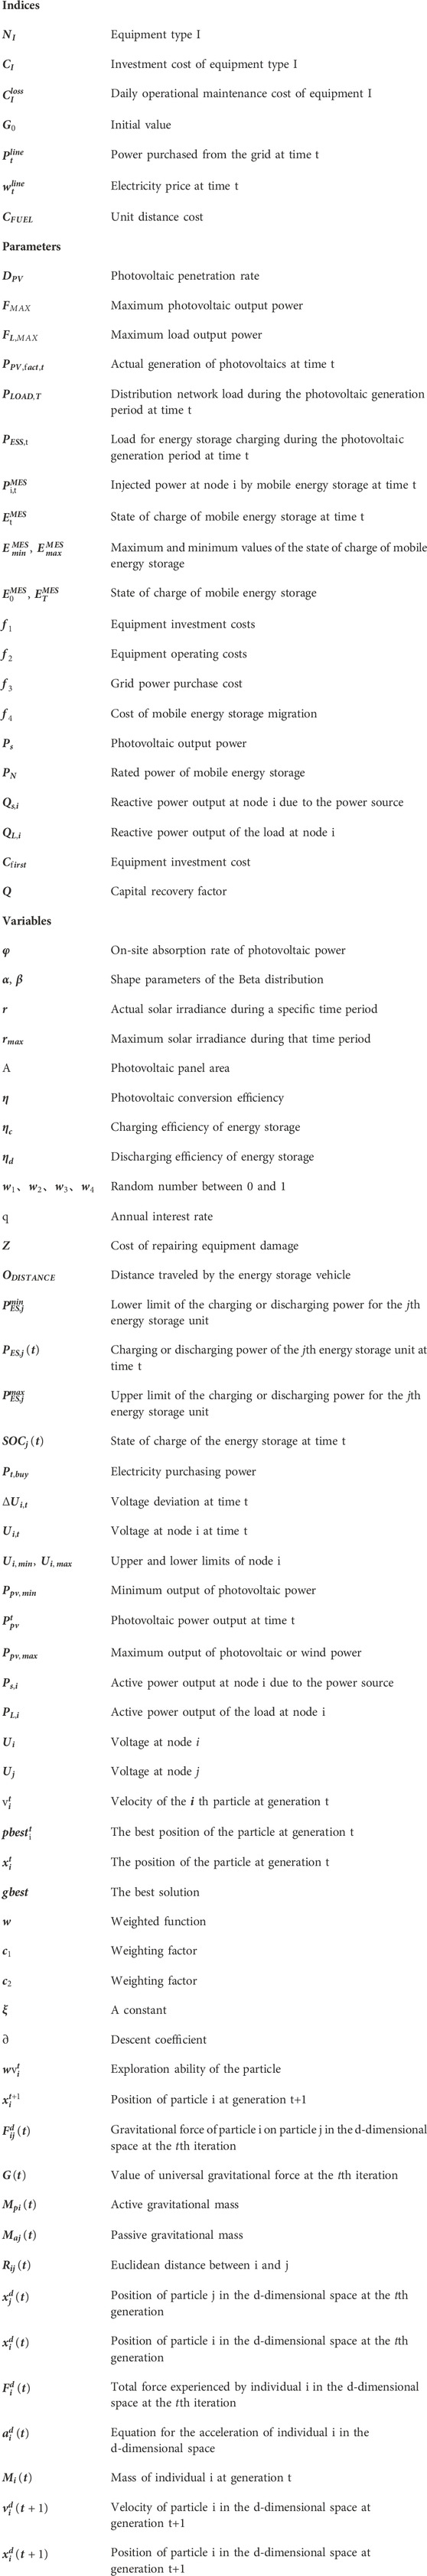
Nomenclature
Keywords: distribution grids, photovoltaic local consumption, fixed energy storage systems, mobile energy storage systems, energy storage scheduling strategies, hybrid particle swarmgravitational search algorithms
Citation: Feng L, Jianfu N, Zhuofei Y, Kun Z, Qianyu Z and Shouxiang W (2024) Fixed and mobile energy storage coordination optimization method for enhancing photovoltaic integration capacity considering voltage offset. Front. Energy Res. 12:1351324. doi: 10.3389/fenrg.2024.1351324
Received: 06 December 2023; Accepted: 15 January 2024;
Published: 02 February 2024.
Edited by:
Rufeng Zhang, Northeast Electric Power University, ChinaReviewed by:
Xiaoxue Wang, Hebei University of Technology, ChinaGuoqiang Zu, State Grid Tianjin Electric Power Research Institute, China
Lv Chaoxian, China University of Mining and Technology, China
Copyright © 2024 Feng, Jianfu, Zhuofei, Kun, Qianyu and Shouxiang. This is an open-access article distributed under the terms of the Creative Commons Attribution License (CC BY). The use, distribution or reproduction in other forums is permitted, provided the original author(s) and the copyright owner(s) are credited and that the original publication in this journal is cited, in accordance with accepted academic practice. No use, distribution or reproduction is permitted which does not comply with these terms.
*Correspondence: Zhang Kun, a3VuemhhbmcxOTk4QHRqdS5lZHUuY24=