 Hong Zhu
 Zijian Hu
- Nanjing Power Supply Company, State Grid Jiangsu Electric Power Co., Ltd., Nanjing, China
As the scale of the power grid expands and distributed energy sources are integrated, along with the emergence of random loads, topological control of distribution networks has become a novel means of control. Therefore, data-driven power flow calculations must be capable of rapidly and accurately computing power flow results even when there are changes in the network’s topology. In this paper, a data-driven power flow calculation method is proposed to take topological changes into account. Based on initial loop data, we employ an undirected-graph delooping-backtracking method to generate a set of feasible topological samples. Using the Monte Carlo method on this basis, we generate feasible samples for the network’s topology and power injection, thereby establishing a training dataset. By training a deep neural network on these samples and adjusting network parameters, we effectively address power flow calculations in the presence of topological changes. Case study results demonstrate that the data-driven power flow calculation method, considering topological changes, can rapidly and accurately compute power flow results when topology alterations occur.
1 Introduction
Power flow calculation in electric power systems is the process of determining voltage, current, and power distribution throughout the entire system based on given operational conditions and network structure. It is a fundamental technique that underpins various aspects of electric power systems, including system planning, dispatch, stability analysis, and power market operations, playing a crucial role in ensuring the stability, reliability, and efficient operation of the power grid.
Traditional power flow calculation methods, including the Gauss-Seidel method, Newton’s method, and the Fast Decoupled method, are widely used. However, these methods are all model-based approaches. On the one hand, these methods rely on complex mathematical models and detailed network parameter information, which can be difficult to obtain and prone to errors. On the other hand, these methods require iterative calculation for solving nonlinear power equations, posing challenges to computational speed in large-scale systems.
With the advancement of machine learning technology, data-driven power flow calculation has garnered significant attention from scholars. In comparison to traditional power flow calculation methods, data-driven approaches offer notable advantages. On one hand, data-driven power flow calculation does not require an in-depth understanding of network parameters, thus improving its applicability and accuracy. On the other hand, it does not necessitate complex iterative computations and can rapidly provide results using pre-trained models, making it more suitable for real-time scheduling and emergency response in power systems.
In recent years, scholars have conducted extensive research around data-driven power flow calculation.
In reference (Tan et al., 2020), a hybrid physical model-driven and data-driven approach for linearizing power flow model is proposed. It can retain the useful inherent information from the physical model and utilize the ability of data analysis to extract the inexplicit linear relationship. A data-driven linearization approach of PF equations is proposed in (Liu et al., 2019). Both partial least squares and Bayesian linear regression based algorithms are introduced to address the collinearity. In (Cui et al., 2020), a data-driven slow dynamic characteristic extraction and state estimation method are proposed to overcome the shortcomings of the computational burden caused by the Jacobian matrix inversion of the traditional method. A data-driven chance-constrained optimal gas-power flow (OGPF) calculation method without any prior assumption on the distribution of uncertainties of wind power generation is proposed in reference (Wang et al., 2021). Chen J et al. (2022) proposes a data-driven power flow (PF) linearization approach for three-phase SPF calculation. An approach with high adaptability to the nonlinearity of power flow is proposed in 6, which can significantly improve the calculation accuracy. Reference (Xing et al., 2022; Xing et al., 2022) respectively introduce a single bus data-driven power estimation based on modified linear power flow model and a modified data-driven power flow model for power estimation with incomplete bus data. The models proposed in these references exhibit higher accuracy compared to the linear power flow model. In (Crozier and Baker, 2022), a data-driven method for determining constraints that may be excluded from the formulation is proposed. A novel machine learning (ML) based data-driven risk assessment model for early-warning of power system transmission congestion is proposed in (Zhang et al., 2022). Chen Y et al. (2022) presents a novel data-driven power flow (DDPF)calculation method based on exact linear regression equations (ELREs), which offers higher computation efficiency. Liu et al. (2022a) and Chen et al. (2020) introduce a data-driven-aided linear three-phase power flow model for distribution power systems (DPSs), which offers higher accuracy and robustness. In (Liu et al., 2022b), a robust data-driven linear power flow (RD-LPF) model is constructed, which can significantly reduce average errors and unacceptable worst-case linearization errors. Reference (Li et al., 2023) introduces a data-driven linear power flow calculation model that incorporates the Kirchhoff’s Current Law(KCL). This model can be embedded in optimal power flow for distribution networks. A regression approach combining the principal component analysis (PCA), support vector regression (SVR) and ridge regression (RR) is developed, which improves the accuracy of PF calculation especially in the presence of bad data. A novel multi energy flow analysis method for integrated energy systems is proposed in (Zhu and Zhou, 2023) to learn the mapping relationship between the given variable and the demanded variable from the historical operation data. In (Shao et al., 2023), a physical-model-aided data-driven linear power flow (PD-LPF) model is proposed as a solution for addressing the issue of insufficient training data. It introduces physical model parameters to assist the data-driven training process, demonstrating excellent accuracy and robustness under severe missing-data conditions.
However, the data-driven power flow calculation problems addressed in the aforementioned studies assume that the topology of the electrical grid remains fixed. This allows for accurate power flow calculations in networks with a static structure. However, for distribution networks where topology changes due to network reconfiguration operations are possible, this can result in inaccurate power flow calculation results. This paper focuses on data-driven power flow calculations that take into account topological changes. To obtain a set of topological samples for training, we employ an undirected-graph delooping-backtracking method. To establish a more accurate relationship between topology and voltage/power, we utilize deep neural networks to learn from these samples, effectively addressing power flow calculation challenges posed by topological changes. The overall framework of the proposed data-driven power flow calculation method is presented in Figure 1.
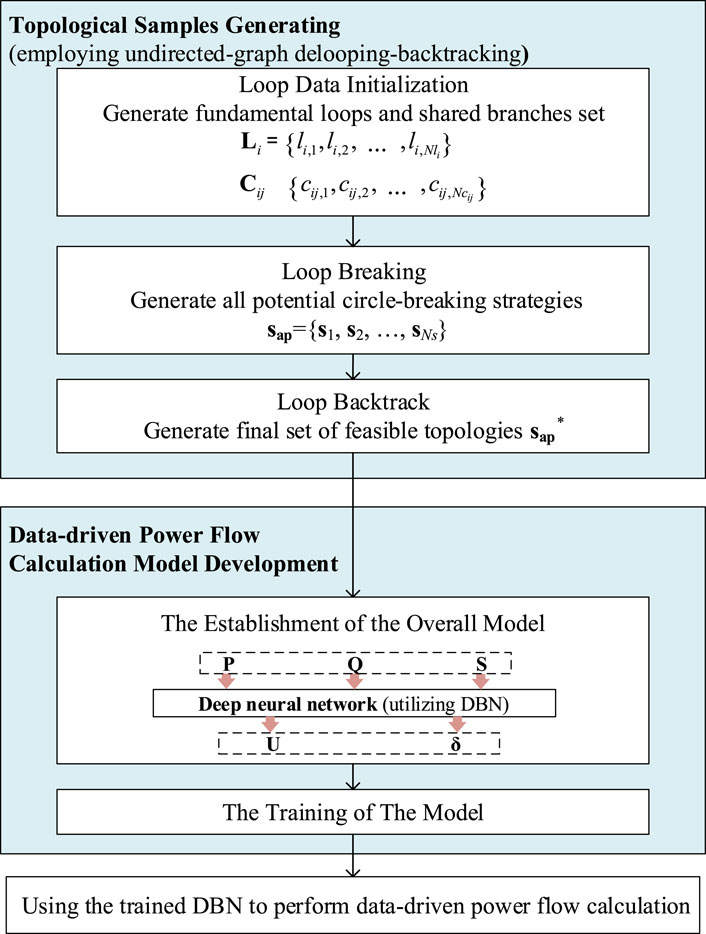
FIGURE 1. The overall framework of the proposed data-driven power flow calculation method.
The contributions of this paper are as follows:
1) A feasible topological sample generation method based on undirected-graph delooping-backtracking is proposed, and feasible topological samples are established through loop data initialization, loop breaking and loop backtracking operations.
2) A data-driven power flow calculation method considering topological changes is proposed, and a power flow calculation model considering topological changes is obtained by encoding the topological data and integrating it into the input of the data-driven model, and using DBN for training.
The structure of this paper is as follows: Section 2 introduces the method for generating topological samples based on undirected-graph delooping-backtracking. Section 3 presents the data-driven power flow calculation model. Section 4 provides the case studies conducted in this paper. Finally, Section 5 offers the conclusions drawn from the research.
2 Topological samples generating based on undirected-graph delooping-backtracking
Radiation constraints are fundamental constraints in the operation of distribution networks. Neglecting radiation constraints during the process of generating topological samples can result in a large number of infeasible topological samples being incorporated into the data-driven model. This section employs the undirected-graph delooping-backtracking method to generate a feasible set of network topologies. Based on this, topological samples for training neural networks are generated through Monte Carlo simulations, ensuring that each topological sample satisfies radiation constraints.
The undirected-graph delooping-backtracking method involves obtaining a feasible set of topologies by breaking loops and backtracking on the complete network graph. The specific process includes three main steps: loop data initialization, loop breaking, and loop backtracking.
2.1 Loop data initialization
The first step is loop data initialization, and the algorithm is given in Algorithm 1. Initially, identify all fundamental loops in the network, denoted as Li, and find a total of NL fundamental loops. Assuming that the network branches are represented as
Algorithm 1.Loop Data Initialization.
Input: Branch data of the network
Output: Loop data of the network
Find NL fundamental loops of the network
For m from 1 to NB
For i from 1 to NL
If bm belongs to Li (bm∈Li)
Add bm into Li:
End if
For j from i+1 to Nli
If bm belongs to Cij (bm∈Li & bm∈Lj)
Add bm into Cij:
End if
End for
End for
End for
Output loop data
2.2 Loop breaking
After obtaining the set of branches for each fundamental loop, the next step is to break the loops, and the algorithm is presented in Algorithm 2. For each fundamental loop, we iteratively disconnect one branch at a time. Assuming that the branches disconnected from each fundamental loop are respectively
Algorithm 2.Loop Breaking.
Input: Loop data of the network
Output: Potential open branches sap
n=1
For k1 from 1 to Nl1
For k2 from 1 to Nl2
…
For kNL from 1 to NlNL
n=n+1
End for
…
End for
End for
Output sap={s1, s2, …, sNs}
2.3 Loop backtracking
The potential topological sets obtained through loop breaking may still contain islands that need to be further eliminated using loop backtracking, as given in Algorithm 3. Assuming sap*represents the final feasible topology, start by initializing s*to be equal to sap. Then, iterate through each element sn in sap*. If sn contains more than two elements from Cij, it inevitably indicates the presence of islands, so sn needs to be removed from sap* (Condition 1). Additionally, if sn contains elements from Cij, Cik, and Cjk simultaneously, and the fundamental loops Li, Lj and Lk share nodes, their shared nodes will become islands as well, and sn should also be removed from sap* (Condition 2). After backtracking and eliminating infeasible topologies, sap* represents the final set of feasible topologies obtained.
To illustrate the undirected-graph delooping-backtracking method proposed in this paper, a simple 5-node example system is considered. First, the fundamental loops and the shared branch sets between loops are determined, as shown in Figure 2. The network contains a total of 3 fundamental loops and 3 shared branch sets between loops, of which details are given in Table 1.
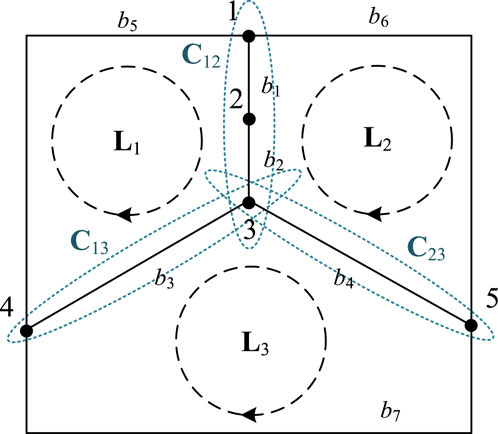
FIGURE 2. 5 Node example system.
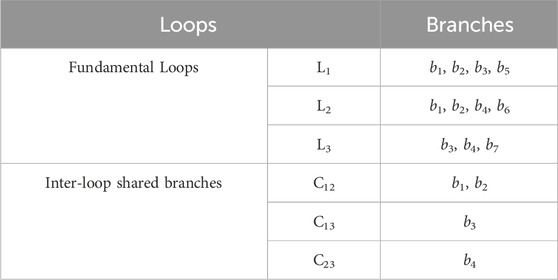
TABLE 1. The fundamental loops and shared branch sets for the 5-node system.
Algorithm 3.Loop Backtrack.
Input: Potential open branches sap, Loop data of the network
Output: Reduced potential open branches sap*
Initialize sap*=sap
For n from 1 to Ns
For i from 1 to NL
For j from i+1 to NL
If sn satisfies Condition 1
Delete sn from sap*
End if
For k from j+1 to NL
If sn satisfies Condition 2
Delete sn from sap*
End if
End for
End for
End for
End for
Output sap*
Condition 1: sn contain more than one elements of Cij.
Condition 2: sn contain element in Cij, Cik and Cjk and Li Lj and Lk share common nodes.
By breaking loops in the network as shown in Figure 2, all potential topological sets, denoted as sap, can be obtain. Through loop backtracking, the final feasible topological set can be established, and denoted as sap*. During the loop backtracking process, an example of feasible topology (that satisfy neither Condition 1 nor Condition 2) is illustrated in Figure 3A. Infeasible topologies satisfying Condition 1 are depicted in Figure 3B, and those satisfying Condition 2 are shown in Figure 3C. From Figure 3B, it is apparent that due to the simultaneous disconnection of two branches in the shared branch set C12, Node 2 becomes an island, rendering the topology infeasible. From Figure 3C, it can be seen that the simultaneous disconnection of branches in the shared branch sets C12, C13, and C23 results in Node 3, a common node among L1, L2, and L3, becoming an island, making the topology infeasible. However, topologies that exclude both Condition 1 and Condition 2 can satisfy radiation constraints and prevent islands from forming.
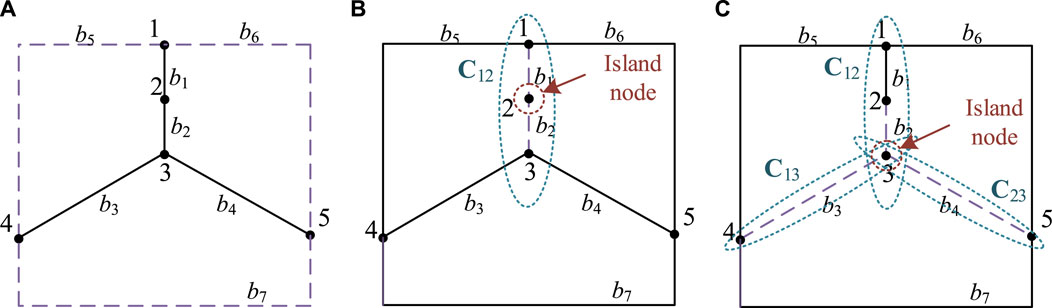
FIGURE 3. The three possible scenarios of feasible topologies obtained by loop breaking. (A) Feasible topology that satisfy neither Condition 1 nor Condition 2. (B) Infeasible topologies satisfying Condition 1. (C) Infeasible topologies satisfying Condition 2.
3 Data-driven power flow calculation model incorporating topological changes
This section develops the entire data-driven power flow calculation model based on the feasible topological set sap* established in the previous section.
3.1 The establishment of the overall model
A typical power flow calculation problem involves computing the voltage magnitudes and phase angles at various nodes under the condition of known injected power at each node. Assuming the set of active power injections at each node is denoted as P={P1, P2, …, PN}, the set of reactive power injections as Q = {Q1, Q2, …, QN}, the topological vector as S, the set of voltage magnitudes as U = {U1, U2, …, UN}, and the set of voltage phase angles as δ = {δ1, δ2, …, δN} (where N is the number of nodes in the network), the inputs and outputs of the data-driven power flow calculation model can be defined as Eqs (1) and (2):
where I represents the set of input vectors for the data-driven model, O represents the set of output vectors for the data-driven model.
Unlike the potential loop-breaking strategy sn, the topological vector S records the switch states of each branch using a 0–1 representation, providing a more accurate reflection of the impact of branch switch states on power flow. Since the dimensions of the sets P, Q, U, and δ are all N, while the dimension of S is NB, the dimensions of the input vectors I and output vectors O are 2N + NB and 2N, respectively.
Based upon the definition of input and output variables, the entire data-driven power flow calculation model is further constructed using Deep Belief Networks (DBN) (Zhang et al., 2018). DBN, as a form of deep learning, consists of multiple layers of Restricted Boltzmann Machines (RBM) (Zhang et al., 2018; Tao et al., 2020; Wang et al., 2022). In this network architecture, there are connections between layers, but units within each layer are not interconnected. After training the neural network parameters layer by layer, DBNs are effective in fitting a large number of data samples, enabling estimation and prediction tasks (Wang et al., 2022).
The data-driven power flow calculation model based on DBN is shown in Figure 4. It can be seen that the input variables (I) pass through the Input Layer, hidden layers, and output layer to ultimately yield the required power flow calculation results (O).
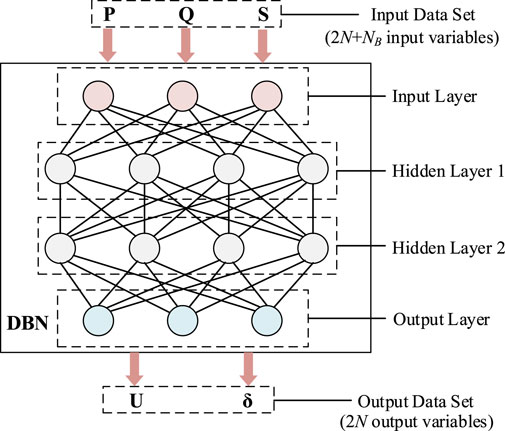
FIGURE 4. DBN-based data-driven power flow calculation model.
3.2 The training of the model
The data-driven power flow calculation model depicted in Figure 4 requires training before it can conduct rapid power flow calculations. Training samples play a crucial role in the accuracy of the power flow calculation model. In practical applications, training samples for the data-driven power flow calculation model can be sourced from actual measurements of power and voltage data in the electrical grid. However, on one hand, measured data samples are limited in quantity and may lack diversity, making it challenging to cover fewer common scenarios. On the other hand, from a model validation perspective, it is not easy to design a comprehensive validation method to verify the effectiveness of the model for various scenarios. In this paper, Monte Carlo simulations are employed to generate training samples.
Assuming that the rated active and reactive powers of the nodes in the network are represented as Pr = {Pr,1, Pr,2, …,Pr,N} and Qr = {Qr,1, Qr,2, …, Qr,N}, respectively, the active and reactive power values for the kth node in the ith training sample can be obtained by adding noise to Pr,k and Qr,k as follows:
where εP,k and εQ,k represent the noise added to the active and reactive powers, respectively, and they follow a normal distribution:
where σP,k and σQ,k are the standard deviations of the noise. Through Eqs 3, 4, the sets of active and reactive powers for the ith training sample can be obtained as Ptrain,i = {Ptrain,i,1, Ptrain,i,2, …, Ptrain,i,N} and Qtrain,i = {Qtrain,i,1, Qtrain,i,2, …, Qtrain,i,N}.
Topology set Strain,i is obtained by sampling from the feasible topological set sap* and can be represented by the formula:
Thus, the input variables for the ith training sample can be obtained as follows:
Using Itrain,i and the network’s own parameters, traditional power flow calculations can be performed. In this case, the Newton-Raphson method is adopted to calculate the power flow for Itrain,i, resulting in: Utrain,i = {Utrain,i,1, Utrain,i,2, …, Utrain,i,N}, δtrain,i = {δtrain,i,1, δtrain,i,2, …, δtrain,i,N}, which can be served as the output variables for the ith training sample in the data-driven power flow calculation model:
By repeatedly perform Formulas 3ormulas –Formulas 9, a large number of training samples can be generated. Eventually, a training sample set can be obtained as: Itrain = {Itrain,1, Itrain,2, …, Itrain,Ntr}, Otrain = {Otrain,1, Otrain,2, …, Otrain,Ntr}. Where Ntr is the number of training samples.
Using these training samples, the DBN can be trained, ultimately creating a data-driven power flow calculation model that takes into account topological changes and can rapidly compute power flow results.
4 Case study
The case study involves an IEEE 33-node distribution network system, as shown in Figure 5. This system comprises 33 nodes, 37 normally closed branches, and 10 branches equipped with controllable switches, denoted as b4, b7, b18, b23, b27, b33, b34, b35, b36, b37. The controllable branches allow for changes in the network topology while ensuring that the entire distribution network adheres to radiation constraints.
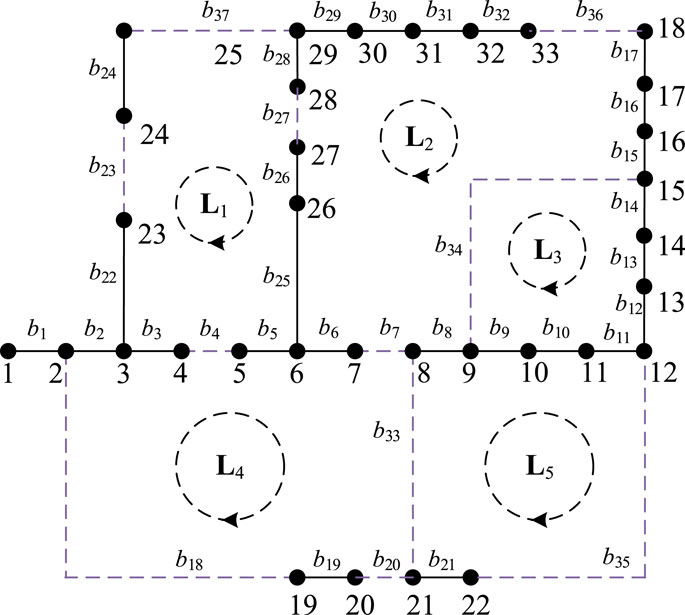
FIGURE 5. IEEE 33-node system.
4.1 Topology sample set generation
From Figure 5, it can be observed that the IEEE 33-node system consists of a total of 5 fundamental loops. Since normally closed branches do not affect the network topology, only the branches equipped with controllable switches are listed in the loop data initialization. The results of loop data initialization are as shown in Table 2. Performing loop-breaking operations on the loop data yields a set of potential topologies, denoted as sap, which contains a total of 1024 potential topologies. Based on this set, loop backtracking operations are conducted to obtain the feasible topology set, denoted as sap*, which includes a total of 63 feasible topologies.

TABLE 2. The basic loops and shared branches in the IEEE 33-node system (only listing branches equipped with controllable switches).
4.2 The power-flow calculation in the IEEE 33-node system with topology changes
The case study involves the validation of the data-driven power flow calculation method proposed in this paper for four different topological scenarios, as shown in the left column of Figure 6. To facilitate comparative analysis, the case study considers the following four methods:
1) Regression Method

FIGURE 6. The results of power flow calculations using various methods in multiple topology scenarios.
Without considering the network’s topology, a linear regression model is employed to establish the relationship between active power, reactive power, voltage magnitude, and phase angles.
2) Traditional DRB Method
Without considering the network’s topology, a Deep Belief Network (DBN) is used to establish the relationship between active power, reactive power, voltage magnitude, and phase angles.
3) Topology-based Regression Method
Considering the network’s topology, a linear regression model is employed to establish the relationship between active power, reactive power, voltage magnitude, and phase angles while accounting for the network’s topology.
4) Topology-based DRB Method (The proposed method)
The feasible topological sample set is generated using the undirected-graph delooping-backtracking method, and the DBN is used to establish the relationships between active power, reactive power, voltage magnitude, and phase angles while considering the network’s topology. Due to the IEEE 33-node system comprising a total of 33 nodes and 10 controllable switches, according to the model described in Section 3.1, the dimensions of the input and output layers for the DBN are 76 and 66, respectively. In addition to the input and output layers, the DBN includes two hidden layers, each containing 500 neurons and the activation function chosen is the sigmoid function.
The comparison between the node voltages obtained from the four data-driven power flow calculation methods and the actual node voltages is shown in the right column of Figure 6. It can be seen that the Regression Method and the Traditional DRB Method do not consider the impact of topology changes on power flow, resulting in significant errors in the power flow calculation results. Topology-based Regression Method takes topology into account in its input variables, leading to a noticeable reduction in node voltage errors compared to the regression method. However, due to limitations in fitting nonlinear power equations, errors are still non-negligible. The Topology-based DRB Method (The proposed method), which combines variable topology and deep learning, output node voltage calculation results that are very close to the actual node voltages.
To further numerically compare the effectiveness of different data-driven power flow calculation methods, the Mean Absolute Error (MAE) is used to calculate the errors. The formula for calculating MAE is as Eq. (10):
The bar chart in Figure 7 and the statistical results in Table 3 depict the MAE for power flow calculation results using different methods across various topological scenarios. It is evident from Figure 7 and Table 3 that the MAE for node voltages obtained using the Topology-Based DRB Method (the proposed method) is significantly lower than that of the other three methods. This demonstrates that the proposed data-driven power flow calculation method proposed offers higher precision and is more suitable for scenarios involving network topology changes.
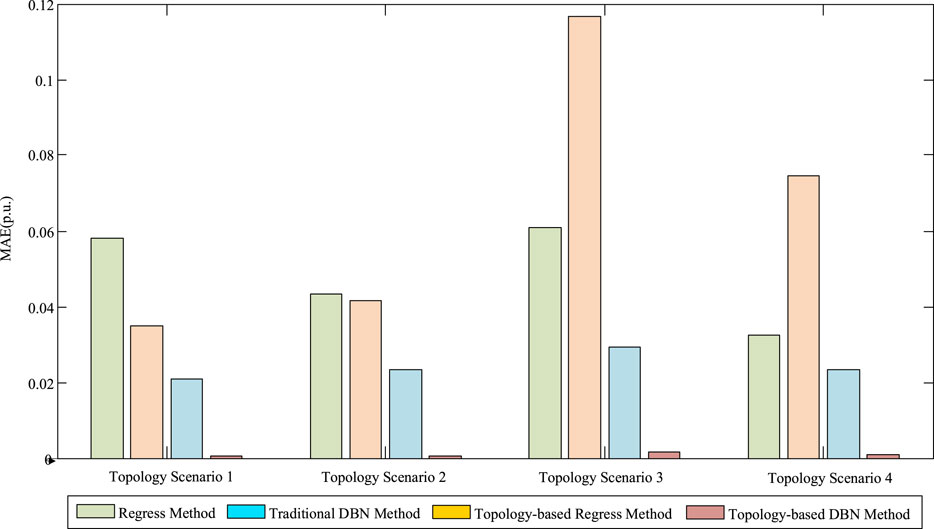
FIGURE 7. MAE statistical results of different methods in multiple topology scenarios.
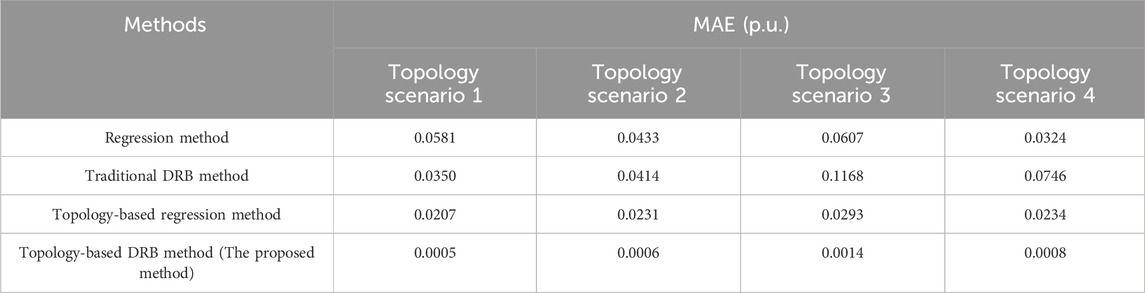
TABLE 3. MAE statistics table with different methods.
5 Conclusion
This paper introduces a data-driven power flow calculation method based on undirected-graph delooping-backtracking. It utilizes the undirected-graph delooping-backtracking technique to generate a feasible set of topological samples based on the initialization of loop data. Furthermore, it establishes a data-driven power flow calculation model based on Deep Belief Networks (DBN). This approach enables accurate power flow calculations even in scenarios with changing network topologies. From the analysis results of the test case, we draw the following conclusions:
1) Through operations such as loop data initialization, loop-breaking, and loop backtracking, it is possible to effectively eliminate infeasible topologies and obtain feasible topologies on the basis of generating all potential topologies for the distribution network. For the 33-node testing system, by screening out infeasible topologies, the number of potential topologies is reduced from 1024 to 63, significantly reducing the computational complexity for training the data-driven power calculation model.
2) By incorporating topology information into the DBN-based numerical-driven power flow calculation model, it becomes possible to consider changes in the topology during the power flow calculation process. This allows the data-driven power flow calculation model to have an advantage over models that do not take topology information into account. Moreover, due to its excellent ability to learn complex features and handle large amounts of training data, the DBN achieves more accurate power flow calculation results compared to traditional neural networks.
The future work will focus on applying the proposed data-driven power flow calculation method to various aspects of power grid operations, including economic dispatch, topology optimization, and operational control, etc.
Data availability statement
The original contributions presented in the study are included in the article/Supplementary material, further inquiries can be directed to the corresponding author.
Author contributions
HZ: Conceptualization, Investigation, Project administration, Supervision, Writing–review and editing. ZH: Investigation, Methodology, and Writing–Original Draft. ZL: Formal Analysis, Resources, Software, Writing–review and editing. YW: Resources, Validation, Visualization, Writing–review and editing.
Funding
The author(s) declare financial support was received for the research, authorship, and/or publication of this article. The paper is in part supported by the National Key Research and Development Program “Graph Computing Analysis and Optimization Software for Ultra-Large-Scale Power Grid Equipment Nodes,” under Project 5, titled “Integrated Research and Development of Power Grid Graph Computing System and Application Verification” (Project Number: 2022YFB2404205), and by the Science and Technology Project of State Grid Jiangsu Electric Power Company (Project No. J2023066).
Conflict of interest
Authors HZ, ZH, ZL, and YW were employed by Nanjing Power Supply Company, State Grid Jiangsu Electric Power Co., Ltd.
Publisher’s note
All claims expressed in this article are solely those of the authors and do not necessarily represent those of their affiliated organizations, or those of the publisher, the editors and the reviewers. Any product that may be evaluated in this article, or claim that may be made by its manufacturer, is not guaranteed or endorsed by the publisher.
References
Chen, J., Li, W., Wu, W., Zhu, T., Wang, Z., and Zhao, C. (2020). “Robust data-driven linearization for distribution three-phase power flow,” in 2020 IEEE 4th Conference on Energy Internet and Energy System Integration (EI2), Wuhan, China, 30 October 2020 - 01 November 2020, 1527–1532. doi:10.1109/EI250167.2020.9347375
Chen, J., Wu, W., and Roald, L. (2022). Data-Driven piecewise linearization for distribution Three-Phase stochastic power flow. IEEE Trans. Smart Grid 13 (2), 1035–1048. doi:10.1109/tsg.2021.3137863
Chen, Y., Wu, C., and Qi, J. (2022). Data-driven power flow method based on exact linear regression equations. J. Mod. Power Syst. Clean Energy 10 (3), 800–804. doi:10.35833/mpce.2020.000738
Crozier, C., and Baker, K. (2022). “Data-driven probabilistic constraint elimination for accelerated optimal power flow,” in 2022 IEEE Power &Amp; Energy Society General Meeting (PESGM), Denver, CO, USA, 17-21 July 2022, 1–5. doi:10.1109/pesgm48719.2022.9916838
Cui, X., Ma, K., Meng, X., Zhang, X., Duan, F., Li, T., et al. (2020). “A Data-Driven Slow Dynamic characteristic extraction and state estimation method for large power grid,” in 2020 IEEE 3rd Student Conference on Electrical Machines and Systems (SCEMS), Jinan, China, 04-06 December 2020, 39–42. doi:10.1109/scems48876.2020.9352371
Guo, L., Zhang, Y., Li, X., Wang, Z., Liu, Y., Bai, L., et al. (2022). Data-driven power flow calculation method: a lifting dimension linear regression approach. IEEE Trans. Power Syst. 37 (3), 1798–1808. doi:10.1109/tpwrs.2021.3112461
Li, P., Wu, W., Wang, X., and Xu, B. (2023). A Data-Driven linear optimal power flow model for distribution networks. IEEE Trans. Power Syst. 38 (1), 956–959. doi:10.1109/tpwrs.2022.3216161
Liu, Y., Li, Z., and Zhao, J. (2022b). Robust data-driven linear power flow model with probability constrained worst-case errors. IEEE Trans. Power Syst. 37 (5), 4113–4116. doi:10.1109/tpwrs.2022.3189543
Liu, Y., Li, Z., and Zhou, Y. (2022a). Data-Driven-Aided linear Three-Phase power flow model for distribution power systems. IEEE Trans. Power Syst. 37 (4), 2783–2795. doi:10.1109/tpwrs.2021.3130301
Liu, Y., Zhang, N., Wang, Y., Yang, J., and Kang, C. (2019). Data-driven power flow linearization: a regression approach. IEEE Trans. Smart Grid 10 (3), 2569–2580. doi:10.1109/tsg.2018.2805169
Shao, Z., Zhai, Q., and Guan, X. (2023). Physical-model-aided data-driven linear power flow model: an approach to address missing training data. IEEE Trans. Power Syst. 38 (3), 2970–2973. doi:10.1109/tpwrs.2023.3256120
Tan, Y., Chen, Y., Li, Y., and Cao, Y. (2020). Linearizing power flow model: a hybrid physical model-driven and data-driven approach. IEEE Trans. Power Syst. 35 (3), 2475–2478. doi:10.1109/tpwrs.2020.2975455
Tao, C., Wang, X., Gao, F., and Wang, M. (2020). Fault diagnosis of photovoltaic array based on deep belief network optimized by genetic algorithm. Chin. J. Electr. Eng. 6, 106–114. doi:10.23919/cjee.2020.000024
Wang, G., Qiao, J., Liu, C., and Shen, Z. (2022). How deep is deep enough for deep belief network for approximating model predictive control law. IEEE Trans. Automation Sci. Eng. 19, 2067–2078. doi:10.1109/tase.2021.3074984
Wang, J., Wang, C., Liang, Y., Bi, T., Shafie-khah, M., and Catalao, J. P. S. (2021). Data-driven chance-constrained optimal gas-power flow calculation: a bayesian nonparametric approach. IEEE Trans. Power Syst. 36 (5), 4683–4698. doi:10.1109/tpwrs.2021.3065465
Xing, Z., Gong, J., Lao, K. W., and Dai, N. (2021). “Single bus data-driven power estimation based on modified linear power flow model,” in 2021 6th International Conference on Power and Renewable Energy (ICPRE), Shanghai, China, 17-20 September 2021, 755–758. doi:10.1109/ICPRE52634.2021.9635174
Xing, Z., Lao, K. W., Gao, H., and Dai, N. (2022). “A modified data-driven power flow model for power estimation with incomplete bus data,” in 2022 12th International Conference on Power, Energy and Electrical Engineering (CPEEE), Shiga, Japan, 25-27 February 2022, 316–320. doi:10.1109/CPEEE54404.2022.9738684
Zhang, C., He, Y., Yuan, L., and Xiang, S. (2018). Analog Circuit Incipient Fault Diagnosis method using DBN based features extraction. IEEE Access 6, 23053–23064. doi:10.1109/access.2018.2823765
Zhang, Q., Li, X., Liu, X., Zhao, C., Shi, R., Jiao, Z., et al. (2022). “Data-driven risk assessment early-warning model for power system transmission congestions,” in 2022 12th International Conference on Power, Energy and Electrical Engineering (CPEEE), Shiga, Japan, 25-27 February 2022, 201–206. doi:10.1109/CPEEE54404.2022.9738719
Keywords: data-driven, distributed energy sources, power flow calculation, delooping-backtracking, deep neural network
Citation: Zhu H, Hu Z, Liu Z and Wang Y (2024) Research on data-driven power flow calculation method based on undirected-graph delooping-backtracking. Front. Energy Res. 12:1347834. doi: 10.3389/fenrg.2024.1347834
Received: 01 December 2023; Accepted: 15 January 2024;
Published: 04 March 2024.
Edited by:
Kaiping Qu, China University of Mining and Technology, ChinaReviewed by:
Wei Liu, Nanjing University of Science and Technology, ChinaHaixiang Zang, Hohai University, China
Copyright © 2024 Zhu, Hu, Liu and Wang. This is an open-access article distributed under the terms of the Creative Commons Attribution License (CC BY). The use, distribution or reproduction in other forums is permitted, provided the original author(s) and the copyright owner(s) are credited and that the original publication in this journal is cited, in accordance with accepted academic practice. No use, distribution or reproduction is permitted which does not comply with these terms.
*Correspondence: Zijian Hu, emlqaWFuLmh1dUBnbWFpbC5jb20=