 Yang Wu1
 Shuangquan Liu
 Zongyuan Chen
- 1Yunnan Electric Power Dispatching and Control Center, Kunming, China
- 2College of Electric Power, South China University of Technology, Guangzhou, China
As the penetration rate of renewable energy in modern power grids continues to increase, the assessment of renewable energy absorption capacity plays an increasingly important role in the planning and operation of power and energy systems. However, traditional methods for assessing renewable energy absorption capacity rely on complex mathematical modeling, resulting in low assessment efficiency. Assessment in a single scenario determined by the source-load curve is difficult because it fails to reflect the random fluctuation characteristics of the source-load, resulting in inaccurate assessment results. To address and solve the above challenges, this paper proposes a multi-scenario renewable energy absorption capacity assessment method based on an attention-enhanced time convolutional network (ATCN). First, a source-load scene set is generated based on a generative adversarial network (GAN) to accurately characterize the uncertainty on both sides of the source and load. Then, the dependence of historical time series information in multiple scenarios is fully mined using the attention mechanism and temporal convolution network (TCN). Finally, simulation and experimental verification are carried out using a provincial power grid located in southwest China. The results show that the method proposed in this article has higher evaluation accuracy and speed than the traditional model.
1 Introduction
Mitigating global warming, preventing climate damage, and achieving net-zero emissions of greenhouse gases have become a global consensus. As an important way to solve the global energy and environmental crisis, renewable energy power generation has become a hot issue of concern for countries worldwide. Many countries are vigorously developing renewable energy sources. As of the end of 2022, global renewable energy installed capacity reached 3,372 GW, accounting for 83% of newly installed capacity with a growth rate of 9.6%. The rapid development of a high proportion of renewable energy has gradually transformed the power system into a new power system dominated by renewable energy. However, the intermittency, volatility, and uncertainty of renewable energy output also pose serious challenges to power system planning and operation. On the one hand, insufficient long-distance transmission capacity and limited energy storage capacity prevent the high proportion of renewable energy from being fully absorbed by the power system, which will cause grid security problems such as overloading of transmission lines, unstable static voltage, and increased voltage deviation. In order to reduce grid security risks, renewable energy power curtailment often occurs. On the other hand, if the renewable energy accommodation capacity of the main grid is not considered, the integration of distributed renewable energy that exceeds the penetration limit will inevitably lead to insufficient peak shaving capacity of the main grid or transmission congestion, which will further aggravate the phenomenon of power abandonment in centralized renewable energy stations (Cui et al., 2022). Therefore, an accurate assessment of renewable energy absorption capacity is conducive to medium- and long-term planning of the power system and adjustments to the power system dispatch plan so as to improve the renewable energy absorption level of the new power system.
Specifically, the current research methods on renewable energy absorption capacity assessment are mainly divided into two categories: model-based methods and machine learning-based methods. The model-based method is mainly the typical day method and time series production simulation method. The typical day method only considers renewable energy absorption in typical or extreme scenarios. The calculation time is fast, but the calculation results are too conservative to accurately describe the random fluctuation characteristics on both sides of the source-load. Zhou et al. (2022) and Yan et al. (2022) put forward a renewable energy absorption capacity evaluation model and a power grid aggregation model based on time series production simulation. Taking the annual maximum capacity of renewable energy as the goal, the quantitative analysis of renewable energy absorption capacity can be realized. Su et al. (2021) adopted the method of zoning the power grid, divided the power grid according to the congestion of renewable energy transmission, and aggregated the load model, tie line model, and power supply model in each zone so as to evaluate the renewable energy consumption capacity of the entire power grid. Suo et al. (2022) proposed a time series production simulation method for multi-energy power systems, considering section constraints based on the equivalent energy function method, and the calculation results are closer to the true values of system operation. Li et al. (2019) proposed a renewable energy absorption capacity calculation model that considers the utilization level of inter-provincial tie lines, making full use of inter-provincial and inter-regional tie lines to effectively improve the level of renewable energy utilization across provinces and regions. Li et al. (2023) proposed a multi-objective probabilistic optimal power flow (MOPOPF) model, which aims to absorb renewable energy by minimizing its curtailment while supporting security and economic objectives. Ma et al. (2022) proposed a medium- and long-term optimization model considering cross-regional power trading and renewable energy absorption interval, and the penalty term of renewable energy absorption interval is added to the objective function. Yu et al. (2023) proposed a renewable energy absorption capacity assessment method that considers peak regulation and frequency response requirements. The original complex peak regulation mechanism and frequency response are equivalent to several mixed integer linear equations to reduce the computational complexity. Li et al. (2021) established a functional analysis model for wind power absorption capacity assessment, taking the singular parameters of wind power as independent variables, which effectively simplifies the calculation process of wind power absorption capacity assessment and helps dispatchers make reasonable decisions. Khalkho et al. (2022) developed a general model to represent solar radiation based on Weibull distribution and used smart grid discrete production simulation (SGDPS) to evaluate the uncertainty of solar power generation. The above model-based method carries out simulation calculations for each time period; the solution is accurate, and the calculation results are relatively reliable. However, the disadvantages are complex modeling, a large amount of calculation, and limited applicable scenarios (Li et al., 2018). The uncertainty on both sides of the source and load leads to the complexity and diversity of power system operation scenarios (Wang et al., 2023). On the source side, large-scale access to renewable energy with strong randomness makes the operation of power systems significantly uncertain.
On the load side, with the extensive access to new loads such as electric vehicles, microgrids, and energy storage, the interaction between supply and demand is becoming increasingly frequent, and the load composition is becoming increasingly complex, showing the characteristics of initiative and complexity, bringing multi-source uncertainty to the operation of the power system (Wu et al., 2020). It is difficult to truly reflect the random fluctuation characteristics of the source and load when evaluating renewable energy absorption capacity under a single scenario determined by the source-load curve. Second, the model-based method is used to evaluate a large number of renewable energy absorption scenarios, which will consume a lot of computing time.
With the rapid development of artificial intelligence technology, the renewable energy absorption capacity assessment method based on machine learning provides a new way to improve the renewable energy absorption level of new power systems. The key problem solved by machine learning is to automatically extract complex and abstract feature information from simple original features. It also has powerful nonlinear expression and model recognition capabilities. Chen et al. (2018) proposed using generative adversarial network (GAN) to learn the time-space correlation of renewable energy output and used the Wasserstein distance as a discriminator loss function to improve network training quality. Generative adversarial networks automatically learn the potential distribution patterns of data samples through an end-to-end working method, thereby generating data samples that are consistent with the distribution patterns of real samples. Therefore, it provides an effective solution for the complex modeling of uncertain scenes with source-load. The evaluation of renewable energy absorption capacity based on machine learning can be seen as constructing a nonlinear mapping relationship between key variables of grid operation and the actual power generation of renewable energy. Using the nonlinear mapping relationship learned by the machine learning model, renewable energy absorption capabilities can be quickly evaluated under different operating scenarios. Lahouar and Slama (2015) proposed a short-term prediction model based on random forest, which is mainly applied to short-term load prediction. The model shows high accuracy and effectiveness on typical days such as four seasons, weekends, and holidays. However, the use of multiple decision trees lead to a high computational complexity of random forest, which often faces the problem of overfitting when there is large noise in the data. Jia et al. (2012), Liu et al. (2014), Li et al. (2016), and Varganova et al. (2022) used principal component analysis to screen and reduce the dimensionality of multivariate time series and then proposed a renewable energy absorption capacity assessment model based on long short-term memory (LSTM), establishing the key influencing factors of renewable energy absorption and the actual absorption of renewable energy. The dynamic correlation between them can accurately assess the renewable energy absorption capacity under future scenarios (Zhang et al., 2017). However, recurrent neural networks such as LSTM need to wait for the forward pass of the previous time step to complete before proceeding to the forward pass of the next time step, which has the problem of slow training. The gradient backpropagation process will accumulate along the time dimension, and there is a gradient diffusion problem (Chen et al., 2017). Second, due to the lack of convolution, the feature extraction capability of LSTM and other recurrent neural networks for long time series needs to be improved. At the same time, it is difficult to give more attention to the key feature information that affects the prediction results. In recent years, the time convolutional network (TCN) model has been widely used in power grid business scenarios such as load forecasting (Wang et al., 2020), renewable energy forecasting (Zhang et al., 2023), and transient voltage stability assessment (Chen and Xie, 2022), but it is relatively rarely used in the task of renewable energy absorption capability assessment. Because of the integration of parallel feature processing in the CNN and time domain modeling capability of RNN, TCN has advantages in extracting long-term time series features (Song et al., 2020).
In view of the above research status, we propose a multi-scenario renewable energy absorption capacity evaluation method based on an attention-enhanced time convolutional network (ATCN). The main contributions of our work are threefold, as discussed below.
(1) Generative adversarial networks are used to generate source-load scenario sets for multi-scenario renewable energy absorption capacity assessment, which avoids the problem that a single scenario assessment cannot truly reflect various uncertain factors in actual operation.
(2) The long-term dependence of renewable energy absorption historical data is more efficiently captured through the temporal convolution network and attention mechanism, and the overall evaluation accuracy of the model is improved.
(3) The temporal convolutional network does not use cyclic connections and can input time series data in parallel so that it can achieve faster model training speed and has more advantages in long-term series training.
The remainder of this paper is organized as follows: Section 2 introduces the mechanism model of renewable energy absorption capacity. Section 3 introduces the scenario generation method for renewable energy absorption capacity assessment. Section 4 introduces the attention-enhanced time convolutional network. In Section 5, a comprehensive numerical study is performed, and the superiority of the proposed method is demonstrated. Finally, a conclusion is drawn in Section 6.
2 Mechanism model of renewable energy absorption capacity
Renewable energy absorption capacity is affected by the following factors: power supply structure of the power grid, grid topology, load demand, delivery market, and system peak shaving. The mechanism model of renewable energy absorption capacity is shown in Figure 1. The difference between load and external power and the minimum technical output of conventional units is the theoretical maximum absorption capacity of renewable energy. When the output of renewable energy is less than the maximum absorption capacity of renewable energy, the renewable energy power generation can be fully absorbed. When the output of renewable energy is greater than the maximum absorption capacity of renewable energy, the excess power cannot be absorbed by the system, resulting in the phenomenon of renewable energy abandonment.
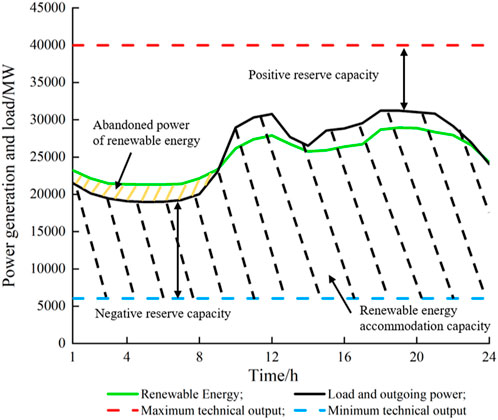
FIGURE 1. Schematic diagram of renewable energy absorption capacity.
From Figure 1, we can intuitively analyze the main factors that affect the absorption capacity of renewable energy, including electricity load, external power, system backup, the minimum technical output of conventional units, and the output level of renewable energy. In order to explore the complex temporal dependencies between renewable energy absorption capacity and its main influencing factors, a data-driven approach can be used to learn historical renewable energy absorption data.
The overall framework of the multi-scenario renewable energy absorption capacity evaluation model is shown in Figure 2. According to the input historical load data and historical renewable energy data, the scene is generated using the Wasserstein generative adversarial network–gradient penalty (WGAN-GP) algorithm, and the scene is reduced using the K-medoids algorithm so that the wind power, photovoltaic, and load scenes that conform to the real distribution of historical data are obtained, respectively. The generated source-load scene set is divided into datasets, and the attention-enhancing time convolution network is trained based on massive historical data from multiple scenes. The trained multi-scenario renewable energy absorption capacity evaluation model can quickly and accurately output the evaluation results of renewable energy absorption capacity in a given scenario.

FIGURE 2. Schematic diagram of the multi-scenario renewable energy absorption capacity evaluation model.
3 Renewable energy absorption capacity assessment scenario generation
A generative adversarial network is an adversarial learning framework. Its core idea comes from the two-person zero-sum game in game theory. It consists of a generator and a discriminator, as shown in Figure 3. The entire game process requires the generator and discriminator to find the Nash equilibrium between the two through continuous learning and optimization, thereby learning the potential distribution of real data to simulate and generate complex laws that are difficult to describe in the real world. It is suitable for the description of source-load uncertainty scenarios. Compared with traditional probabilistic modeling methods, the scene generation method based on generative adversarial networks does not rely on statistical assumptions about the data, avoids the process of scene sampling, and can accurately capture the true distribution of historical data.
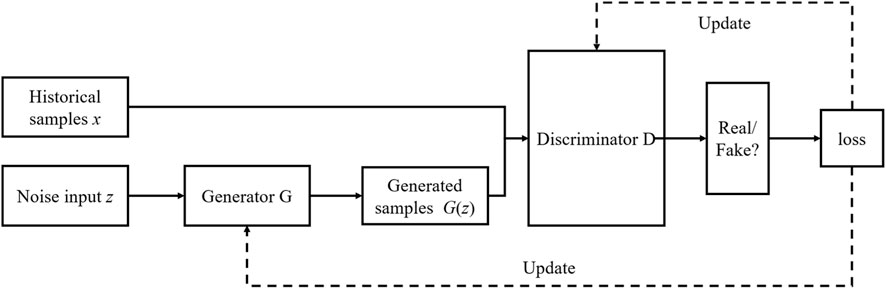
FIGURE 3. Structural diagram of the generative adversarial network.
The input of the generator is a set of random noise data z to represent the probability distribution of
where
Based on the original generative adversarial network, WGAN-GP adopts the observable Wasserstein distance as the training target of the model and introduces the gradient penalty term, which is conducive to measuring the distribution difference of different data and can effectively solve problems such as gradient explosion, training instability, and convergence difficulties in the training process of the traditional generative adversarial network.
Wasserstein distance is defined as
where
The gradient penalty term is defined as
where λ represents the penalty coefficient,
The objective function of WGAN-GP training is defined as follows:
After the scene generation based on WGAN-GP, it is necessary to reduce the massive scenes using the K-medoids algorithm to get the typical source-load scene set (Yu et al., 2018). Compared with the traditional K-means clustering algorithm, the K-medoids algorithm chooses the object closest to the cluster mean as the cluster center, which reduces the influence of abnormal data on the clustering effect and is more robust to noise and outliers. Therefore, using the K-medoids algorithm, we select the source-load scene with obvious characteristics and high probability from the original source-load scene. The K-medoids algorithm is mainly divided into three steps. First, the number of clustering centers in the k-medoids algorithm is preset, and the optimized clustering center is obtained in the clustering process. Then, according to the principle of being closest to the cluster center, the remaining points are assigned to the class represented by the current best cluster center. Finally, when all the clustering centers no longer change, it means that the scene reduction is completed.
4 Attention-enhanced time convolutional network
4.1 Attention mechanism
In reality, time series information usually contains a lot of redundant information. If the redundant information is treated as important information, it will interfere with the performance of the model to extract information. The introduction of the attention mechanism in the first layer of each residual module of the TCN is helpful to improve the model’s focus on key information in data features and reduce the risk of overfitting.
In essence, the attention mechanism is a method of weight allocation of input features. By calculating the weight coefficient of input features on output results, features with a high weight coefficient are given more attention so as to highlight the influence of key features and improve the accuracy of the prediction model. For an input sequence
where
By multiplying and summing the hidden layer state of the history node of the input sequence, the feature vector is obtained, which is expressed as follows:
where
The state value of the last node is output, which is expressed as follows:
where
4.2 Temporal convolutional network
A TCN is a neural network model that integrates dilated causal convolution (DCC) and residual connection (RC). Its network architecture is shown in Figure 4, which is stacked by an input layer, multiple residual blocks, and an output layer.
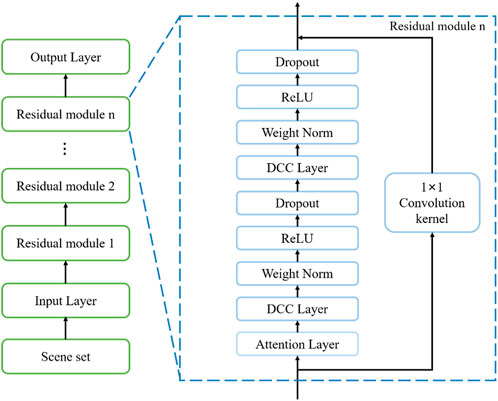
FIGURE 4. Structural diagram of the temporal convolutional network.
4.2.1 Dilated causal convolution
Causal convolution can effectively avoid future information leakage problems caused by convolution operations in traditional convolutional neural networks, but it is difficult to capture the characteristics of long-term historical information. On the basis of causal convolution, dilated causal convolution can obtain a larger receptive field by increasing the convolution kernel size K and expansion coefficient d. It is more suitable for processing historical data with a long time span and a large amount of data. The structure of dilated causal convolution is shown in Figure 5.
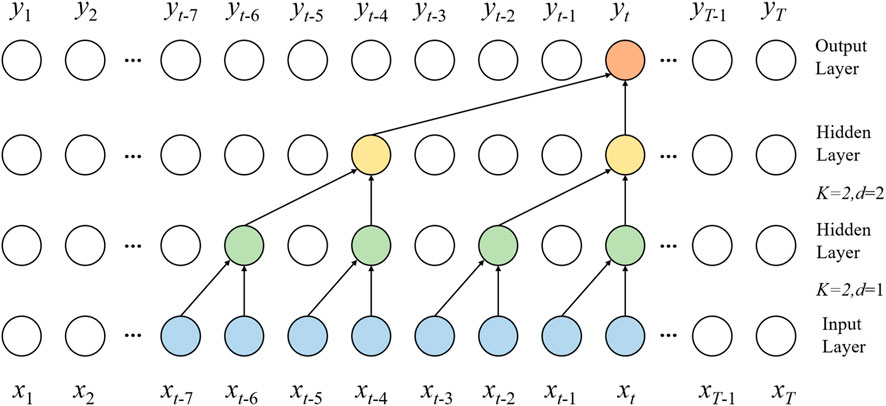
FIGURE 5. Structural diagram of dilated causal convolution.
Multi-layer stacking combined with dilated causal convolutions can enable deep learning networks to achieve very large receptive fields with fewer network layers. In addition, since each layer of the network uses filters of the same size, it is conducive to parallel computing processing and improving computing efficiency. Therefore, in view of the characteristics of historical renewable energy absorption data with a large data scale and a long time span, dilated causal convolution and residual modules are used to construct a TCN to capture the long-term dependence between renewable energy absorption capacity and its main influencing factors in parallel. It can effectively improve the efficiency of model evaluation. The expression of dilated causal convolution is
where d represents the expansion coefficient, K represents the size of the convolution kernel,
4.2.2 Residual module
With the increase in the depth of the TCN, its ability to mine complex correlation features between time series information is enhanced, but it also brings about gradient explosion, gradient disappearance, and other problems. In order to solve the degradation problem of deep learning networks, the residual module is introduced for error correction, which is defined as follows:
where
Each residual module is composed of two nonlinear, dilated causal convolution layers. After each dilated causal convolution layer, a batch standardization layer is added so that the input of each layer network can be normalized. After the standardization layer, the ReLU activation function is used to improve the model’s ability to fit nonlinear data, and Dropout is introduced to mitigate the risk of overfitting the model.
5 Numerical study
5.1 Experiment data description
In order to verify the feasibility and superiority of the proposed attention-enhanced time convolutional network in renewable energy absorption assessment, this paper carries out a case simulation and analysis using the real SCADA data of a provincial power grid in southwest China. The complete dataset contains historical data on the province’s renewable energy absorption from 2018 to 2022, and the data sampling frequency is every 15 min. Daily data with renewable energy power missing values or outliers were screened and eliminated, resulting in a total of 143,191 valid datasets. The example dataset is divided into a training set, verification set, and test set in the ratio of 6:2:2. The zero-mean normalization method is adopted for data standardization preprocessing, and its conversion function is as follows:
where
5.2 Evaluation indicators
In order to verify the accuracy of the proposed method to evaluate the renewable energy absorption capacity, this paper uses the mean absolute percentage error
where
5.3 Model parameter setting
The proposed ATCN model is verified on a PC platform featuring an Intel Core i7-11700F 2.5 GHz CPU, 16 GB RAM, and GTX 1660 SUPER GPU, and the operation environment is Torch 1.8.0 based on Python. The ATCN model parameters are shown in Table 1.
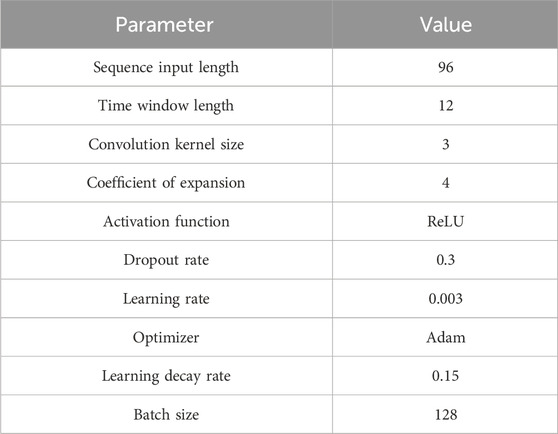
TABLE 1. ATCN model parameter.
5.4 Experimental results and analysis
5.4.1 Scene generation results
Using historical load data and historical renewable energy data, the scene is generated through the use WGAN-GP and reduced using the K-medoids algorithm. The source-load scene generation based on WGAN-GP has been carried out for 250 iterations. With the continuous updating of the data, the Wasserstein distance decreases and finally fluctuates at approximately 0.03, as shown in Figure 6. WGAN-GP uses the Wasserstein distance as the loss function, and there is always gradient guidance, which can ensure that the generated distribution is close to the real data distribution. By increasing the gradient penalty term, the gradient distribution is more uniform, and the training process is more stable.

FIGURE 6. Change in the Wasserstein distance.
The load, wind power, and photovoltaic scenarios conforming to the true distribution of historical data are obtained, respectively, as shown in Figure 7.
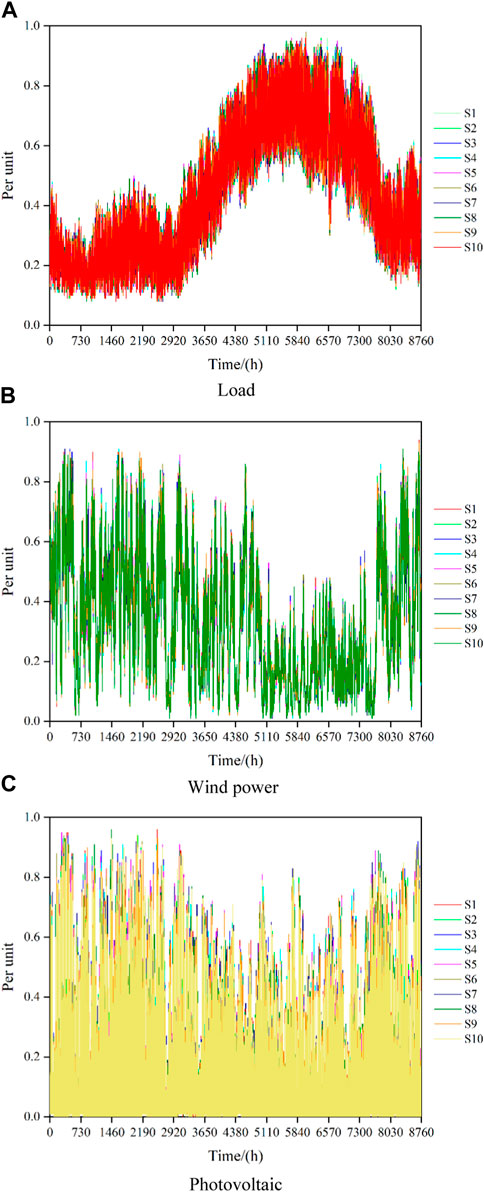
FIGURE 7. Scene generation results: (A) Load; (B) Wind power; (C) Photovoltaic.
The probability of each typical scenario in the source-load scenario set is shown in Table 2. The generated source-load scenario set can effectively describe the random fluctuation characteristics on both sides of the source and load, provide scenario support for the evaluation of renewable energy absorption capacity, and reflect the influence of various uncertain factors on renewable energy absorption in the actual operation of power systems. The time convolution network of the multi-scenario renewable energy absorption capacity evaluation model has the characteristics of a parallel input of time series data. In the training process of the renewable energy absorption capacity evaluation model, the long-term dependence between renewable energy absorption capacity and its main influencing factors can be captured in parallel by inputting each typical scenario in the source-load scenario set. Finally, the output results are weighted and summed according to the probability of typical scenarios, which realizes an accurate capture of the uncertain characteristics on both sides of the source and load considering multiple scenarios.
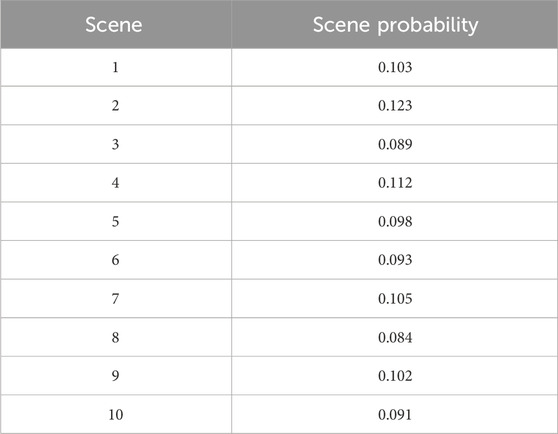
TABLE 2. Results of scene reduction.
5.4.2 Comparison of evaluation indexes in different seasons
In order to verify the superiority of the proposed evaluation method of renewable energy absorption capacity, this paper selects the typical daily method and time series production simulation based on the model, the long short-term memory neural network, and the random forest based on machine learning as the benchmark prediction methods. The accuracy of renewable energy consumption capacity evaluation is compared and analyzed between the ATCN model and the above methods. Table 3 gives the average performance evaluation index results of different methods in all scenarios in four seasons in detail. From the comparative analysis in Table 3, it can be seen that the ATCN model has achieved the best evaluation accuracy in three evaluation indexes: MAPE, RMSE, and R2. That is, compared with all benchmark evaluation methods, the ATCN model has different degrees of accuracy improvement in three different performance evaluation indexes. Compared with the model-based time series production simulation, the proposed method in this paper has a decrease of 3.11% in MAPE, a relative decrease of 51.58% in RMSE, and an increase of 0.59% in R2. Compared with the long short-term memory neural network based on machine learning, the proposed method in this paper has a decrease of 6.12% in MAPE, a relative decrease of 54.80% in RMSE, and an increase of 0.71% in R2. The typical day method only considers the operation of the system in typical or extreme scenarios and cannot accurately characterize the time series fluctuation characteristics on both sides of the source and load of the system. The time series production simulation method relies on complex mathematical modeling and time series deduction and simplifies the model in the modeling process. Therefore, it is difficult to understand the real operation of the system. The LSTM method cannot extract the feature information of different time scales by stacking multiple convolution layers, and it is difficult to effectively capture the local dependencies in sequence data. The random forest method will have overfitting problems when modeling datasets with specific noise, and it is difficult to make predictions beyond the data range of the training set, so it will not perform well when the scene changes greatly. The attention mechanism and time convolution network of the ATCN model can extract features of different scales from the historical data of massive renewable energy absorption in different scenarios by stacking convolution layers and increasing the receptive field of the convolution kernel, effectively capture the long-term dependence between sequence data, and fully explore the implicit correlation between key variables of power grid operation and the actual absorption of renewable energy.
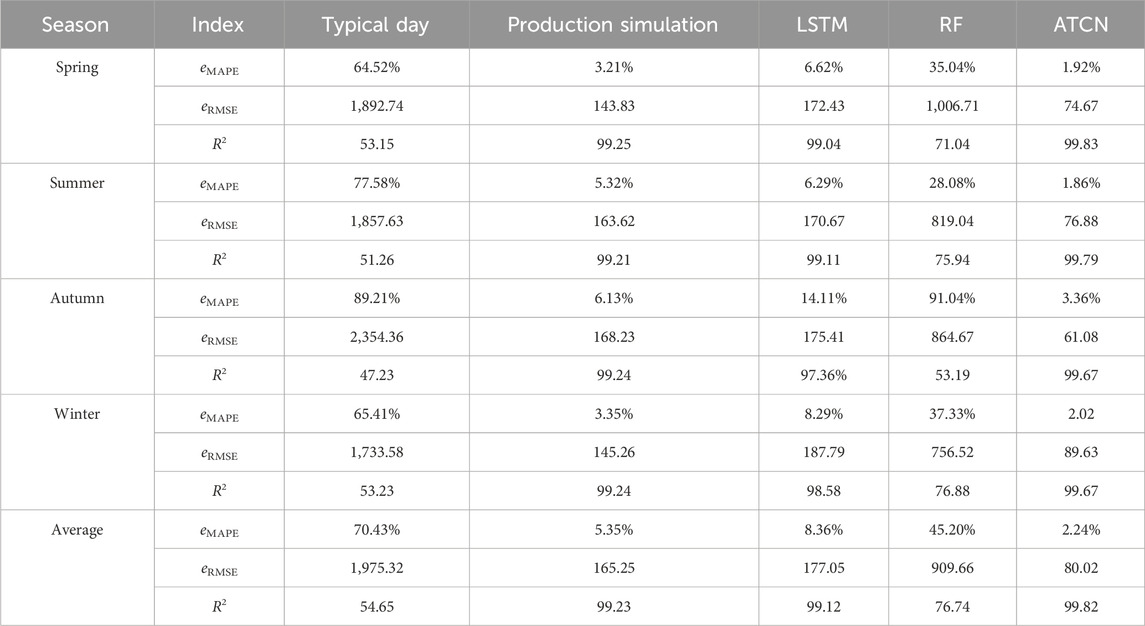
TABLE 3. Accuracy of different assessment methods.
5.4.3 Comparison of the results of 1 week selected in different seasons
In order to verify the evaluation effect of the model proposed in this paper on the absorption capacity of renewable energy in different seasons, 1 week in each of the four seasons is selected for comparative analysis. The spring period is from 21 March to 27 March 2021. The summer period is from 21 June to 27 June 2021. The autumn period is from 21 September to 27 September 2021. The winter period is from 21 December to 27 December 2021. The comparison of the evaluation results of different methods is shown in Figure 8.

FIGURE 8. Comparison of evaluation results of renewable energy absorption capacity: (A) Spring; (B) Summer; (C) Autumn; (D) Winter.
It can be seen from Figure 8 that the fluctuation range of renewable energy absorption capacity in spring is larger, while the fluctuation range of renewable energy absorption capacity in autumn is smaller. Under different seasonal conditions, the model proposed in this paper has the smallest error and the highest evaluation accuracy in evaluating renewable energy absorption capacity, showing good robustness and adaptability. This is because the ATCN model proposed in this paper can effectively learn the random fluctuation characteristics of both sides of the source and the load after training based on the source-load scenario set and achieve accurate capture of the fluctuation characteristics of renewable energy absorption capacity.
5.4.4 Comparison of the results of different hyperparameters
In order to further verify the effectiveness of the model, we consider changing the network structure hyperparameters of the model and verifying the influence of different hyperparameters on the model. Four kinds of hyperparameters that affect the evaluation accuracy of renewable energy absorption capacity are considered: sequence input length, time window length, convolution kernel size, and expansion coefficient. The experimental results are shown in Table 4. During the experiment, except for the corresponding hyperparameters, other hyperparameters remain unchanged, and the experimental results are averaged 10 times.
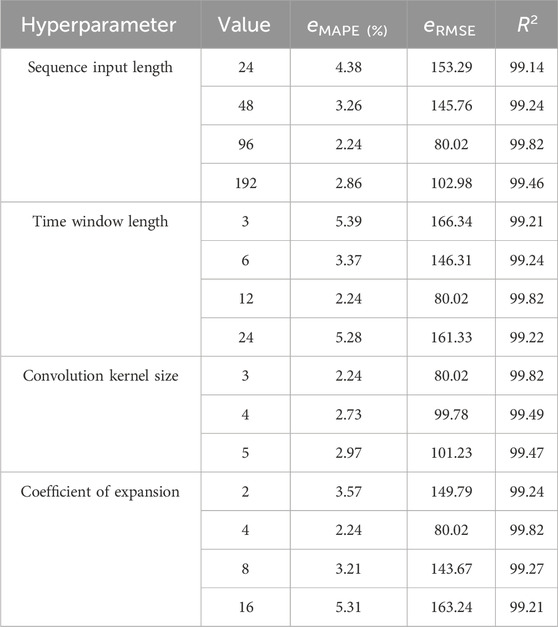
TABLE 4. ATCN hyperparametric analysis.
With the gradual increase in the sequence input length, time window length, and expansion coefficient, the accuracy of the model shows an increasing trend first and then decreasing. In a certain range, with an increase in the sequence input length or time window length, the model can make full use of more input data, and the increase in extracted features is beneficial to improving the performance of the model. However, when the length exceeds a certain range, the model cannot fully capture the long-term time dependence of time series, which leads to the gradual decline of model’s performance. In a certain range, the increase in the expansion coefficient will lead to the enlargement of the receptive field, which will help the network capture the dependence of longer time series. However, with the increase in the expansion coefficient, the number of network layers gradually deepens, and the amount and complexity of calculations increase, which makes the model more difficult to train, so the accuracy of the model decreases. The performance of the model decreases with the increase in the convolution kernel size, which is due to the loss of too much detailed information transmitted to the high-level convolution kernel when using a large-size convolution kernel. Finally, when the sequence input length is 96, the time window length is 12, the convolution kernel size is 3, and the expansion coefficient is 4, the ATCN model obtains the best evaluation effect.
5.4.5 Comparison of the calculation efficiency of different methods
Table 5 shows the comparison of the average training time and average evaluation time in the source-load scenario set between the renewable energy absorption capacity evaluation method proposed in this article and other methods.
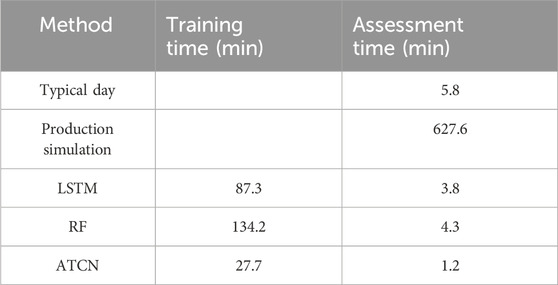
TABLE 5. Calculation time of different assessment methods.
As can be seen from the table, the method proposed in this paper avoids the complex mathematical modeling and model solving of the model-driven method and has fast solving speed and high prediction accuracy. By avoiding the use of circular connections and inputting time series data in parallel for training, the training time and evaluation time are significantly shortened. The typical day method takes the absorption of renewable energy in typical scenes as a reference and does not need complicated training. It only needs to analyze and calculate the data of typical scenes in the source-load scene set, which is fast in calculation time. The time series production simulation method needs to comprehensively consider the constraints of various types of units and large-scale power grids to realize time-by-time simulation of power grid dispatching operation conditions. Complex mechanism modeling leads to the time-consuming problem of finding the optimal solution in multiple scenarios. Because of the internal structural characteristics of LSTM, its training process is processed sequentially with the passage of time, and it is impossible to realize the parallel processing of time series data, which leads to the time-consuming training and evaluation in the source-load scene set. Because each decision tree can be trained independently, the random forest can be processed in parallel, but with the increase in the number of decision trees, its computational complexity is greatly improved, especially when facing multi-scene source and load data. Therefore, it is necessary to train multiple decision trees at the same time, which further increases the training time and evaluation time of the random forest algorithm.
6 Conclusion
In this paper, aiming at problems such as the low evaluation efficiency of the traditional renewable energy absorption capacity evaluation method and the inaccurate evaluation results caused by the evaluation in a single scene determined by the source-load curve, a multi-scenario renewable energy absorption capacity evaluation method based on an attention-enhanced time convolution network is proposed. The simulation analysis is carried out using the real renewable energy historical absorption data of a provincial power grid in southwest China. The main results are as follows:
(1) The trained generator network can fully mine the implicit association of massive historical data, generate the source-load scene set in line with the actual operation law of the system, and provide scene support for the evaluation of renewable energy absorption capacity.
(2) The attention mechanism and time convolution network help in fully mining the long-term dependence of historical time series information in multiple scenarios so as to effectively improve the evaluation accuracy of the model. In addition, the training speed of the model is effectively improved through parallel training.
(3) The ATCN model is trained based on massive historical data of multiple scenarios, which can fully learn the random fluctuation characteristics of both sides of the source-load under different scenarios and realize an accurate capture of the fluctuation characteristics of the absorption capacity of renewable energy so as to effectively improve the robustness and adaptability of the model.
It is worth noting that the training of the neural network is highly dependent on the quality of the data. The follow-up work will integrate a data-driven and knowledge-driven model and further improve the performance and interpretability of renewable energy absorption capacity evaluation by embedding prior knowledge in the model training process.
Data availability statement
The original contributions presented in the study are included in the article/Supplementary material; further inquiries can be directed to the corresponding author.
Author contributions
YW: writing–original draft and writing–review and editing. HZ: writing–original draft and writing–review and editing. CZ: writing–original draft and writing–review and editing. SL: writing–original draft and writing–review and editing. ZC: writing–original draft and writing–review and editing.
Funding
The authors declare that this study received funding from the Science and Technology Program of China Southern Power Grid Co., Ltd. (grant no. YNKJXM202222177) and the Reserve Talents Program for Middle-aged and Young Leaders of Disciplines in Science and Technology of Yunnan Province, China (grant no. 202105AC160014). The funder was not involved in the study design, collection, analysis, interpretation of data, the writing of this article, or the decision to submit it for publication.
Conflict of interest
The authors declare that the research was conducted in the absence of any commercial or financial relationships that could be construed as a potential conflict of interest.
Publisher’s note
All claims expressed in this article are solely those of the authors and do not necessarily represent those of their affiliated organizations, or those of the publisher, the editors, and the reviewers. Any product that may be evaluated in this article, or claim that may be made by its manufacturer, is not guaranteed or endorsed by the publisher.
References
Chen, L., Wang, Z., and Wang, G. (2017). Application of LSTM networks in short-term power load forecasting under the deep learning framework. Electr. Power Inf. Commun. Technol. 15 (5), 8–11.
Chen, Y., Wang, Y., Kirschen, D., and Zhang, B. (2018). Model-free renewable scenario generation using generative adversarial networks. IEEE Trans. Power Syst. 33 (3), 3265–3275. doi:10.1109/tpwrs.2018.2794541
Chen, Y. C., and Xie, H. (2022). “Transient voltage stability assessment based on an improved TCN-BiLSTM framework,” in 2022 IEEE 5th International Electrical and Energy Conference (CIEEC), Nangjing, China, 27-29 May 2022 (IEEE), 4420–4426.
Cui, L., Wang, C., Li, Y., Li, F. Q., and Guo, X. (2022). “Assessment research on accommodation capacity of renewable energy in distribution network,” in 2022 37th Youth Academic Annual Conference of Chinese Association of Automation (YAC), Beijing, China, 19-20 November 2022 (IEEE), 341–345.
Jia, W. Z., Kang, C. Q., Li, D., Chen, Z. X., and Liu, J. (2012). Evaluation on capability of wind power accommodation based on its day-ahead forecasting. Power Syst. Technol. 36 (8), 69–75.
Khalkho, A. M., Rapada, B., Majumder, G., Cherukuri, M., and Mohanta, D. K. (2022). Impact assessment of solar power generation uncertainty on Smart grid reliability and carbon neutrality. Front. Energy Res. 10, 851449. doi:10.3389/fenrg.2022.851449
Lahouar, A., and Slama, J. B. H. (2015). Day-ahead load forecast using random forest and expert input selection. Energy Convers. Manag. 103, 1040–1051. doi:10.1016/j.enconman.2015.07.041
Li, C., Huang, Y., Liu, C., Wang, Y., Dong, C., and Liang, Z. (2018). “Research on evaluation method of renewable energy absorption capability based on LSTM,” in 2018 2nd IEEE Conference on Energy Internet and Energy System Integration (EI2), China, Beijing, 20–22 October, 2018 (IEEE), 1–5.
Li, G., Li, G., and Zhou, M. (2019). Model and application of renewable energy accommodation capacity calculation considering utilization level of inter-provincial tie-line. Prot. Control Mod. Power Syst. 4, 1–12. doi:10.1186/s41601-019-0115-7
Li, H., Wang, Y., Zhang, X., and Fu, G. Q. (2021). Evaluation method of wind power consumption capacity based on multi-fractal theory. Front. Energy Res. 9, 634551. doi:10.3389/fenrg.2021.634551
Li, P., Fan, G. F., and Wang, W. S. (2016). “Proportion optimization of wind and solar power capacity for regional power network,” in 2016 IEEE PES Asia-Pacific Power and Energy Conference, Xi' an, China, 25-28 October 2016 (IEEE).
Li, Y., He, S., Li, Y., Ding, Q., and Zeng, Z. (2023). Renewable energy absorption oriented many-objective probabilistic optimal power flow. IEEE Trans. Netw. Sci. Eng. 2023, 1–18. doi:10.1109/TNSE.2023.3290147
Liu, C., Cao, Y., Huang, Y. H., Li, P., Sun, Y., and Yuan, Y. (2014). An annual wind power planning method based on time sequential simulations. Automation Electr. Power Syst. 38 (11), 13–19. doi:10.7500/AEPS20130703002
Ma, X., Zhang, Z., Bai, H., Ren, J., Cheng, S., and Kang, X. (2022). A mid/long-term optimization model of power system considering cross-regional power trade and renewable energy absorption interval. Energies 15, 3594. doi:10.3390/en15103594
Song, J., Xue, G., Pan, X., Ma, Y., and Li, H. (2020). Hourly heat load prediction model based on temporal convolutional neural network. IEEE Access 8, 16726–16741. doi:10.1109/access.2020.2968536
Su, Y., Ma, Q., Zhang, Q., Yuan, Q., and Huang, X. (2021). Study on renewable energy accommodation capacity assessment method based on time series production simulation. J. Phys. Conf. Ser. 2076, 012022. doi:10.1088/1742-6596/2076/1/012022
Suo, X., Zhao, S., and Ma, Y. (2022). Multipoint layout planning method for multi-energy sources based on time-series production simulation. Int. J. Energy Res. 46, 9323–9344. doi:10.1002/er.7808
Varganova, A. V., Khramshin, V. R., and Radionov, A. A. (2022). Improving efficiency of electric energy system and grid operating modes: review of optimization techniques. Energies 15, 7177. doi:10.3390/en15197177
Wang, Y., Chen, J., Chen, X., Zeng, X., Kong, Y., Sun, S., et al. (2020). Short-term load forecasting for industrial customers based on TCN-LightGBM. IEEE Trans. Power Syst. 36, 1984–1997. doi:10.1109/tpwrs.2020.3028133
Wang, Y., Song, M., Jia, M., Li, B., Fei, H., Zhang, Y., et al. (2023). Multi-objective distributionally robust optimization for hydrogen-involved total renewable energy CCHP planning under source-load uncertainties. Appl. Energy 342, 121212. doi:10.1016/j.apenergy.2023.121212
Wu, H., Dong, P., and Liu, M. (2020). Distribution network reconfiguration for loss reduction and voltage stability with random fuzzy uncertainties of renewable energy generation and load. IEEE Trans. Industrial Inf. 16, 5655–5666. doi:10.1109/tii.2018.2871551
Yan, Y., Ll, H., Wang, X., and Zhu, D. (2022). “Evaluation method of renewable energy absorption capacity based on time series production simulation,” in 2022 IEEE 5th International Electrical and Energy Conference (CIEEC), China, Nanjing, 27–29 May, 2022 (IEEE), 2214–2219.
Yu, D., Liu, G., Guo, M., and Liu, X. (2018). An improved K-medoids algorithm based on step increasing and optimizing medoids. Expert Syst. Appl. 92, 464–473. doi:10.1016/j.eswa.2017.09.052
Yu, Y., Zhao, H., Zeng, Y., Chen, F., Yang, D., Wang, B., et al. (2023). Accommodation capacity evaluation of renewable energy in power systems considering peak and frequency regulation. Front. Energy Res. 10, 1067884. doi:10.3389/fenrg.2022.1067884
Zhang, Y., Zhang, L., Sun, D., Jin, K. F., and Gu, Y. (2023). Short-term wind power forecasting based on VMD and a hybrid SSA-TCN-BiGRU network. Appl. Sci. 13, 9888. doi:10.3390/app13179888
Zhang, Y. H., Qiu, C. M., He, X., Ling, Z. N., and Shi, X. (2017). A short-term load forecasting based on LSTM neural network. Electr. Power Inf. Commun. Technol. 15 (9), 19–25.
Keywords: renewable energy absorption capacity, attention-enhanced, time convolutional network, uncertainty, multi-scenario
Citation: Wu Y, Zhou H, Zhang C, Liu S and Chen Z (2024) Multi-scenario renewable energy absorption capacity assessment method based on the attention-enhanced time convolutional network. Front. Energy Res. 12:1347553. doi: 10.3389/fenrg.2024.1347553
Received: 01 December 2023; Accepted: 12 January 2024;
Published: 01 February 2024.
Edited by:
Kaiping Qu, China University of Mining and Technology, ChinaReviewed by:
Nan Yang, China Three Gorges University, ChinaChenhui Song, Changsha University of Science and Technology, China
Copyright © 2024 Wu, Zhou, Zhang, Liu and Chen. This is an open-access article distributed under the terms of the Creative Commons Attribution License (CC BY). The use, distribution or reproduction in other forums is permitted, provided the original author(s) and the copyright owner(s) are credited and that the original publication in this journal is cited, in accordance with accepted academic practice. No use, distribution or reproduction is permitted which does not comply with these terms.
*Correspondence: Zongyuan Chen, c2N1dF9jenlAcXEuY29t; Shuangquan Liu, bGl1c2h1YW5ncXVhbkB5bi5jc2cuY24=