 Jucheng Xiao
 Yan Meng
 Li Li1
- 1Key Laboratory of Control of Power Transmission and Conversion, Ministry of Education, Shanghai Jiaotong University, Shanghai, China
- 2College of Electrical Engineering, Zhejiang University, Hangzhou, China
With the increasing prevalence of renewable energy (RE) companies equipped with private energy storage (ES) systems, a dual capability emerges to offer strategic pricing and strategic constraints in market competition. Specifically, these RE companies can strategically leverage their own private ESs to modulate the variability of RE output limits and introduce modified constraints within the market. To examine these new strategic behaviors and the resulting market equilibria, we introduce an innovative bilevel strategic behavior model. The upper level of the model delineates the strategy for RE profit maximization through the imposition of strategic constraints and pricing schemes, while the lower level calculates the revenue outcomes for all entities in the day-ahead energy market clearing. The integration of the bilevel models from all strategic entities leads to the formulation of a new equilibrium problem with equilibrium constraints (EPEC), the solution of which indicates a novel market equilibrium. The impacts of these market equilibria on critical system operation metrics are then evaluated across two representative market mechanisms. Our numerical experiments reveal that RE exhibits low sensitivity to the private ES’s cost, suggesting that the behavior of imposing strategic constraints may be widespread among RE companies owning private ESs. Furthermore, the introduction of strategic constraints enhances the competitiveness of RE, significantly affecting social welfare, energy pricing, and RE integration rate. The study concludes with insights that could inform practical market transactions and system operations.
1 Introduction
With renewable energy (RE) sources increasingly integrating into the power grid (Xiao et al., 2019; Cole et al., 2021), RE generation companies are entering a competitive fray (Meng et al., 2023), necessitating strategic positioning in the market (DeMeo et al., 2004). Unlike conventional thermal power generators with static output limits, RE generators are subject to time-variant maximum power outputs (Nguyen et al., 2022a), influenced by fluctuating weather conditions. This variability introduces a layer of complexity to the strategic maneuvers of market participants (Li et al., 2022a; Tang et al., 2022). In response to the intermittent (Xiao et al., 2020) and uncertain nature of renewables (Luo et al., 2022), several countries have enacted policies mandating that RE generators be equipped with energy storage (ES) systems proportional to their generation capacity (Yang et al., 2018; Li et al., 2022b). The equipped ES systems, as assets owned by the respective RE generation companies, are customized in terms of the maximum capacities and charge/discharge capabilities to suit the needs of specific RE generators. Thus, such ES units are termed “private energy storage” (Ecker et al., 2018; Englberger et al., 2021; Forrester et al., 2022). A private ES is exclusively dedicated to serving the single RE generation company it is associated with. This phenomenon is quite prevalent in the Chinese power system. According to China’s electricity market reform, the capacity of these private ESs must exceed at least 10% of the installed capacity of the RE generators. In some provincial power grids, even higher proportions are mandated, with the capacity of private ESs reaching 15%–30% (Zhang et al., 2022).
Against this backdrop, RE generators are poised to leverage private ES to recalibrate their original output limits and introduce modified constraints within the day-ahead market, thereby augmenting their competitiveness. We define this maneuver as “offering strategic constraints.” With the ascent of RE and ES, RE companies are now positioned to set not only strategic prices but also explore the potential of strategic constraints to reinforce their market standing. It is imperative that these innovative strategic behaviors and the ensuing market equilibria be thoroughly examined.
While existing literature has explored the strategic behavior of RE in the context of market equilibrium, it has primarily been confined to strategic pricing, often formulated within a bilevel modeling framework that includes an upper-level RE profit maximization model and a lower-level market clearing model (Ruiz et al., 2012; Kazempour and Zareipour, 2014; Hartwig and Kockar, 2016; Zou et al., 2016; Heredia et al., 2018; Wang et al., 2018; Guo et al., 2020; Huang et al., 2021; Dai et al., 2022; Naemi et al., 2022; Wang et al., 2022; Zhang et al., 2023a; Zhang et al., 2023b). Commonly, the Karush-Kuhn-Tucker (KKT) conditions (Kazempour et al., 2012; Zeynali et al., 2022) are employed to recast the bilevel problem into a single-level nonlinear framework, namely a mathematical problem with equilibrium constraints (MPEC) (Guo et al., 2020). Market equilibrium is further delineated by amalgamating the MPECs from all strategic producers, forming an equilibrium problem with equilibrium constraints (EPEC) (Ruiz et al., 2012).
Specifically (Guo et al., 2020), delves into the strategic pricing within energy and green certificate markets, while (Ruiz et al., 2012) introduces an analytical model for equilibria in oligopolistic electricity markets with stepwise offer curves. Large-scale wind power integration and its influence on market equilibria are the focus of (Kazempour and Zareipour, 2014), and the interplay between the strategic offerings in coupled gas and electricity markets is examined in (Wang et al., 2018). However, these studies have not addressed the role of ES systems in shaping the strategic behavior of RE generators. A few works, such as (Naemi et al., 2022), have investigated the optimization of battery storage in wind power plants within wholesale markets, but without considering strategic pricing implications.
By introducing dynamic game of strategic RE and ES (Wang et al., 2022), proposes a multi-stakeholder potential game model considering the bounded rationality. Reference (Hartwig and Kockar, 2016) evaluates the impact of strategic behavior of an independent trader who operates private ESs in a nodal electricity market. A multi-period Nash-Cournot equilibrium model for joint energy and ancillary service markets is developed in (Zou et al., 2016). This model evaluates the contributions of private ESs in supporting RE generation. A Cournot competition model is introduced in (Huang et al., 2021) to investigate the impact of the strategic operation of grid-level ES systems on wholesale electricity markets. Reference (Zhang et al., 2023a) constructs a joint optimal bidding strategy for RE units supported by shared ES systems, targeting the maximization of expected daily profits within joint energy and regulation markets. Reference (Heredia et al., 2018) proposes a multi-stage stochastic programming model to ascertain the optimal bids for virtual power plants (VPPs) that include wind power plants and private ESs. Reference (Dai et al., 2022) further expands the modeling horizon with an equilibrium model for electricity markets that incorporates the role of VPPs, consisting of wind farms and distributed ESs, in a secondary market clearing mechanism designed to enhance hydropower consumption. Reference (Zhang et al., 2023b) develops a two-layer equilibrium model to study the grid impact of peer-to-peer energy trading considering ES participation.
While these studies (Ruiz et al., 2012; Kazempour and Zareipour, 2014; Hartwig and Kockar, 2016; Zou et al., 2016; Heredia et al., 2018; Wang et al., 2018; Guo et al., 2020; Huang et al., 2021; Dai et al., 2022; Naemi et al., 2022; Wang et al., 2022; Zhang et al., 2023a; Zhang et al., 2023b) advance the modeling of strategic pricing and market behaviors for the alliance of REs and ESs, they conventionally treat the variable power output constraints of RE resources as fixed parameters. This simplification overlooks the dynamic nature of RE outputs influenced by the integration of ES technologies. In reality, the RE generation company can utilize its private ESs to adjust the maximum power output curves of RE generators, suggesting that the offering constraints of the RE generation company can be treated as strategic variables. Such an approach would provide a more nuanced and realistic representation of the market behaviors and bidding strategies of RE generators, as they report to system operators (SO). Recognizing the variable nature of RE outputs as strategic variables can lead to a more accurate depiction of market equilibria and generator strategies, facilitating improved decision-making processes for both market participants and regulators.
To summarize, this paper identifies two primary research gaps: First, existing strategic behavior models inadequately address the strategic constraints inherent in the alliance of RE generators and private ESs. This oversight is notable given the substantial market influence exerted by private ESs in power systems with high proportion of renewables. Second, existing market equilibrium models fail to capture the dual influence of strategic pricing and strategic constraint offerings by RE generators equipped with private ESs, a scenario increasingly representative of future energy systems.
Our contribution is threefold. First, we propose a pioneering model that captures the strategic behavior of RE generators, employing private ES to dynamically offer variable power output constraints. This model advances the conventional MPEC by integrating offerings of strategic constraints with strategic pricing, thereby introducing an innovative MPEC framework. Second, we formulate a novel EPEC that synthesizes these new MPECs, providing a comprehensive understanding of the market equilibrium dynamics influenced by multiple entities consisting of RE generators and private ESs. Third, we assess the implications of these strategic behaviors on critical operational metrics under typical market mechanisms, offering insights that may guide market transactions and system operations.
The paper is organized as follows. Section 2 delineates the definition of private ES; Section 3 constructs the strategic behavior model for the alliance of RE generators and private ESs; Section 4 develops the new market equilibrium model; Section 5 models the implications on system metrics; Section 6 presents case studies and discusses the results; and Section 7 concludes with valuable insights.
2 Definition of private energy storage
A private ES is defined as an asset dedicated solely to the operations of a single RE generation company and does not directly participate in market clearing processes (Kazemi et al., 2023). The private ESs can exert an indirect influence on market clearing outcomes by modulating the maximum power output curve of the RE generator that owns them. Figure 1 depicts a schematic of how RE generators employ strategic pricing and impose strategic constraints by harnessing private ES units. The primary objective for any RE generator utilizing private ES is to enhance revenue and profit within the energy market.
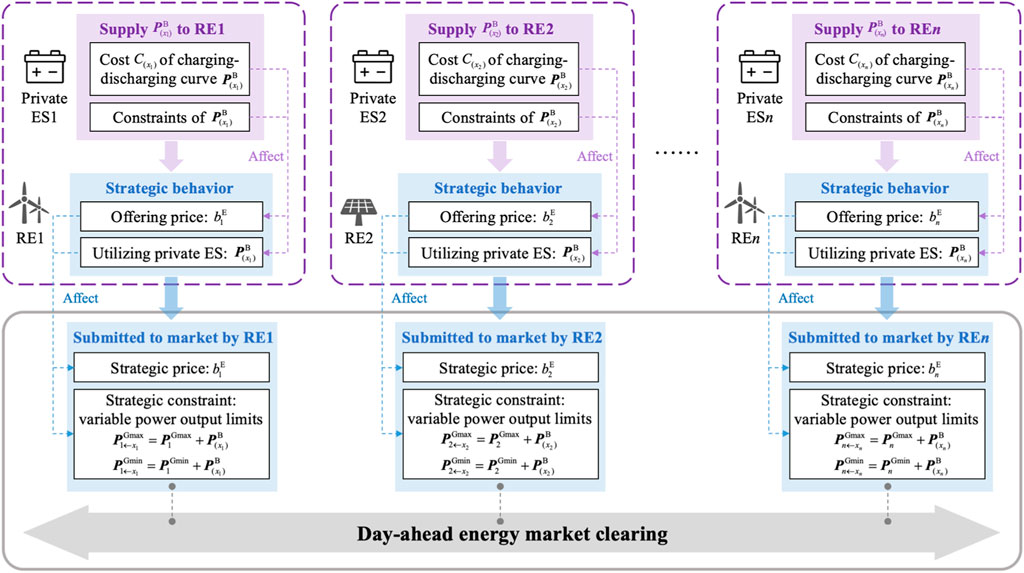
Figure 1. Framework of renewable energy employing strategic pricing and strategic constraints via private energy storage.
For convenience of illustration, we assume that each generation company operates a single generator (denoted as i) paired with one private ES (denoted as xi). Generically, generator i represents an amalgamation of multiple generation units, while private ES xi symbolizes a unified system comprising several ES units. Private ES xi is exclusively dedicated to serving its corresponding generator i, together forming a collaborative entity referred to as alliance i. The operational costs and constraints of private ES xi are encapsulated by Eqs (1–3).
The private ES xi enables RE generator i to present a novel set of strategic constraints and prices to the SO. This study primarily associates strategic constraints with variable power output limits, as expressed in Formula 4. The private ES can provide a charging-discharging regulation curve
From the perspective of SO, the alliance i is a market entity i. It is critical to note that the SO considers generator i in conjunction with xi as an integrated entity within the market clearing model. The SO is agnostic to the internal utilization of private ES by the RE generator, concentrating primarily on the deliverability of the strategic constraints submitted by each entity.
where t is time period; T is the number of time periods; Δt is the time interval;
where G is the set of generators;
3 Strategic behavior of renewable energy generators: utilizing private energy storage for strategic constraints and pricing
Figure 2 illustrates the architecture of the developed bilevel model. The upper-level model formulates the profit maximization strategy for the alliance of RE generators and private ESs, which involves offering strategic constraints and pricing schemes. The lower-level model corresponds to the day-ahead energy market clearing process that calculates the revenues for all market-participating entities. The integration of strategic constraints and pricing links the decision-making in the upper-level model with the outcomes in the lower-level model.
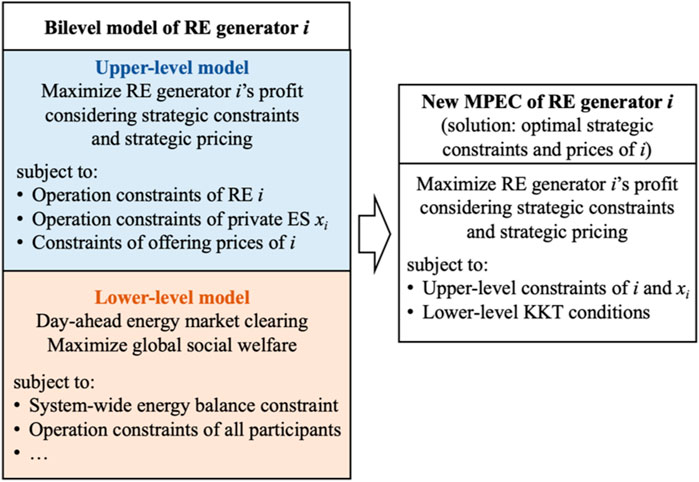
Figure 2. Proposed bilevel strategic behavior model and corresponding new MPEC.
In Section 3, we detail the construction of the bilevel model within the framework of the substitute energy price (SEP) market mechanism (Xiao et al., 2022). To provide a comparative analysis, a corresponding bilevel model is also formulated under the locational marginal price (LMP) market mechanism (Caramanis et al., 1982; Li, 2007), as outlined in Supplementary Appendix SA.
Under the SEP market mechanism, market transactions are executed in two sequential stages. In the first stage, termed the substitute energy market, generators trade their energy production curves, which act as mutual substitutes to fulfill the total energy demand of the system-wide load. The second stage, termed the regulation energy market, orchestrates the trading of regulation services offered by ESs and flexible generators. This stage aims to satisfy the regulation demands arising from both the load and certain generators during the first stage, thus achieving power balance across all time periods.
3.1 Upper-level model: profit maximization through strategic constraints and pricing
In the SEP-based market, the profit maximization problem for a strategic generator i, which involves offering strategic constraints and strategic pricing through the use of private ES, is formulated in Eqs 5–9.
where ri represents the profit of entity i; Ii signifies the revenue of entity i in the day-ahead energy market; πSEP indicates the clearing price of substitute energy market; πREP implies the clearing price of regulation energy market;
3.2 Lower-level model: day-ahead energy market clearing
The lower-level problem represents the process of SO clearing the day-ahead energy market, whose optimization object is to maximize the global social welfare. As delineated in reference (Xiao et al., 2024), the joint clearing of the substitute energy market and the regulation energy market can be efficiently executed in a single stage, as Eqs 11–16.
In Formula 11, WSEP denotes the global social welfare in a SEP-based market; U is the value of electricity usage, which is set as a constant; B signifies the set of independent ESs that participate in the market clearing; Note that private ESs are not included in set B;
In Eqs 12−14,
Formula 15 gives the constraints of substitute energy market. The first equality constraint in (15) represents the supply-demand balance of substitute energy irrespective shape of
Formula 16 presents the constraints of regulation energy market. The first equality constraint in (16) represents the power balance of regulation supply and regulation demand. PDS denotes the system regulation demand;
According to reference (Xiao et al., 2022), the pricing methodologies for the πSEP and πREP are outlined in Eqs 17, 18, respectively. The πSEP is determined as the highest price among the accepted substitute energy bids, reflecting the marginal price of substitute energy within the market. Under the SEP mechanism, the energy curves from various generators act as substitutes for each other, resulting in the πSEP being a one-dimensional price. A similar principle applies to the πREP.
3.3 Reformulation and solution method
The model encompassing Eqs 5–18 constitutes a bilevel problem incorporating absolute values, rendering it computationally intractable. To address this, we initially convert the lower-level problem into a mathematically standard form devoid of absolute values. Subsequently, this bilevel problem is recast as an equivalent single-level nonlinear problem employing the KKT conditions.
Reference (Mangasarian, 2014) provides a mathematical method for transforming decision variables related to absolute values into continuous decision variables without absolute values. Based on this method, we have made an equivalent substitution of the decision variables
where
By incorporating Eq. 19 into the model defined by Eqs 11–16, we derive a standard lower-level model without absolute values, as denoted by Eqs 21, 22.
where λE,
The Lagrangian for this standard lower-level model is formulated in Eq. 22, and the corresponding KKT optimality conditions are delineated in Eqs 23–48.
This reformulation process effectively transforms the original bilevel problem into an equivalent single-level problem, characterized by the objective function in Eq. 5 and the constraints set forth in Formula 9, Eqs 23–48. The nonlinear terms in this mathematical model, such as the complementarity slackness conditions and the product terms of decision variables, can be handled using conventional methods as detailed in (Kazempour et al., 2012). Ultimately, the proposed MPEC can be solved using the GUROBI optimization software.
4 Market equilibrium of proposed strategic behavior model
For each strategic entity i, the reformulated single-level model constitutes a novel MPEC. This new MPEC diverges from traditional models by incorporating strategic constraints alongside strategic pricing.
For the strategic interaction between all market entities (i = 1,2,…,n), there are a total of n MPECs. The joint solution of these new MPECs of all entities constitutes an innovative EPEC, as depicted in Figure 3. Unlike conventional EPEC formulations, the solutions derived from this novel EPEC represent the market equilibrium for multiple RE-ES alliances that engage in both strategic pricing (e.g.,
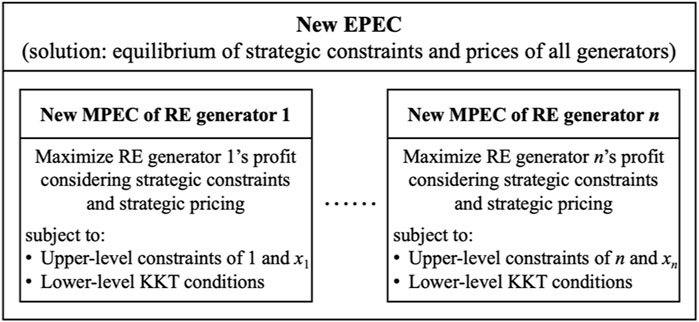
Figure 3. Proposed market equilibrium model and corresponding new EPEC.
To ascertain the equilibrium, the diagonalization algorithm (Hu and Ralph, 2007) is employed, where each strategic generator’s MPEC is iteratively solved until the profit ri (i = 1,2,…,n) stabilizes. It should be emphasized that the computational burden of the EPEC surges dramatically with the increasing size of the system and the number of generators. To address the challenge, several methods are available. One effective method applied in this study is a reductionist approach, aggregating multiple generators with identical characteristics to significantly reduce the total number of generators. This allows us to demonstrate typical strategic behaviors and the resulting market equilibria. Other methods include employing heuristic algorithms to provide favorable initial values for faster convergence and utilizing parallel computing to enhance the speed of the computational process. However, the latter methods are beyond the scope of this paper and are not explored here.
In summary, the scope of application for the novel MPEC and EPEC developed in this paper is outlined as follows. In terms of the proposed framework, referring to Figure 1, the private ESs in practical applications can be substituted with various generalized ESs (Liu et al., 2023), including conventional ES systems (Nguyen et al., 2022b), VPPs with distinct external characteristics (Fan et al., 2020; Yang et al., 2024), and flexible load aggregators (Sun et al., 2022). In terms of modeling, the proposed model fundamentally represents the strategic interactions among different alliances. However, it is not applicable to shared ES resources (Zhang et al., 2023c), as these serve multiple stakeholders simultaneously, thereby increasing the physical and economic coupling between different alliances.
5 Impact on system operation metrics
To assess the impact of the proposed strategic behaviors on the market dynamics and power system operations, we focus on three critical system operation metrics: true global social welfare (W*), total load payment (I*), and RE integration rate (R*), as defined in Eq. 49. These metrics serve as indicators of various practical aspects of the power system.
In particular, true global social welfare (W*) offers insights into the overall economic efficiency and effective resource utilization within the power system. This metric diverges from the approach used in Eq. 11 by considering actual production costs, thereby transcending strategic offering prices to reflect genuine economic optimality.
The total load payment (I*) provides a measure of the financial burden on consumers, encapsulating the costs associated with energy consumption and associated fees. This metric is pivotal in understanding the economic implications for end-users in the power market.
Lastly, the RE integration rate (R*) is a crucial indicator of the system’s capacity to integrate RE resources, which is instrumental in gauging progress towards reducing carbon emissions. This metric underscores the importance of integrating sustainable energy resources into the power grid.
where
6 Case study
6.1 Introduction of case study
Due to the significant computational complexity involved with the new EPEC, this study simplifies the diverse range of practical generators into three types: thermal (G1), wind (G2), and photovoltaic (G3) power generators. These types, G1, G2, and G3, aim to represent the strategic behaviors characteristic of their respective generator categories. Alongside these generators, an independent ES also participates in the day-ahead energy market. The independent ES’s offering price is non-strategic, fixed at aS = 0.0024 US$/MWh2, bS = 60 US$/MWh and cS = 0 US$. Besides, G1, G2, and G3 can leverage their respective private ES units (denoted as private ES1, private ES2 and private ES3) to increase their profits by regulating their maximum power outputs. That is to say, the maximum power output constraints for generators G1, G2 and G3 are strategic. Furthermore, the first-order coefficients
The load data, as well as the forecasted wind and solar power generation figures, are based on (Ye et al., 2017; Wang et al., 2008; Li et al., 2021). The number of time periods is set as T = 8 and the time interval is set as Δt = 3 h. The nominal capacities of generators G1, G2, and G3 are set at 500 MW, 600 MW, and 600 MW, respectively. The RE constitutes 71% of the total installed capacity. The forecasted maximum outputs for wind and photovoltaic power are 95% and 73% of their respective capacities. The maximum charge and discharge power for the independent ES, as well as all private ESs, are set at 200 MW. Partial case studies incorporate the ES capacity constraints. Differentiated parameter settings will be clarified in the corresponding sections.
The case study is structured as follows: Section 6.2 presents the proposed strategic behaviors of the generators and conducts sensitivity analysis. Section 6.3 explores the market equilibrium that results from strategic constraints combined with non-strategic pricing. Section 6.4 investigates the market equilibrium when strategic constraints are paired with strategic pricing.
6.2 Sensitivity analysis of strategic behavior in RE utilizing private ES
6.2.1 Strategic constraint formation
The strategic constraint arises from the RE generator’s optimal utilization of its private ES. This section delves into the analysis of this process in the context of the SEP mechanism. The regulation price for private ES2 is set at 40 US$/MWh. For G2, equipped with private ES2, the solution of the newly proposed MPEC is depicted in Figure 4. In the day-ahead energy market, the wind power generator G2 utilizes private ES2 to adjust its original upper power output limit during periods 2, 4, and 6, thereby establishing a new upper limit. This adjustment constitutes the strategic constraint of G2, as shown in the red line in Figure 4. As a result, G2’s energy curve better aligns with the regulation responsibility curve mandated by the SEP market mechanism. Consequently, the system’s required flexibility (regulation energy) for accommodating wind power decreases from 3,378 MWh to 2,223 MWh. Thus, the market share for G2’s awarded substitute energy expands from 6,813 MWh to 8,947 MWh, and G2’s profits rise from 579.1 thousand US$ to 713.0 thousand US$. This preliminary test demonstrates that the strategic use of private ESs is both profitable and substantial. Such strategic behaviors are likely to be widespread among RE generators that are equipped with private ESs.
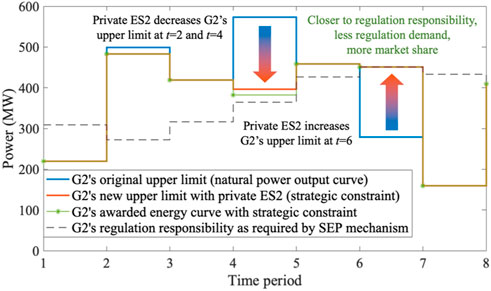
Figure 4. Strategic constraint formation by wind power generator G2 with private ES2.
6.2.2 Sensitivity of RE’s strategic behavior to private ES’s cost
The sensitivity of the wind power generator G2’s strategic behavior to the private ES2’s cost is assessed under SEP mechanism, as depicted in Figure 5. The financial analysis reveals that G2 benefits from employing private ES2 within a price range of [0, 280] US$/MWh, identifying 280 US$/MWh as the approximate maximum profitable price. It is noteworthy that the market clearing price for regulation energy fluctuates between [60, 70] US$/MWh. This implies that even when the cost of private ESs exceeds market prices, RE generators can still secure higher profits through using private ESs. This occurs because the independent ESs in the market are oriented towards enhancing global social welfare, whereas the private ESs primarily cater to the financial objectives of their associated RE generators. Leveraging the SEP mechanism, modifications to the original wind power output curve can significantly enhance G2’s revenue from the substitute energy market. The strategic utilization of private ES2 by G2 is justified as long as the incremental revenue from the substitute energy market outweighs the regulation costs incurred, thus affirming the strategic deployment of private ES.
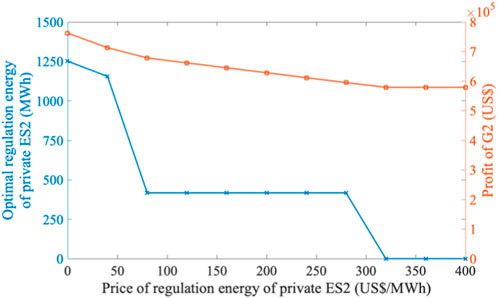
Figure 5. Sensitivity of wind power generator G2’s strategic behavior to private ES2’s cost.
The implications derived from these findings are twofold: 1) The SEP mechanism effectively incentivizes RE generators towards ES integration by diminishing the profit dependency on private ESs’ costs. 2) High-cost ESs, while not benefiting directly from market participation due to competitive dynamics, can form profitable alliances with RE generators, circumventing market price constraints. For instance, a private ES2 pricing its regulation energy at 120 US$/MWh would find market participation unprofitable due to lower competitor pricing (below 70 US$/MWh). However, this same ES could form a profitable collaboration with G2, selling 417 MWh of regulation energy to G2 at a profitable rate, as detailed in Figure 5, thereby altering market dynamics and reinforcing the strategic positioning of RE generators.
6.2.3 Sensitivity of RE’s strategic behavior to private ES’s capacity
To analyze the sensitivity of RE’s strategic behavior to the capacity of its private ES, different maximum capacities for private ES2, ranging from 300 MWh to 1800 MWh, are set. The minimum capacity of private ES2 is fixed at 20% of its maximum, and the initial state of charge is set at 60% of the maximum capacity. Figure 6 presents the results of this sensitivity analysis. It is observed that when the capacity of the private ES2 is less than 600 MWh, the sensitivity of G2’s strategic behavior is high, indicating significant fluctuations in the profit of the alliance of G2 and private ES2. When the capacity of the private ES2 ranges from 600 MWh to 1,400 MWh, the sensitivity of G2’s optimal strategy notably decreases. This is primarily due to the diminishing marginal utility of the regulation energy provided by the private ES2, which concurrently weakens the impacts of the strategic constraints. Beyond 1,400 MWh, G2’s profit remains almost unchanged, suggesting that G2 has identified a dominant strategy in the SEP-based energy market, eliminating the need to calculate alternative strategies. Overall, while the capacity of private ES imposes certain limitations on the strategic behavior of RE, the act of providing strategic constraints still enhances the total profit of the RE-ES alliance and strengthens the market competitiveness of RE generators.
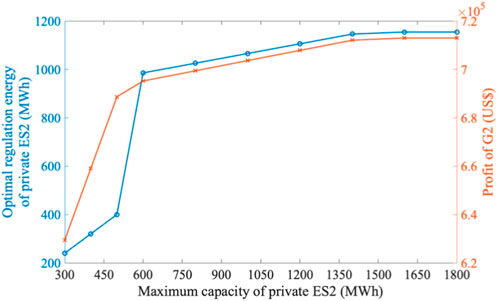
Figure 6. Sensitivity of wind power generator G2’s strategic behavior to private ES2’s capacity.
6.2.4 Sensitivity of RE’s strategic behavior to proportion of RE
This sensitivity analysis investigates how the strategic behavior of wind power generator G2 is influenced by the proportion of wind power in the energy mix, under the SEP mechanism, as detailed in Table 1.
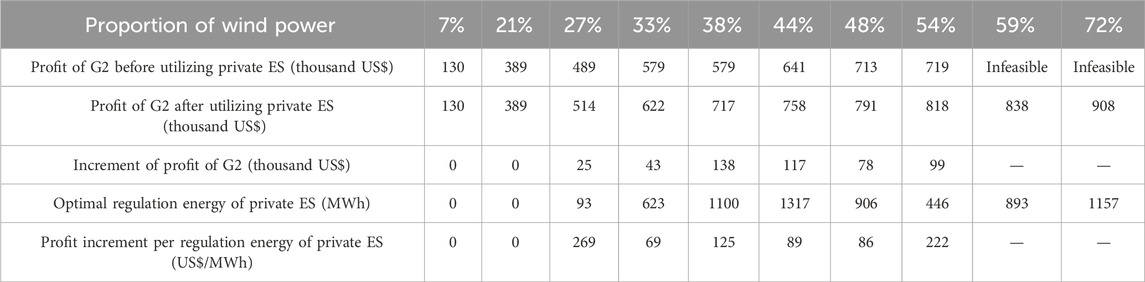
Table 1. Sensitivity of wind power generator G2’s strategic behavior to proportion of wind power.
In scenarios where the proportion of wind power is low, specifically in the range of [0%, 21%], the generated wind power is entirely consumed, negating the need for G2 to employ private energy storage. In such cases, the influence of wind power proportion on G2’s strategic behavior is markedly low.
Conversely, at higher wind power proportions ([27%, 54%]), the optimal strategy involving the use of regulation energy from private ES2 shows significant variability, ranging from [93, 1317] MWh. Correspondingly, the profit increase per unit of regulation energy fluctuates between [69, 269] US$/MWh. It is important to note that the engagement of private ES2 is not directly proportional to the increase in wind power, highlighting the complexity of these strategic behaviors in practical scenarios. In this range, the sensitivity of G2’s strategic decisions to wind power proportion is considerably more pronounced.
Furthermore, when the proportion of wind power lies between [59%, 72%], operating the market clearing model without private ES2 becomes infeasible due to excessive flexibility demands, which exceeds the flexible regulation capability of thermal power G1 and the independent ES. However, with the utilization of private ES2 by G2, the model attains feasibility, enabling not only an increase in RE profit but also an enhancement in RE integration—from 54% to 72%.
This analysis underscores the critical role of private ES in optimizing strategic outcomes and augmenting the integration of renewable energy within the power system.
6.2.5 Comparative impact analysis under LMP and SEP mechanisms
Figure 7 and Figure 8 illustrate the outcomes of wind power G2’s strategic application of private ES2 and its subsequent effects on system operation metrics under LMP and SEP mechanisms, respectively. For comparative analysis, all metrics are normalized against a benchmark scenario where no private ES is utilized by the generators.
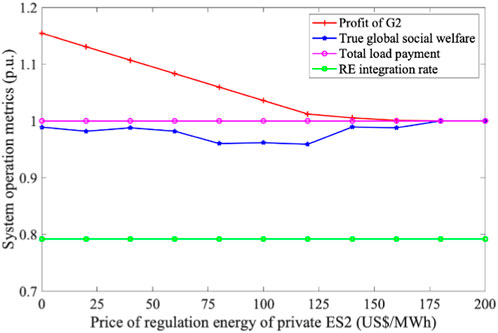
Figure 7. Impact of strategic utilization of private ES on system operation metrics under LMP mechanism. Note that πLMP represents the clearing price under LMP market mechanism; and πLMP = [368, 120, 38, 40, 120, 120, 368, 368] US$/MWh in the benchmark.
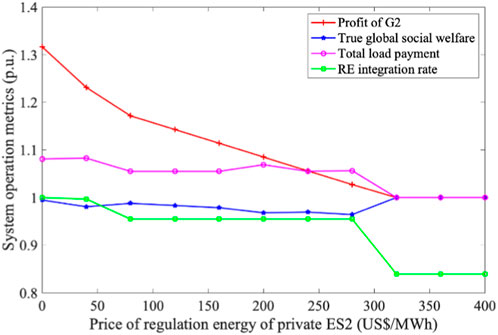
Figure 8. Impact of strategic utilization of private ES on system operation metrics under SEP mechanism. Note that πSEP = 120 US$/MWh and πREP = 64 US$/MWh in the benchmark.
In the LMP-based market framework, the most profitable pricing point for private ES2 is identified at approximately 160 US$/MWh. This pricing strategy largely hinges on exploiting the maximum price differential across different time intervals, characterized by charging at the lowest LMP and discharging at the highest LMP. Therefore, the market share of RE does not significantly impact the optimal strategy for employing private ES. Unfortunately, this leads to an undesirable consequence: the LMP mechanism falls short in motivating entities to equip private ES as a means to enhance the RE integration rate. Consequently, as shown in Figure 7, the RE integration rate remains constant at 79%, demonstrating insensitivity to the private ES’s price under the LMP model.
Conversely, in the SEP-based market, both energy and regulation emerge as independent commodities available for trade. Here, the primary strategy for RE generators to enhance profitability through private ES usage centers on increasing their share in the energy market. This unique characteristic of the SEP model fosters an increase in the RE integration rate, elevating it from 84% to 100%, as evidenced in Figure 8.
Comparatively, the SEP mechanism outperforms the LMP model in facilitating RE integration, reducing carbon emissions, and contributing to sustainable development. Furthermore, the assessment within the MPEC framework indicates that both global social welfare and total load payment under the LMP and SEP mechanisms are comparable, with fluctuations around 1.0 p.u. These parameters will undergo further comparative analysis in the context of the EPEC as elaborated in Section 6.3 and Section 6.4.
6.3 Market equilibrium of strategic constraints and non-strategic pricing
In this section, we simulate the strategic behaviors of generators G1, G2, and G3, each employing their respective private energy storages ES1, ES2, and ES3. This simulation aims to demonstrate the solutions of the newly proposed EPEC. The pricing for these private ES units is standardized, set at a(x) = 0.001 US$/MWh2, b(x) = 10 US$/MWh and c(x) = 0 US$. Figure 9 and Figure 10 depict the market equilibrium achieved by these strategic generators utilizing private ESs and imposing strategic constraints. Table 2 and Table 3 present the impacts of these market equilibria on system operation metrics under LMP and SEP mechanisms, respectively. For comparative purposes, benchmark scenarios are established in which no strategic behaviors occur under the respective market mechanisms. In the case of thermal power generator G1, due to its robust flexibility and low regulation cost, the optimal strategy does not involve the use of private ES1, resulting in an optimal regulation energy of 0 MWh.
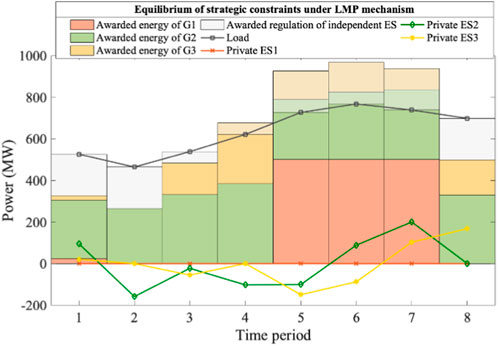
Figure 9. Market equilibrium of strategic generators utilizing private ESs and offering strategic constraints under LMP mechanism. Note that πLMP = [120, 120, 120, 120, 120, 373, 120, 120] US$/MWh in the benchmark, while πLMP = [120, 40, 120, 120, 371, 371, 370, 120] US$/MWh in the equilibrium.
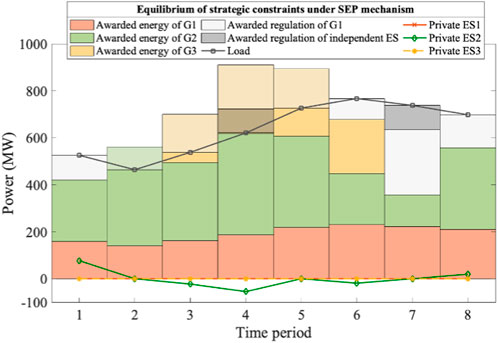
Figure 10. Market equilibrium of strategic generators utilizing private ESs and offering strategic constraints under SEP mechanism. Note that πSEP = 120 US$/MWh and the πREP = 63 US$/MWh in the benchmark and the equilibrium.

Table 2. Impact of market equilibrium with strategic constraints under LMP mechanism.
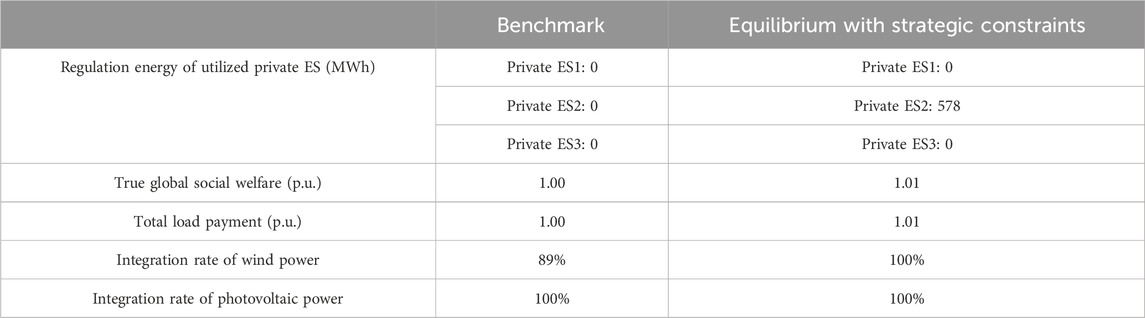
Table 3. Impact of market equilibrium with strategic constraints under SEP mechanism.
Under the LMP mechanism, significant regulation energy from private ESs is utilized by both wind power G2 (2,303 MWh) and photovoltaic G3 (1752 MWh). This usage leads to a 5% decrease in true global social welfare and a 41% increase in total load payment, indicating a surge in energy prices. Due to the market competitiveness enhanced by strategic constraints of RE entities, the revenues of G2 and G3 increased by 258 thousand US$ and 114 thousand US$, respectively, with their revenue growth rates being 19% and 21%.
Without strategic pricing, this equilibrium reveals some defects of LMP mechanism, that is, the profit-driven behaviors of utilizing ES is not well incentive-compatible with the system operation metrics. Moreover, due to the 100% RE integration rate in the benchmark scenario, RE generators opt for creating higher time-period price differences using private ESs rather than increasing their energy market share in the equilibrium, resulting in enhanced price volatility, as illustrated in Figure 9.
Conversely, under the SEP mechanism, strategic use of private ES combined with non-strategic pricing does not significantly alter the market clearing prices (πSEP and πREP). Meanwhile, due to the 100% integration of photovoltaic in the benchmark, the market share of photovoltaic G3 has attained its maximum possible value, leading to an optimal regulation energy of 0 MWh for private ES3 in the equilibrium. This contrasts with the LMP mechanism, as G3’s market-detrimental strategic behavior is mitigated by the SEP mechanism.
Besides, wind power G2, employing private ES2 (with optimal regulation energy of 578 MWh), increases its integration rate from 89% to 100% in the equilibrium, thereby earning increased revenue in the SEP-based market. In this scenario, both the true global social welfare and the total load payment see a 1% increase. Compared to the LMP mechanism, the SEP mechanism encourages RE generators to use less regulation energy, resulting in a more efficient market equilibrium. These outcomes suggest that the SEP mechanism aligns more effectively with the incentives for RE and ES integration. A key reason is that the SEP mechanism collectively treats the energy production curve from each entity as a whole, trading them as vector-level substitutes. This design is more adaptive to the synergistic trading of the energy produced by RE and the flexibility provided by ES.
6.4 Market equilibrium of strategic constraints and strategic pricing
In this section, we examine the strategic behavior of generators, taking into account both strategic constraints and strategic pricing. For clarity in this analysis, the time periods are set to T = 4, with a time interval of Δt = 6 h. The maximum capacities of both the private and independent ES systems are set at 800 MWh, with an initial state of charge of 480 MWh. The minimum capacities for these ESs are fixed at 160 MWh. All other parameters employed are consistent with those detailed in Section 6.3. Table 4 and Table 5 present the outcomes of market equilibrium and their impacts under the LMP and SEP mechanisms, respectively.
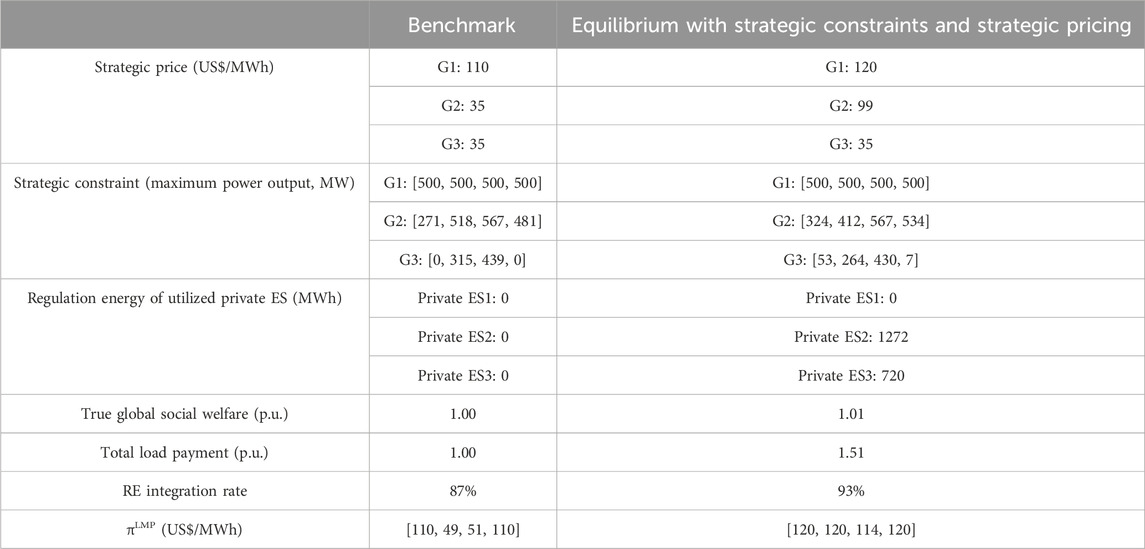
Table 4. Impact of market equilibrium with strategic constraints and strategic pricing under LMP mechanism.
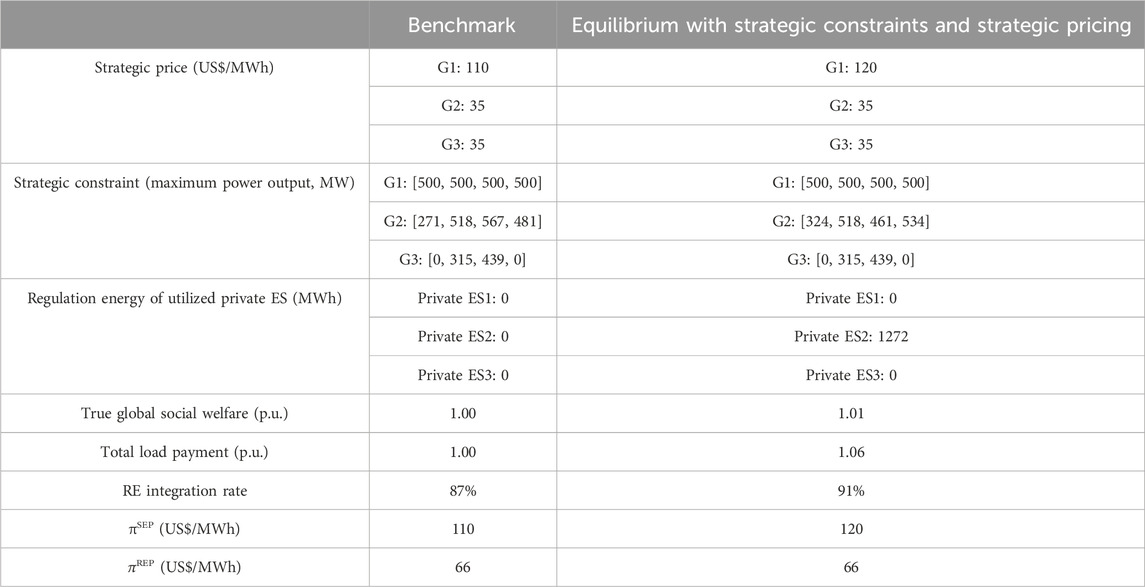
Table 5. Impact of market equilibrium with strategic constraints and strategic pricing under SEP mechanism.
Under the LMP mechanism, the equilibrium prices for G1, G2, and G3 are derived to be 120, 99, and 35 US$/MWh, respectively. In this scenario, RE generators (G2 and G3) extensively utilize the regulation energy from their private ESs to enhance profitability by imposing strategic constraints. For instance, the optimal regulation curve produced by private ES3 in the LMP market equilibrium is [53, −51, −9, 7] MW, resulting in a regulation energy of 720 MWh. By integrating the private ES3, the strategic constraint of photovoltaic G3 shifts from its natural output curve [0, 315, 439, 0] MW to a modified maximum power output constraint [53, 264, 430, 7] MW, as detailed in Table 4.
Consequently, the market share of RE and the rate of RE integration increase by 6%, and the true global social welfare improves by 1%, compared to the benchmark outlined in Table 4. However, the cost of enhancing the RE integration rate, under simultaneous strategic constraints and pricing, is substantial, resulting in a 51% increase in total load payment. This indicates that elevating the RE integration rate in the LMP market incurs a high economic cost. It also suggests that the LMP mechanism is somewhat deficient in guiding market-beneficial strategic behaviors and in restraining excessive profiteering by RE-ES alliances.
Under the SEP mechanism, the equilibrium prices for G1, G2, and G3 are 120, 35, and 35 US$/MWh, respectively. Only wind power G2 implements a strategic constraint [324, 518, 461, 534] MW. A comparison between Table 4 and Table 5, particularly regarding the regulation energy utilized by private ESs, highlights a notable aspect of the SEP mechanism: entities achieve a more favorable market equilibrium with less regulation energy compared to the LMP mechanism. Specifically, relative to the benchmark, the SEP-based market equilibrium shows a 1% increase in true global social welfare and a 4% improvement in RE integration rate, with these enhancements incurring only a 6% increase in the total load payment.
Although the increment in the RE integration rate under the SEP mechanism is 2% lower than that of the LMP mechanism, there is a substantial 45% reduction in the total load payment. This indicates that in markets with strategic behaviors, the SEP mechanism promotes RE integration at a lower economic cost and more effectively guides stakeholders towards decisions that are beneficial to the market and the power system.
Figure 11 gives a comprehensive comparison of the LMP and SEP mechanisms in terms of market equilibria and strategic behaviors. This comparison is primarily based on the simulation results from Section 6.4, supported by the findings in Section 6.2 and Section 6.3. Both the SEP and LMP mechanisms exhibit similar effects on true global social welfare, fluctuating within the range of 0.95–1.05. Each mechanism encourages RE generators to leverage private ESs to improve their market share. The LMP mechanism slightly outperforms the SEP mechanism in enhancing the RE integration rate by approximately 2%. However, in terms of the average cost of promoting RE integration, the SEP mechanism demonstrates a more significant advantage, as explained below.
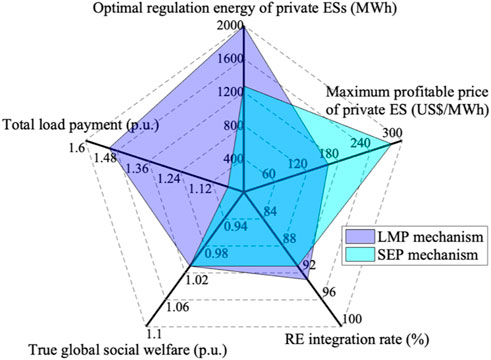
Figure 11. Comprehensive comparison of LMP and SEP mechanism in market equilibrium of strategic constraints and strategic pricing.
On one hand, the LMP mechanism tends to result in a higher total load payment, approximately 41%–52%. In contrast, the SEP mechanism only causes a 1%–6% increase in total load payment. On the other hand, under the LMP mechanism, RE generators consume substantial amounts of regulation energy produced by private ESs, around 1900 to 4,000 MWh, to boost their market share. Conversely, under the guidance of the SEP mechanism, achieving a similar rate of RE integration requires only 500 to 700 MWh of regulation energy. This indicates that the LMP mechanism may foster more market-detrimental competitive behaviors, potentially leading to unnecessary utilization of flexibility resources and higher electricity prices. Fortunately, SEP significantly mitigates this issue, facilitating strategic behaviors that are more beneficial to the electricity market and power systems.
Additionally, within the SEP framework, a higher maximum profitable price for private ESs is noted, indicating a greater willingness among ES resources to offer regulation services to RE generators. Such incentives are key in fostering the cooperation of RE and ES, contributing to a more stable and efficient power supply.
7 Conclusion
This paper develops an innovative model for the market behaviors of RE generators equipped with private ESs. These entities uniquely offer not only conventional strategic pricing but also novel strategic constraints to the SO, leading to a new market equilibrium conceptualization. The impacts of these strategic behaviors on pivotal system operation metrics are analyzed under both LMP and SEP market mechanisms. The key findings from our numerical experiments are summarized as follows:
(1) The Role of Private ES. At the entity level, the private ESs enable the RE generation companies to offer strategic constraints on the electricity market. A typical strategy involves utilizing the ES’s charging-discharging curve to modify the dynamic maximum power output limits of RE generators. Fundamentally, the private ES not only expands the energy market share of RE companies but also facilitates additional profits through the provision of flexibility. Consequently, RE entities usually show low sensitivity towards private ESs’ costs, indicating widespread adoption of private ESs and strategic constraints among REs. At the system level, the absence of private ES renders market feasibility problematic when the proportion of RE surpasses 59%. This underscores the significant role of private ES in enhancing the system’s potential for maximum RE integration by up to 18%.
(2) Strategic Constraints and Strategic Pricing of RE. Under policies requiring ES deployment in RE systems, RE generation companies have developed dual capabilities in strategic constraints and pricing to recover costs of their assets. The RE profits from strategic constraints in two primary ways: firstly, by offering more competitive constraints to enhance awarded energy, and secondly, by capitalizing on larger peak-to-valley price differentials for arbitrage purposes. The SEP mechanism primarily influences RE generators to adopt the former approach, while the LMP mechanism tends to incentivize the latter.
(3) New Market Equilibrium. The dual strategic behaviors of all RE entities in the market collectively establish a new market equilibrium, which has diverse impacts on system operation metrics. Both the SEP and LMP mechanisms demonstrate similar effects on the true global social welfare and the RE integration rate. However, under the LMP mechanism, an excessive use of regulation energy from private ESs for competitive advantage leads to resource wastage and a sharp increase in the total load payment. Fortunately, the SEP mechanism guides more system-beneficial strategic behaviors and equilibria, curbing unreasonable high electricity prices and efficiently integrating RE and ES.
Future research will delve deeper into market equilibria based on strategic constraints and strategic pricing, taking into account complex real-world factors. These include the combined effects of shared ESs and private ESs, geographical location issues, grid power flow constraints, and joint optimization offering strategies in electricity-carbon coupled markets. Such comprehensive studies will thereby contribute to the advancement towards a clean energy future.
Data availability statement
The original contributions presented in the study are included in the article/Supplementary Material, further inquiries can be directed to the corresponding author.
Author contributions
JX: Conceptualization, Data curation, Formal Analysis, Investigation, Methodology, Project administration, Validation, Visualization, Writing–original draft. YM: Data curation, Formal Analysis, Investigation, Methodology, Validation, Writing–review and editing. LL: Data curation, Formal Analysis, Investigation, Validation, Visualization, Writing–review and editing. SF: Methodology, Project administration, Resources, Validation, Visualization, Writing–review and editing. GH: Conceptualization, Formal Analysis, Methodology, Project administration, Resources, Supervision, Validation, Writing–original draft, Writing–review and editing. ZL: Data curation, Formal Analysis, Resources, Supervision, Validation, Visualization, Writing–review and editing.
Funding
The author(s) declare that no financial support was received for the research, authorship, and/or publication of this article.
Conflict of interest
The authors declare that the research was conducted in the absence of any commercial or financial relationships that could be construed as a potential conflict of interest.
Publisher’s note
All claims expressed in this article are solely those of the authors and do not necessarily represent those of their affiliated organizations, or those of the publisher, the editors and the reviewers. Any product that may be evaluated in this article, or claim that may be made by its manufacturer, is not guaranteed or endorsed by the publisher.
Supplementary material
The Supplementary Material for this article can be found online at: https://www.frontiersin.org/articles/10.3389/fenrg.2024.1346528/full#supplementary-material
References
Caramanis, M., Bohn, R., and Schweppe, F. (1982). Optimal spot pricing: practice and theory. IEEE Trans. Power Appar. Syst. 101, 3234–3245. doi:10.1109/tpas.1982.317507
Cole, W., Greer, D., Denholm, P., Frazier, A. W., Machen, S., Mai, T., et al. (2021). Quantifying the challenge of reaching a 100% renewable energy power system for the United States. Joule 5, 1732–1748. doi:10.1016/j.joule.2021.05.011
Dai, X., Chen, H., and He, Q. (2022). An equilibrium model of the electricity market considering the participation of virtual power plants. Energy Rep. 8, 506–514. doi:10.1016/j.egyr.2022.08.096
DeMeo, E., Porter, K., and Smith, C. (2004). A living summary of markets and market rules for wind energy and capacity in North America. United States: Utility Wind Interest Group.
Ecker, F., Spada, H., and Hahnel, U. J. J. (2018). Independence without control: autarky outperforms autonomy benefits in the adoption of private energy storage systems. Energy Pol. 122, 214–228. doi:10.1016/j.enpol.2018.07.028
Englberger, S., Chapman, A. C., Tushar, W., Almomani, T., Snow, S., Witzmann, R., et al. (2021). Evaluating the interdependency between peer-to-peer networks and energy storages: a techno-economic proof for prosumers. Adv. Appl. Energy 3, 100059. doi:10.1016/j.adapen.2021.100059
Fan, S., Liu, J., Wu, Q., Cui, M., Zhou, H., and He, G. (2020). Optimal coordination of virtual power plant with photovoltaics and electric vehicles: a temporally coupled distributed online algorithm. Appl. Energy 277, 115583. doi:10.1016/j.apenergy.2020.115583
Forrester, S., Barbose, G., and Miller, C. (2022). Private vs. public value of U.S. residential battery storage operated for solar self-consumption. iScience 25, 104714. doi:10.1016/j.isci.2022.104714
Guo, H., Chen, Q., Xia, Q., and Kang, C. (2020). Modeling strategic behaviors of renewable energy with joint consideration on energy and tradable green certificate markets. IEEE Trans. Power Syst. 35, 1898–1910. doi:10.1109/tpwrs.2019.2953114
Hartwig, K., and Kockar, I. (2016). Impact of strategic behavior and ownership of energy storage on provision of flexibility. IEEE Trans. Sustain. Energy 7, 744–754. doi:10.1109/tste.2015.2497967
Heredia, F. J., Cuadrado, M. D., and Corchero, C. (2018). On optimal participation in the electricity markets of wind power plants with battery energy storage systems. Comput. Oper. Res. 96, 316–329. doi:10.1016/j.cor.2018.03.004
Hu, X., and Ralph, D. (2007). Using EPECs to model bilevel games in restructured electricity markets with locational prices. Oper. Res. 55, 809–827. doi:10.1287/opre.1070.0431
Huang, Q., Xu, Y., and Courcoubetis, C. A. (2021). Strategic storage operation in wholesale electricity markets: a networked Cournot game analysis. IEEE Transa. Netw. Sci. Eng. 8, 1789–1801. doi:10.1109/tnse.2021.3073723
Kazemi, M., Tabatabaei, S. S., and Moslemi, N. (2023). A novel public-private partnership to increase the penetration of energy storage systems in distribution level. J. Energy Storage 62, 106851. doi:10.1016/j.est.2023.106851
Kazempour, S. J., Conejo, A. J., and Ruiz, C. (2012). Strategic generation investment considering futures and spot markets. IEEE Trans. Power Syst. 27, 1467–1476. doi:10.1109/tpwrs.2011.2182664
Kazempour, S. J., and Zareipour, H. (2014). Equilibria in an oligopolistic market with wind power production. IEEE Trans. Power Syst. 29, 686–697. doi:10.1109/tpwrs.2013.2286094
Li, F. (2007). Continuous locational marginal pricing (CLMP). IEEE Trans. Power Syst. 22, 1638–1646. doi:10.1109/tpwrs.2007.907521
Li, H., Yeo, J. H., Bornsheuer, A. L., and Overbye, T. J. (2021). The creation and validation of load time series for synthetic electric power systems. IEEE Trans. Power Syst. 36, 961–969. doi:10.1109/tpwrs.2020.3018936
Li, J., Ai, Q., Yin, S., and Hao, R. (2022a). An aggregator-oriented hierarchical market mechanism for multi-type ancillary service provision based on the two-loop Stackelberg game. Appl. Energy 323, 119644. doi:10.1016/j.apenergy.2022.119644
Li, R., Tang, B. J., Yu, B., Liao, H., Zhang, C., and Wei, Y. M. (2022b). Cost-optimal operation strategy for integrating large scale of renewable energy in China’s power system: from a multi-regional perspective. Appl. Energy 325, 119780. doi:10.1016/j.apenergy.2022.119780
Liu, S., Chen, C., Jiang, Y., Lin, Z., Wang, H., Waseem, M., et al. (2023). Bi-level coordinated power system restoration model considering the support of multiple flexible resources. IEEE Trans. Power Syst. 38, 1583–1595. doi:10.1109/tpwrs.2022.3171201
Luo, J., Li, H., and Wang, S. (2022). A quantitative reliability assessment and risk quantification method for microgrids considering supply and demand uncertainties. Appl. Energy 328, 120130. doi:10.1016/j.apenergy.2022.120130
Mangasarian, O. L. (2014). Absolute value equation solution via linear programming. J. Optim. Theory Appl. 161, 870–876. doi:10.1007/s10957-013-0461-y
Meng, Y., Fan, S., Shen, Y., Xiao, J., He, G., and Li, Z. (2023). Transmission and distribution network-constrained large-scale demand response based on locational customer directrix load for accommodating renewable energy. Appl. Energy 350, 121681. doi:10.1016/j.apenergy.2023.121681
Naemi, M., Davis, D., and Brear, M. J. (2022). Optimisation and analysis of battery storage integrated into a wind power plant participating in a wholesale electricity market with energy and ancillary services. J. Clean. Prod. 373, 133909. doi:10.1016/j.jclepro.2022.133909
Nguyen, T. T., Nguyen, T. T., and Duong, M. Q. (2022a). An improved equilibrium optimizer for optimal placement of photovoltaic systems in radial distribution power networks. Neural comput. applic. 34, 6119–6148. doi:10.1007/s00521-021-06779-w
Nguyen, T. T., Nguyen, T. T., and Nguyen, H. P. (2024). Optimal soft open point placement and open switch position selection simultaneously for power loss reduction on the electric distribution network. Expert Syst. Appl. 238, 121743. doi:10.1016/j.eswa.2023.121743
Nguyen, T. T., Nguyen, T. T., and Pham, T. D. (2022b). Finding optimal solutions for reaching maximum power energy of hydroelectric plants in cascaded systems. J. Ambient. Intell. Humaniz. Comput. 13, 4369–4384. doi:10.1007/s12652-021-03361-z
Ruiz, C., Conejo, A. J., and Smeers, Y. (2012). Equilibria in an oligopolistic electricity pool with stepwise offer curves. IEEE Trans. Power Syst. 27, 752–761. doi:10.1109/tpwrs.2011.2170439
Sun, W., Liu, W., Xiang, W., and Zhang, J. (2022). Generalized energy storage allocation strategies for load aggregator in hierarchical electricity markets. J. Mod. Power Syst. Clean. Energy 10, 1021–1031. doi:10.35833/mpce.2020.000737
Tang, Q., Guo, H., and Chen, Q. (2022). Multi-market bidding behavior analysis of energy storage system based on inverse reinforcement learning. IEEE Trans. Power Syst. 37, 4819–4831. doi:10.1109/tpwrs.2022.3150518
Wang, C., Wei, W., Wang, J., Liu, F., and Mei, S. (2018). Strategic offering and equilibrium in coupled gas and electricity markets. IEEE Trans. Power Syst. 33, 290–306. doi:10.1109/tpwrs.2017.2698454
Wang, H., Ligao, J., Wu, F., Yang, J., Zhu, X., Wan, L., et al. (2022). A multi-stakeholder potential game model in active distribution network considering the bounded rationality of small users. Front. Energy Res. 10. doi:10.3389/fenrg.2022.946799
Wang, J., Shahidehpour, M., and Li, Z. (2008). Security-constrained unit commitment with volatile wind power generation. IEEE Trans. Power Syst. 23, 1319–1327. doi:10.1109/tpwrs.2008.926719
Xiao, J., Meng, Y., Li, L., Fan, S., He, G., and Li, Z. (2024). “Collaborative optimization operation of zero marginal-cost renewable energy and flexible resources facilitated by fair regulation responsibility,” in 2024 4th International Conference on Power Grid Systems and Green Energy, Xiamen, China, January 05-07, 2024.
Xiao, J., He, G., Fan, S., and Li, Z. (2022). Substitute energy price market mechanism for renewable energy power system with generalized energy storage. Appl. Energy 328, 120219. doi:10.1016/j.apenergy.2022.120219
Xiao, J., He, G., Fan, S., Zhang, S., and Wu, Q. (2020). Decentralized transfer of contingency reserve: framework and methodology. Appl. Energy 278, 115703. doi:10.1016/j.apenergy.2020.115703
Xiao, J., He, G., Zhou, H., Zhang, S., and Wang, Z. (2019). Decentralized transfer of contingency reserve: concept, benefit assessment, impacting factors, and benefit mechanism. Appl. Energy 255, 113728. doi:10.1016/j.apenergy.2019.113728
Yang, H., Tian, X., Liu, F., Liu, L., Li, L., and Wang, Q. (2024). A multi-objective dispatching model for a novel virtual power plant considering combined heat and power units, carbon recycling utilization, and flexible load response. Front. Energy Res. 11. doi:10.3389/fenrg.2023.1332474
Yang, Y., Bremner, S., Menictas, C., and Kay, M. (2018). Battery energy storage system size determination in renewable energy systems: a review. Renew. Sustain. Energy Rev. 91, 109–125. doi:10.1016/j.rser.2018.03.047
Ye, H., Ge, Y., Shahidehpour, M., and Li, Z. (2017). Uncertainty marginal price, transmission reserve, and day-ahead market clearing with robust unit commitment. IEEE Trans. Power. Syst. 32, 1782–1795. doi:10.1109/tpwrs.2016.2595621
Zeynali, S., Nasiri, N., Ravadanegh, S. N., and Marzband, M. (2022). A three-level framework for strategic participation of aggregated electric vehicle-owning households in local electricity and thermal energy markets. Appl. Energy 324, 119749. doi:10.1016/j.apenergy.2022.119749
Zhang, J., Qiu, W., Zhang, Z., Lin, Z., Ding, Y., Wang, Y., et al. (2023a). Optimal bidding strategy and profit allocation method for shared energy storage-assisted VPP in joint energy and regulation markets. Appl. Energy 329, 120158. doi:10.1016/j.apenergy.2022.120158
Zhang, T., Chen, C., Ma, L., Chen, T., Wei, Y., Lin, Z., et al. (2023c). Multi-step clustering and generalized Nash Bargaining-based planning strategy of community-shared energy storage for large-scale prosumers. IEEE Trans. Sustain. Energy. early access, 1–14. doi:10.1109/TSTE.2023.3323337
Zhang, T., Li, H., and Xie, B. (2022). Have renewables and market-oriented reforms constrained the technical efficiency improvement of China's electric grid utilities? Energy Econ. 114, 106237. doi:10.1016/j.eneco.2022.106237
Zhang, W., Chen, Y., Wang, Y., and Xu, Y. (2023b). Equilibrium analysis of a peer-to-peer energy trading market with shared energy storage in a power transmission grid. Energy 274, 127362. doi:10.1016/j.energy.2023.127362
Keywords: electricity market, strategic behavior, renewable energy, private energy storage, equilibrium problem with equilibrium constraints (EPEC)
Citation: Xiao J, Meng Y, Li L, Fan S, He G and Li Z (2024) Market equilibrium with strategic pricing and strategic constraints in renewable energy: the role of private energy storage. Front. Energy Res. 12:1346528. doi: 10.3389/fenrg.2024.1346528
Received: 29 November 2023; Accepted: 27 February 2024;
Published: 21 March 2024.
Edited by:
Shengyuan Liu, State Grid Zhejiang Electric Power Co., Ltd., ChinaReviewed by:
Minh Quan Duong, University of Science and Technology, The University of Danang, VietnamYunqi Wang, Monash University, Australia
Copyright © 2024 Xiao, Meng, Li, Fan, He and Li. This is an open-access article distributed under the terms of the Creative Commons Attribution License (CC BY). The use, distribution or reproduction in other forums is permitted, provided the original author(s) and the copyright owner(s) are credited and that the original publication in this journal is cited, in accordance with accepted academic practice. No use, distribution or reproduction is permitted which does not comply with these terms.
*Correspondence: Guangyu He, Z3loZUBzanR1LmVkdS5jbg==