 Liqiang Wang1
 Hongqing Liu
 Yujin Ding
 Xiuxian Zheng
- 1Inner Mongolia Power Research Institute Branch, Inner Mongolia Power (Group) Co., Ltd., Hohhot, China
- 2Information and Electrical Engineering College, China Agricultural University, Beijing, China
- 3Electrical Engineering College, Sichuan University, Chengdu, China
In the context of energy transition and carbon neutrality strategies, distributed renewable energy is widely emerging on the distribution side. However, due to the volatility and randomness characteristics of distributed renewable energy, its full absorption poses a huge challenge to the economy and stable operation of the power grid. Flexible resources on the demand side, represented by air conditioners and electric vehicles, can participate in grid dispatching, improving the economic efficiency and reliability of system operation. To this end, this paper proposes an intraday dispatch strategy for demand-side flexible resources based on two-stage optimization. First, based on a generalized energy storage model, the adjustable flexibility of demand-side flexible resources is modeled. Second, to hinder the uncertainties related with markets and demand-side flexible resources, the rolling optimization is adopted for the optimal bidding, thus enabling demand-side flexible resources to participate in the intraday market with low risks of profit losses. Third, based on the bidding decision, real-time dispatch optimization is carried out to cope with the system operation deviation caused by forecast errors. Then, in the real-time control stage, the dispatch instructions are decomposed to the control units to achieve power tracking. Finally, the proposed method is simulated and verified on a test system. The results show that by coordinating the operation of demand-side flexible resources through two-stage optimization, the uncertainties of renewable energy output, market price, etc. Can be effectively overcome, and the economics of system operation can be improved.
1 Introduction
With the widespread rise of distributed renewable energy in the distribution and utilization side, the existing energy and power scale production and long-distance transmission gradually to distributed/centralized production/utilization coexist transformation, powerfully promoted the implementation of “energy transition” and “carbon neutral” strategy (Naval and Yusta, 2021). However, due to the volatility and randomness characteristics of distributed renewable energy, its full absorption to the power grid economy, stable operation brings huge challenges (Ali et al., 2017). With the steady progress of low-carbon energy transformation and power market reform, the personalized development of user-side demand, the mature application of distributed energy technology and the significant deepening of distribution network application scenarios have been promoted, and the penetration rate of flexible resources in the power system has been continuously improved. Promote the participation of flexible resources in power system operation and power market Trading is a catalyst for realizing the flexible and stable operation of power system, the industrialization of distributed resources, the optimization of energy supply structure and the improvement of comprehensive energy efficiency. With the development of smart grid and the increase of flexibility demand, the flexibility resources of the grid-load-storage side have been further utilized to participate in the optimal operation and scheduling of the system. The flexibility resources on the power grid side include dynamic line expansion, flexible transmission, interconnection, etc. (Kornrumpf et al., 2016); Load-side flexibility resources include electric vehicles, invitation-based demand response, and auction-based demand response (Heleno et al., 2015); The flexibility resources on the energy storage side include pumped storage, electric energy storage, and other forms of energy storage (heat, hydrogen) (Denholm, 2012).
With air conditioning, electric vehicles as representatives of the demand side flexible resources output/power consumption in a certain range is flexible and adjustable, can be used as. Considering the demand side flexible resources present small-scale, decentralized and heterogeneous characteristics, the power grid needs to rely on aggregation means and coordination optimization strategy to give full play to its flexible response potential (Saboori et al., 2011). However, it is difficult to measure and use the flexibility of a large number of distributed systems, especially due to the computational complexity. To make the most of the existing flexibility and lower the complexity of planning, trading and control, it is essential to compute the total flexibility of the whole system group and express it in a brief and compact form. Many studies have emphasized the importance of aggregation as a key factor for integrating a large number of flexible systems. The role of collecting, aggregating and controlling the flexibility of a group of systems is played by an entity called an aggregator. The aggregator signs contracts with individual flexible energy resources, defining the communication and control mode between the system and the aggregator, the specific details of the flexibility offered by the system, and how to reward the flexibility offered by the system. Therefore, the aggregator acts as a mediator between flexible resources and wholesale markets, shaping individual flexibility into tradable products.
On the basis of flexibility resource aggregation, there are many literature on its participation in optimization operation scheduling. Literature (Ju et al., 2016) studies how renewable energy generation and electricity price prediction error affect the market, and proposes a bidding strategy for demand-side flexibility resources to participate in four different markets at the same time: bilateral contract market, intraday market, real-time market and balancing market; literature (Pourghaderi et al., 2018) exploits the feature that the uncertainty of random variables decreases as the time horizon gets closer, and develops a joint optimization model that accounts for the demand-side flexibility resources’ bidding profit in the intraday market and the expected reward and penalty in the balancing market, offering insights for demand-side flexibility resources to join in different time-scale market transactions; literature (Xu et al., 2017) presents a stochastic scheduling model for demand-side flexibility resources based on demand response, applies conditional value-at-risk theory to capture the uncertainty faced by the power grid, and enhances the operation revenue of demand-side flexibility resources through multi-link coordinated scheduling of “source-load-storage”; literature (Riveros et al., 2015) uses multi-scenario method to simulate the uncertainty of intraday market clearing price and wind power output, and improves the output stability through coordinated complementarity of demand-side flexibility resources; literature (Hu et al., 2020) Group management can interrupt the adjustment capacity of load in response to short-time scale fluctuations in net load (the difference between load and new energy output). Literature (Yan et al., 2022) develops a model of transferable electric load and alternative load response for the park integrated energy system, and further develops an adjustable heat load response model, which is then incorporated in the optimization operation scheduling verification, which can improve the operating economy and flexibility of the system; literature (Ben et al., 2020) quantifies the adjustment flexibility of interruptible loads based on load aggregators, makes interruptible have different response times according to the nature of load aggregators, and then increases the absorption ratio of wind power through day-to-day optimization. Literature (Chen et al., 2018) proposed a real-time optimization scheduling strategy based on a two-stage linear model, which partitions the operating state space of the microgrid according to the load condition, the state of charge of the energy storage system, the state of charge of the energy storage system, and the operating period of the next scheduling period under two operating modes: grid-connected and independent. The corresponding real-time scheduling strategy is studied. Literature (Yu et al., 2022) constructed a microgrid model considering electric vehicles, and considered the uncertainty of electric vehicles, and constructed a real-time energy scheduling model for microgrids based on a Markov chain Monte Carlo algorithm for electric vehicle behavior probability. Some studies only consider intraday optimization (Hosseinnezhad et al., 2016; Li et al., 2019), literature (Li et al., 2021) starts from the perspective of power users, comprehensively considers the economy of microgrid operation and user satisfaction, and establishes an intraday optimization scheduling model to optimize user satisfaction. The model can formulate corresponding scheduling schemes according to different user needs. Literature (Yang et al., 2018) takes an independent microgrid as the research object, constructs a flexibility deficiency rate index, and then establishes an intraday optimization scheduling model for microgrids with the lowest operating cost and flexibility deficiency rate of microgrids within a day as the optimization objectives. The optimization results enhance the resilience of microgrids to uncertainty (Pan et al., 2015). Literature (Chen et al., 2019) proposes a multi-time-scale coordinated scheduling method. This method is based on model predictive control. The optimization objective of the intraday scheduling stage is to minimize the system’s overall operating cost, taking into account the peak-valley electricity prices, the battery life, and the randomness of wind and solar power. An intraday economic dispatch model is constructed. A model predictive control-based intra-day rolling optimization correction strategy is proposed in the intra-day scheduling stage to optimize the power fluctuations on the interconnection line and reduce them. Literature (Xie et al., 2019) introduces blockchain technology into microgrid scheduling, and combines it with multi-time-scale scheduling methods to apply it to microgrid optimization scheduling, thereby achieving economic and secure microgrid scheduling with decentralized capabilities. The optimization results show that this scheduling strategy can accurately obtain data from various power generation devices in the network, and correct the predicted information according to the real-time state information of the microgrid, greatly improving the accuracy of prediction. And relying on blockchain technology, it can more securely protect scheduling information. The above studies have achieved good results in modeling and analysis of uncertainty factors such as wind and light resources, load, electricity price, etc., but most of them adopt the traditional single-section open-loop optimization method with refined time scale, which is difficult to accurately reflect the impact of renewable energy, load prediction error and unplanned instantaneous power fluctuation on the coordination and control of demand-side flexible resources. The internal equipment modeling also lacks consideration of coupling between different time sections, which restricts the optimization results to guide practical operation scheduling to some extent.
Utilizing the flexibility of demand side resources (DSR) can significantly improve the economic efficiency and reliability of distribution system operations. In order to accurately characterize the dispatching potential of DSR, a geometric polytope method is employed (Wang et al., 2021), satisfying the inherent conditions of DSR and delineating the feasible power and energy regions. Literature (Bao et al., 2024) have proposed an aggregate model for DSR, utilizing aggregated parameters to represent energy and power constraints based on the DSR’s travel patterns. Literature (Ren et al., 2023) have introduced an equivalent time-variant storage model to describe the flexible demand aggregated from DSR. While this method provides a more precise model for aggregated DSR, it fails to consider the inherent uncertainties associated with DSR, rendering it less reliable in practical applications. To address these uncertainties, the distributional robust chance constrained (DRCC) approach emerges as an efficient method, striking a balance between conservatism and computational efficiency compared to robust optimization and stochastic optimization (Zhong et al., 2021), respectively. However, constructing reasonable robust sets in DRCC hinders its effective applications in DSR management.
A detailed comparison between this study and other similar recent works is provided in Table 1 to demonstrate the novelty of this study. Compared with other works, the contributions of this paper can be concluded as:
1) The generalized energy storage model is used to model the adjustable flexibility of demand-side flexible resources;
2) The optimal bidding decision for demand-side flexible resources to join the intraday market is made based on rolling optimization, which utilizes rolling updates to reduce the risks of profit losses cause by uncertainties related with markets and DSRs;
3) Based on the bidding decision, real-time scheduling optimization is carried out to cope with the system operation deviation caused by prediction error;
4) In the real-time control stage, the scheduling instructions are decomposed to the control units to achieve power tracking;
5) The proposed method is simulated and verified on the test system, and the results show that by coordinating the operation of demand-side flexible resources through two-stage optimization, the variability of renewable energy production, market price, etc. Can be effectively overcome, and the system operation economy can be improved.
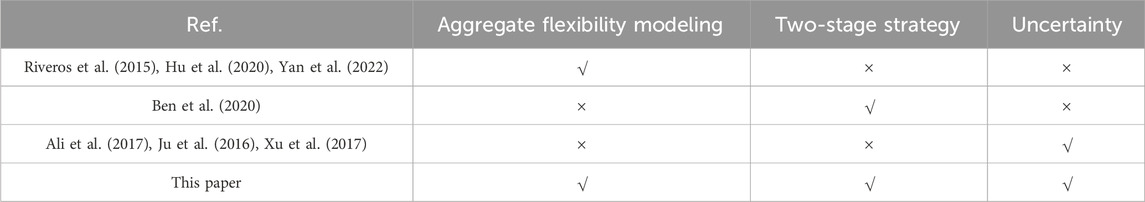
Table 1. Literature review table.
2 Modeling of the flexibility of demand-side adjustable resources
The share of flexible loads in the current power system is growing, and their flexibility and dispatchability can achieve energy time shift. For demand-side flexible resources such as electric vehicles and air conditioners, which have time-dependent features, they show the same charge, discharge, and storage characteristics as energy storage. Therefore, this paper broadens the concept of energy storage and refers to all devices and measures that can alter the spatiotemporal distribution of energy as generalized energy storage, including actual devices such as electricity storage, heat storage, hydrogen storage, etc., demand-side reaction and control, electric vehicle charge and discharge management, etc., and employs a generalized energy storage model to describe the flexibility of demand-side resources such as electric vehicles and air conditioners. In the generalized energy storage model, taking into account that electric vehicles, air conditioners and other types of loads have to satisfy the user’s comfort constraints during operation, we use time-varying power and energy boundaries to replace the fixed boundary parameters of the traditional energy storage model. Based on the generalized energy storage model to characterize individual devices, we obtain the aggregated flexibility model of demand-side flexible resources by calculating the geometric center of all device parameters.
2.1 Generalized energy storage model
First, we introduce the generalized energy storage model, which includes the energy storage state change equation, energy constraints and power constraints:
In the formula:
2.2 Electric vehicle
Electric vehicles, as a kind of energy storage device, can carry out bidirectional energy transmission with the power system, which can consume electric energy as a load, and also provide electric energy for the power system by discharging to the grid. For a wide range of load aggregators, electric vehicles, as a special kind of electric load, are no different from ordinary electric loads in terms of power demand measurement and statistics. But electric vehicles have their special load characteristics and uncertainties caused by the user habits of car owners. The data that load aggregators need to pay attention to when managing them include the departure and arrival time of electric vehicles, charging and discharging time, contract parameters signed with aggregators, etc. It is also important to consider the physical characteristics of electric vehicle batteries, which can be illustrated from a technical perspective by the constraint conditions of mathematical models.
2.2.1 Energy boundaries
For each electric vehicle, in order to meet the user’s charging demand, the upper and lower limits of its energy at each moment should be calculated (Hao et al., 2017). The upper limit of energy is calculated based on the fastest charging trajectory, while the lower limit of energy is calculated based on the slowest charging trajectory:
Where formula (2a) represents the upper limit of the electric vehicle’s power at each moment; formula (2b) represents the power curve corresponding to the electric vehicle charging from the lowest power to the target power when leaving the station; formula (2c) represents the power curve corresponding to the electric vehicle discharging to the lowest power after arriving at the station; formula (2d) represents the lower limit of the electric vehicle’s power at each moment, which can be calculated by the lower limit of the electric vehicle’s power at each moment. In the formula:
2.2.2 Power boundary
For each electric vehicle, its charging and discharging power limits are subject to both energy and rated power constraints. They are calculated based on the plug-in states of EVs:
Where formula (3a) represents the upper limit of the electric vehicle’s power, and formula (3b) represents the lower limit of the electric vehicle’s power. In the formula:
2.2.3 Energy changes
According to the electric vehicle’s station status, initial power when entering the station and final power when leaving the station, the transfer power caused by the electric vehicle leaving or entering the station can be calculated:
In the formula:
2.3 Air conditioning
With the application of communication control technology in smart homes such as smart air conditioners, air conditioning can become a controllable load with flexible and controllable working hours, wide distribution, and easy scheduling. Dispatchers can change the frequency of use of controllable loads at peak times according to the daily peak electricity consumption or users according to real-time electricity price changes, so as to reduce the transmission pressure of the distribution system during peak hours. The purpose of implementing demand-side management is to optimize grid dispatch without affecting the user experience of power users. Adjustable loads, such as central air conditioning load, decorative lamp load, etc., participate in microgrid demand response dispatch by adjusting the load power consumption. When time-of-use electricity prices are high, these loads can be reduced by reducing load power to lower levels of electricity consumption. Based on their electricity comfort, microgrid users set electricity price thresholds and power adjustment levels to participate in grid demand response. When the hourly real-time electricity price is above the price threshold, the consumption level of the load is reduced to the power level set by the user.
2.3.1 Minimum temperature deviation - reference power
In order to obtain the reference power of a single air conditioner, taking the minimum temperature deviation as the objective, considering the user comfort constraint and the building room temperature dynamic equation, an optimization model is established (Zhao et al., 2017). The reference power of a single air conditioner means the power required to maintain the room temperature at the user’s set temperature.
Where, (5a) represents the optimization objective, i.e., the deviation of indoor temperature from user temperature setting value; (5b)-(5e) represent the constraints of the optimization model, where, (5b) represents the discrete form of temperature change equation, (5c) represents the indoor temperature constraint, (5d) represents the maximum and minimum temperature acceptable by the user, (5e) represents the power constraint. In the formula:
2.3.2 Max, min power—power boundary
In order to obtain the maximum/minimum power limit value of a single air conditioner, respectively taking the minimum or maximum power consumption at each moment as the objective, an optimization model is established. The maximum/minimum power limit denotes the maximum/minimum power consumption of the air conditioner without violating the temperature constraints.
After obtaining the minimum or maximum power consumption at each moment, subtracting the reference power can obtain the upper and lower bounds of the adjustable power of the aggregation model:
In the formula:
2.3.3 Maximum and minimum temperature-energy boundary
When the state of the aggregation model is at the upper and lower bounds of energy, it is considered that the indoor temperature is at the boundary of the user acceptable range. Therefore, when calculating the energy boundary of the aggregation model, an optimization model is established with the minimum deviation value between the indoor temperature and the maximum/minimum acceptable temperature as the objective:
After obtaining the power values
In the formula:
2.4 Aggregated flexibility modeling
Aggregated flexibility modeling is a method applied in the power sector to coordinate and optimize the scheduling of flexibility resources. Flexibility resources are devices or users that can adjust their electricity consumption or generation levels within a certain range, such as energy storage, renewable energy sources, demand response, etc. The purpose of aggregated flexibility modeling is to combine dispersed flexibility resources into a virtual large-scale flexibility resource, to improve its ability to participate in market transactions and grid services.
When performing aggregated flexibility modeling, we obtain the parameters of the aggregator by directly summing or weighted averaging the parameters of the generalized energy storage model corresponding to individual devices.
In the formula:
2.5 Aggregated power decomposition strategy
The aggregated resources are composed of multiple control units (such as EV, HVAC and ESS) that can adjust their power consumption or generation according to external commands. In order to achieve optimal operation of the aggregated resources, it is necessary to determine a power plan that meets the demand response requirements and minimizes the operation cost. This power plan is called the aggregated power, which represents the total power consumption or generation of all control units in a given time period. However, the aggregated power alone cannot specify how each control unit should adjust its power. Therefore, after determining the aggregated power, a further step is needed to decompose it into individual control commands for each control unit. This step is called power decomposition, which aims to distribute the aggregated power among different control units in a fair and efficient way. Power decomposition is a challenging problem because it involves many factors, such as the real-time operating status, operating constraints, preferences and costs of each control unit. Moreover, it needs to be solved in a short time to meet the real-time control needs. Therefore, a heuristic algorithm is proposed to solve the power decomposition problem. The algorithm works as follows:
1) Collect the real-time operating status of each control unit, such as its current power consumption or generation, state of charge (SOC), temperature, etc.
2) Calculate the upper and lower limits of the power of each control unit according to their operating constraints, such as maximum and minimum power, SOC range, comfort range, etc.
3) Set the initial allocation value of each control unit to the average of the upper and lower limits of the power. This value represents a fair and feasible initial solution for power distribution.
4) Calculate the remaining power to be allocated according to the initial allocation value of each control unit. The remaining power is equal to the difference between the aggregated power and the sum of the initial allocation values.
5) Allocate the remaining power according to the proportion of the power up or down capability of each control unit in all control units. The power up or down capability reflects how much each control unit can increase or decrease its power from its initial allocation value. The proportion is calculated by dividing the individual capability by the total capability. This way, the remaining power is distributed in a proportional and efficient way.
3 Two-stage optimization strategy
For the intraday dispatch of demand-side flexible resources, we propose a two-stage optimization strategy, in which the first stage optimizes the bidding decision of demand-side flexible resources to join the intraday market based on rolling optimization, and the second stage carries out real-time dispatch optimization to cope with the system operation deviation caused by forecast errors. The multi-time scale characteristic of flexibility demand lies in the decrease in prediction accuracy with time, and the multi-time scale characteristic of flexibility resources lies in the trend of flexibility supply output changing with time (Du et al., 2023). Figure 1 shows the collaborative optimization framework for multi-flexible resources. It is noted that this paper assumes that end-users are willing to participate in scheduling and automatically respond to control signals in order to receive monetary rewards from the aggregator, which is consistent with many studies (Yi et al., 2021; Du et al., 2023).
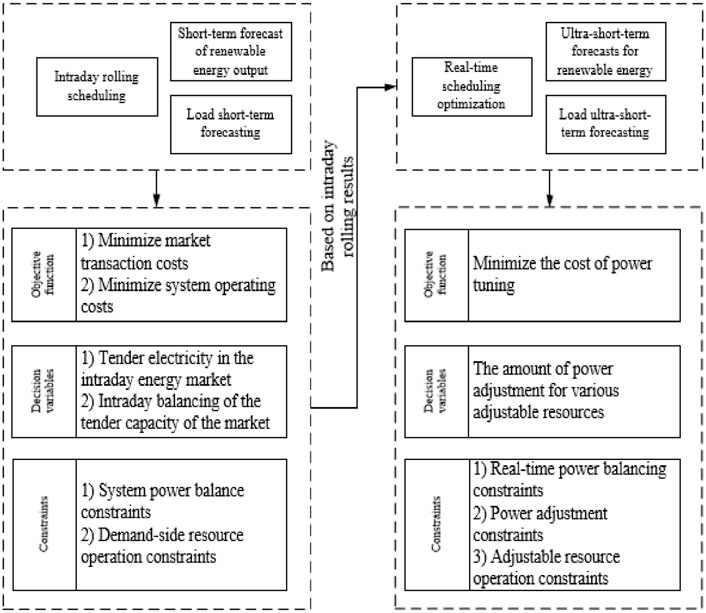
Figure 1. Two-stage optimization framework for demand-side resources.
3.1 Stage I: rolling optimization of intraday market bidding
In order to adapt to the changes in the intraday operating conditions, the rolling optimization scheduling model can dynamically adjust and control the demand-side flexible resources according to the real-time market prices, load forecasts, renewable energy output and other information, and revise and update the intraday scheduling plan. The rolling optimization scheduling model is divided into three sub-layers according to the differences in the scheduling time of electricity, cooling/heating and gas, which can improve the system’s flexibility and economy. The rolling optimization scheduling model adopts the predictive control method, which uses the predictive model and the system’s historical data and future input to predict the system’s future output, and optimizes it through a certain performance indicator within a rolling limited time interval, and obtains feedback correction control. The rolling optimization scheduling model is different from the traditional global optimization, which only optimizes the performance indicator for a limited time from that moment at each moment, and to the next moment, this optimization time moves forward at the same time, constantly performing online optimization. At each moment, a group of future control actions are obtained, but only the control action at this moment is implemented. At the next moment, a group of new controls are re-predicted and optimized, which is also only implemented with a new control action. Every step is feedback correction. The rolling optimization scheduling model can be applied to the power system with wind power and other renewable energy sources. By transforming the objective function and constraint conditions into state space, the rolling scheduling problem is transformed into a matrix form of optimization problem, and a multi-unit multi-prediction period rolling optimization scheduling mathematical model is established. This model can effectively suppress the fluctuation of wind power output on system operation, and improve system security and reliability. The scrolling optimization diagram is shown in Figure 2.
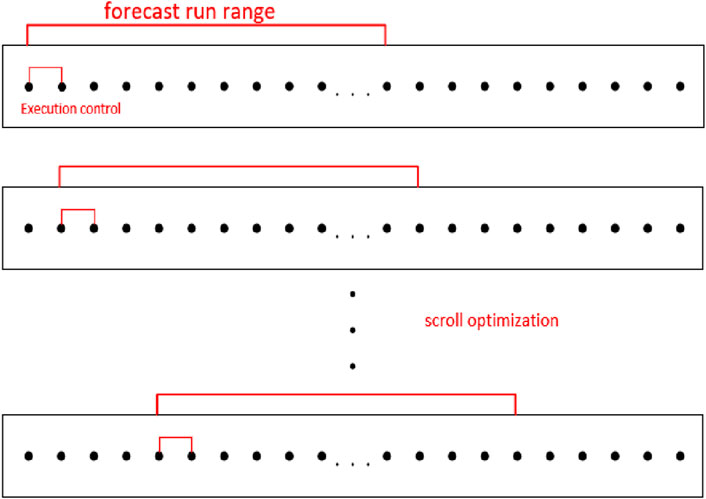
Figure 2. Scroll optimization diagram.
In order to improve the system operation efficiency and economy, the system operator can use the flexibility of demand-side resources to carry out arbitrage operations in the spot market. Arbitrage operation refers to the behavior of buying low and selling high or selling high and buying low in different markets or different time periods, using price differences, and thus obtaining benefits. Due to the large uncertainty and randomness of the energy consumption behavior of demand-side resources, which are affected by user preferences, environmental temperature, equipment status and other factors, and the large error of intraday prediction, this paper only studies the bidding strategy of demand-side resources in the intraday market. The intraday market refers to the power market conducted on the trading day, which is usually divided into energy market and balance market. The energy market refers to the market with electricity as the trading object, and the balance market refers to the market with capacity as the trading object, which is mainly used to regulate the real-time supply and demand balance of the system. In order to optimize the bidding strategy, we establish a rolling optimization model with a step length of 1h, which is executed every 1h, and as time goes by, the optimization cycle gradually shortens. Each optimization will produce a decision sequence corresponding to the current moment to the end moment, but only submit the first decision of the decision sequence to the market as the bidding decision. The purpose of doing this is to dynamically adjust and correct according to real-time information, and improve the accuracy and flexibility of bidding decisions. The objectives of this optimization model include: 1) minimizing market transaction costs; 2) minimizing system operation costs. Among them, market transaction cost refers to the cost incurred by demand-side resources in buying or selling electricity in the energy market and balance market, and system operation cost refers to the energy cost consumed by demand-side resources in meeting user demand and system constraints. The optimization decision variables are the bidding electricity in the intraday energy market and the bidding capacity in the balance market, and the constraints considered include system power balance constraint and demand-side resource operation constraint. The specific optimization model can be expressed as:
In the formula:
3.2 Stage II: real-time dispatch optimization
Real-time scheduling optimization refers to selecting appropriate scheduling algorithms and strategies based on the task information in the real-time system, such as deadlines, priorities, resource requirements, etc., to ensure that the system can complete various real-time tasks in a timely manner. Real-time scheduling optimization has two methods: static scheduling and dynamic scheduling. Static scheduling means determining the execution order of tasks in advance, while dynamic scheduling means deciding the execution order of tasks dynamically according to the actual situation. The purpose of real-time scheduling optimization is to improve the system’s timeliness, reliability and efficiency, and avoid system failures or disasters caused by task timeouts. The difficulty of real-time scheduling optimization lies in how to balance the system’s indicators such as throughput, response time, resource utilization, etc., and how to deal with the uncertainty factors of the system, such as task arrival time, processing time, interrupt occurrence time, etc.
On the one hand, the rolling optimization of intraday market bidding is based on the renewable energy output and load forecast information 1h ago, so the bidding decision will cause system operation deviation due to the existence of forecast error; on the other hand, the resolution of the bidding decision is 1h, while the operation status of devices such as air conditioners and electric vehicles is changing rapidly, and they must be dispatched at shorter time intervals. Therefore, based on the first stage optimization, we carried out the second stage optimization, i.e., real-time dispatch optimization. The step size of real-time dispatch optimization is 15min, and the optimization period is 1h. The objective of real-time dispatch optimization is to minimize the cost of power adjustment, the decision variable is the power adjustment amount of various adjustable resources, and the constraints include real-time power balance constraint, power adjustment amount constraint, adjustable resource operation constraint. The specific optimization model is:
In the formula:
3.3 Algorithm flow
The overall flow of the algorithm is shown in Figure 3. First, the adjustable flexibility of demand-side flexible resources is modeled based on a generalized energy storage model. Then, the optimal bidding decision for demand-side flexible resources to participate in the intraday market is made based on rolling optimization. Next, based on the bidding decision, real-time dispatch optimization is carried out to cope with the system operation deviation caused by forecast errors. Finally, in the real-time control stage, the dispatch instructions are decomposed to the control units to achieve power tracking.
1) Establish a storage model for demand-side flexible resources. This model can describe the power, energy, state and constraints of demand-side flexible resources, reflecting their adjustable flexibility range. This model can be used to evaluate the potential value and risk of demand-side flexible resources.
2) Optimize the bidding of demand-side flexible resources in the intraday market. This optimization problem is a stochastic programming problem, considering the impact of uncertain factors such as market price, load forecast, renewable energy forecast, etc., as well as the constraints of the storage model and market rules of demand-side flexible resources. The objective function is to maximize the expected income of demand-side flexible resources. By using a rolling optimization method, the bidding decision can be dynamically updated to adapt to market changes.
3) Optimize the real-time dispatch of demand-side flexible resources. This optimization problem is a robust programming problem, considering the possible prediction errors and system deviations in actual operation, as well as the constraints of the storage model and dispatch rules of demand-side flexible resources. The objective function is to minimize the system operation cost and deviation penalty. By using a real-time optimization method, the dispatch plan can be timely adjusted to improve the system operation stability.
4) Decompose the real-time control of demand-side flexible resources. This process is to decompose the dispatch plan to each control unit, such as air conditioners, electric vehicles, energy storage devices, etc., and make them execute power control according to the dispatch instructions. This process needs to consider the characteristics and communication delay of control units, and ensure the power tracking accuracy and control effect.
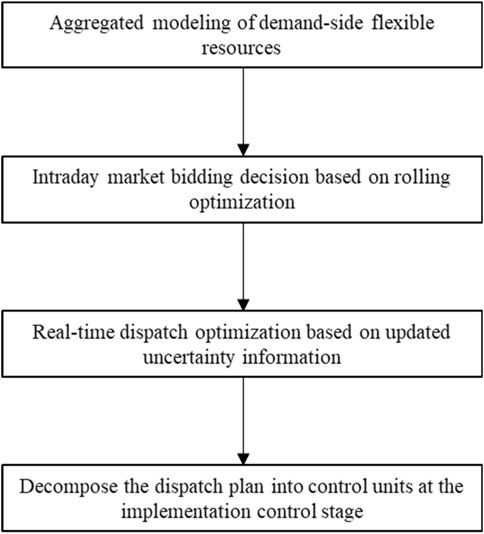
Figure 3. Algorithm flow chart.
The above optimization model belongs to a convex programming model, which can be solved efficiently with the help of commercial solvers (such as Gurobi, Cplex).
4 Example analysis
The proposed method was tested on the IEEE 15-bus distribution network, where the electric vehicle aggregator was located at node 5, the air conditioner aggregator was located at node 10, the energy storage aggregator was located at node 15, the wind farm was located at node 8, and the photovoltaic power station was located at node 12. The topology of the IEEE 15-bus distribution network is shown in Figure 4. The electric vehicle aggregator consisted of 500 electric vehicles, whose charging behavior was characterized by arrival/leaving time, rated power, initial/expected/minimum SOC and capacity. The arrival time and leaving time of electric vehicles followed Gaussian distribution. The air conditioner aggregator consisted of 500 air conditioners, with parameters including heat capacity, heat resistance, rated power, performance coefficient, temperature setting value and temperature dead zone. In order to simulate various user preferences and equipment specifications, the parameters of individual electric vehicles and air conditioners were sampled from probability distributions. The energy storage aggregator aggregated 200 residential energy storage systems. The parameters for EVs, TCLs and ESSs are given in Tables 2–4, respectively. The data of non-flexible loads and renewable generations in our simulation is all derived from the literature (Zheng et al., 2022).
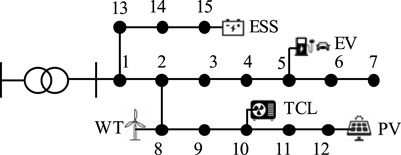
Figure 4. Topology of IEEE 15-bus distribution network.
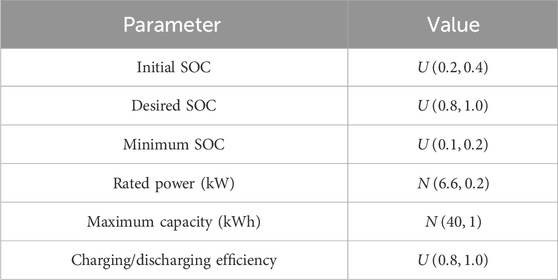
Table 2. EV Parameters.
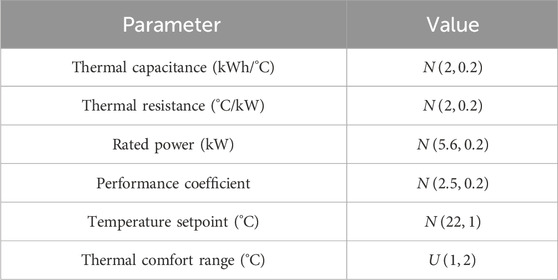
Table 3. TCL parameters.
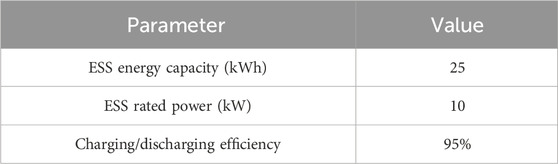
Table 4. ESS parameters.
Figure 5 shows intraday non-dispatchable resource power curve and market price curve for a typical day. Figure 5A illustrates the power curves of non-dispatchable load, PV and WT. Figure 5B illustrates the energy prices in intraday market, and regulation prices in balancing market.
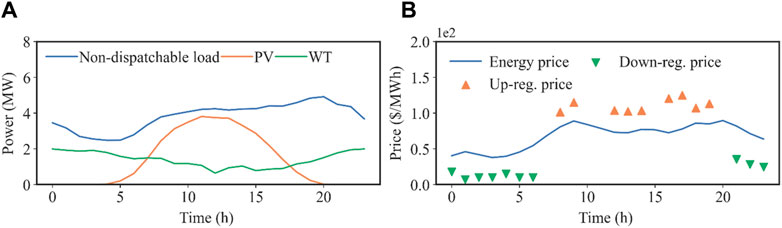
Figure 5. Typical intraday non-dispatchable resource power curve and market price curve. (A) Power profiles of non-dispatchable resources. (B) Price curves.
4.1 Stage I: rolling optimization of intraday market bidding
In stage I, aggregators play a pivotal role in shaping the energy landscape. They embark on a meticulous journey of decision-making, one that begins with the careful analysis of hour-ahead forecast data and the prevailing market prices for demand-side flexible resources. Armed with this critical information, they make calculated determinations regarding the quantity of energy to bid into the market. This collective effort culminates in the submission of consolidated bids, commonly referred to as Virtual Power Plant (VPP) bids, to both the energy market and the balance market. This strategic move is illustrated in Figure 6, which provides a visual representation of the intricate bidding decisions that transpire in this initial stage.
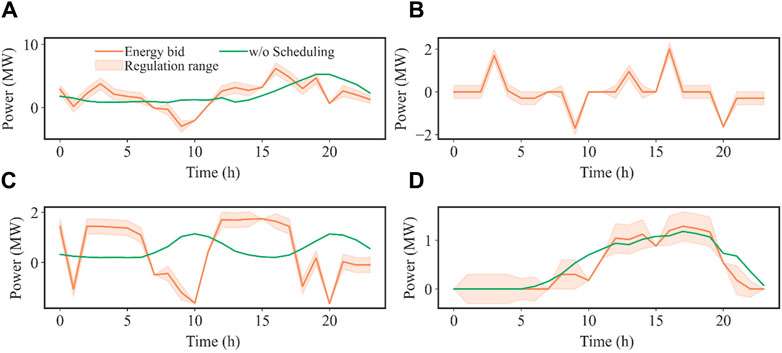
Figure 6. Aggregator Bid Decision (Phase 1). (A) Bidding decisions of the whole VPP. (B) Bidding decisions of BESS aggregator. (C) Bidding decisions of EV aggregator. (D) Bidding decisions of TCL aggregator.
In Figure 6, the green curve serves as a guidepost, representing the load baseline–a fundamental reference point. For instance, for an electric vehicle aggregator, its load baseline reflects the comprehensive power trajectory required to charge each electric vehicle to its maximum capacity at the highest possible power output. On the other hand, for an air conditioner aggregator, the load baseline aligns with the cumulative power trajectory necessary to maintain the indoor temperature of each room at the predefined set point. Comparing these load baselines with market dynamics unveils a fascinating strategy. When market prices soar, particularly during the periods from 9:00 to 13:00 and 22:00 to 24:00, all aggregators exhibit a remarkable shift in behavior–they either capitalize on surplus generation or significantly reduce their demand. However, when prices hit their lowest points, typically from 1:00 to 5:00, a unified decision emerges as all aggregators opt to increase their total demand.
Additionally, it is worth noting that each aggregator prudently sets aside a portion of its flexibility for a strategic purpose. This reserved flexibility is a valuable asset, as it enables aggregators to position themselves for pursuing higher profits in the intricate landscape of the balance market. The decisions made by these aggregators in this initial stage are nothing short of ingenious. They harness the inherent flexibility within demand-side resources to maximize their profits, providing an exemplar of how sophisticated market strategies can effectively manage and optimize energy resources, ultimately contributing to a more resilient and responsive energy ecosystem.
Therefore, in the first stage, aggregators can fully leverage the flexibility of demand-side resources, seamlessly transitioning between buying and selling roles. They strategically sell electricity when prices are high and purchase it when prices are low, thereby achieving arbitrage opportunities. Concurrently, they prudently reserve a portion of their flexibility to earn rewards for providing regulation services in the balance market.
4.2 Stage II: real-time dispatch optimization
To mitigate the deviations arising from prediction errors associated with non-dispatchable resources, a significant recalibration of power distribution occurs during the second stage of our approach, as depicted in Figure 7. In this stage, each aggregator fine-tunes its power allocation based on the original operational plan established in the first stage.
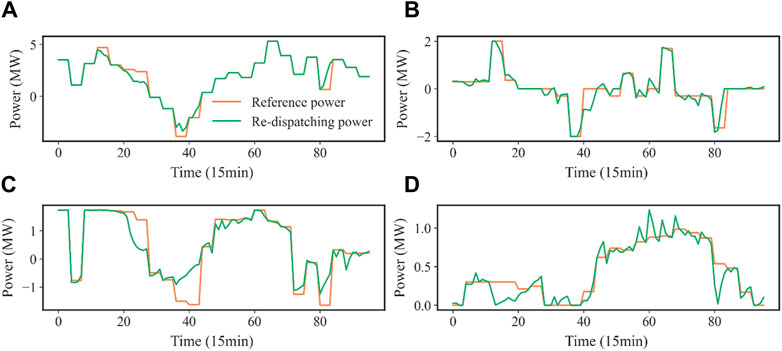
Figure 7. Aggregator Power Scheduling Decision (Phase 2). (A) Scheduling decisions of the whole VPP. (B) Scheduling decisions of BESS aggregator. (C) Scheduling decisions of EV aggregator. (D) Scheduling decisions of TCL aggregator.
As illustrated in Figure 7, each aggregator aligns its adjustments with the initial operational plan from the first stage. The magnitude of these adjustments is precisely opposite to the direction of deviation caused by the prediction error, and it closely matches the total prediction error magnitude. This deliberate adjustment strategy results in the remarkable cancellation of the majority of deviations stemming from prediction errors.
Consequently, the actual power consumption profiles of the aggregators closely align with the bidding quantity curve they initially submitted to the market. This synchronization between actual power consumption and market bids ensures that the deviations caused by prediction errors are effectively neutralized, contributing to a highly accurate and reliable power delivery system. The second stage serves as a crucial mechanism for achieving this synchronization, enhancing the overall performance and stability of the energy grid.
4.3 Test on IEEE 33-bus distribution network
To further validate the effectiveness of the proposed method, we conducted tests on a larger system. As shown in Figure 8, the test system is an IEEE 33-bus distribution network. Where the electric vehicle aggregator was located at node 12 and 30, the air conditioner aggregator was located at node 5 and 16, the energy storage aggregator was located at node 9 and 27, the wind farm was located at node 14 and 24, and the photovoltaic power station was located at node 21 and 32.
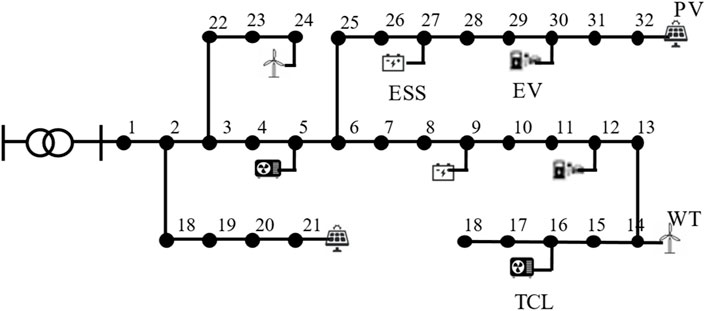
Figure 8. Topology of IEEE 33-bus distribution network.
Figure 9 shows the aggregated bidding curves of all aggregators. During the time period from 1:00 to 6:00, characterized by lower electricity prices, aggregators exhibit a tendency to increase their electricity purchases. Consequently, the purchased electricity quantity experiences a slight uptick when compared to the pre-optimization scenario. This strategic approach aligns with the objective of capitalizing on favorable pricing conditions to secure more power. Conversely, in the time frame from 20:00 to 24:00, where electricity prices are notably higher, aggregators lean towards reducing their electricity purchases or even selling excess power. As a result, the purchased electricity quantity significantly decreases in comparison to the pre-optimization state. This decision reflects the aggregators’ shrewd maneuvering in response to lucrative market conditions, as they aim to curtail expenses during peak pricing hours.
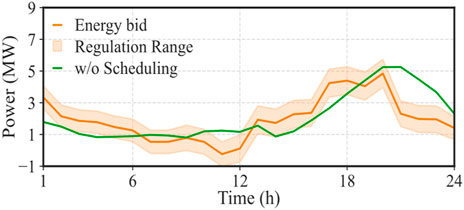
Figure 9. Aggregated bidding curves of all aggregators.
Figure 10 shows the dispatching results of aggregators. Compared to the 15-bus system, the 33-bus system encompasses a more extensive array of demand-side flexible resources. This increased diversity translates into a higher degree of system flexibility, bolstering its capability to contend with the fluctuations in renewable energy generation and load uncertainties. Consequently, in contrast to the 15-node system, the 33-node system exhibits a smaller disparity between the post-optimization total power curve and the reference power curve. This reduction in error signifies enhanced power tracking performance, ultimately leading to greater reliability in power delivery.
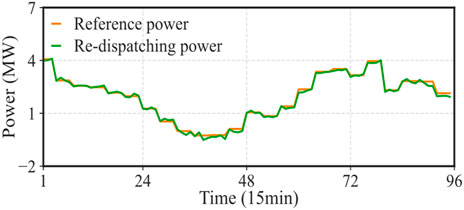
Figure 10. Dispatching results.
Figure 11 compares the tracking errors with and without dispatching conducted in stage II. It can be observed that the tracking errors caused by uncertainties of renewable generations and loads are greatly reduced with the help of aggregators’ coordination in stage II. Figure 11 provides a comprehensive view of tracking errors, offering a valuable perspective on the impact of aggregators’ collaborative efforts aimed at adjusting their respective power profiles in response to uncertainties. These uncertainties primarily stem from the unpredictability of renewable generation outputs and load variations. The remarkable reduction in tracking errors, as depicted in the figure, underscores the significance of aggregator cooperation when facing the challenges posed by these uncertainties. In essence, aggregators come together in stage II with the shared objective of achieving a more precise alignment between power generation and consumption. By harnessing their collective expertise and leveraging real-time data, aggregators enhance their ability to make dynamic adjustments in response to the ever-changing conditions of renewable energy generation and load patterns. This coordinated approach allows for a finer level of control over the power resources within the system. As a result, tracking errors are substantially curtailed, ensuring that the actual power generation and consumption closely follow the intended trajectories. This heightened level of precision not only bolsters the reliability of power delivery but also contributes to the overall resilience of the energy grid. In summary, Figure 11 serves as compelling evidence of the positive impact of aggregator collaboration in addressing the uncertainties associated with renewable energy and load fluctuations, ultimately leading to a more robust and dependable energy distribution system.
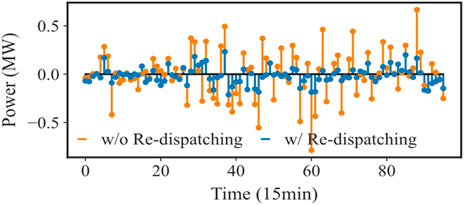
Figure 11. Tracking errors.
4.4 Algorithm comparison
In order to validate the efficiency of the proposed method and prove the superiority over other methods, this section compares the proposed method with another two methods. Method 1 (Ben et al., 2020) also adopts the two-stage scheduling framework, but utilizes explicit models for all individual DSRs. Method 2 adopts a simple aggregation model to represent the aggregate flexibility of DSRs, which ignores the time-coupling constraints of DSRs. All methods are evaluated based on the same simulation setup introduced at the beginning of section 4.
According to Table 5, the proposed method yields similar costs but achieves a 99.8% reduction in computation time compared to method 1. While method 1 employs explicit models regarding DSRs, allowing it to theoretically obtain optimal results compared to other methods, its computational complexity significantly increases with the number of DSRs. Consequently, the time required for solving the optimal dispatching time may exceed the limits of real-time operation. In contrast, the proposed method employs aggregation modeling to effectively reduce computational complexity. Additionally, it outperforms other aggregation-based methods. Method 2, due to substantial modeling errors stemming from disregarding the time-coupling constraints of DSRs, may produce dispatching plans that deviate significantly from the actual flexibility of DSRs. Consequently, method 2’s dispatching plans may lead to substantial tracking errors during disaggregation, resulting in significant imbalance penalties. Compared to method 2, the proposed method can achieve approximately a 20% reduction in total cost. In conclusion, the proposed method demonstrates improvements in both computational efficiency and cost-effectiveness.
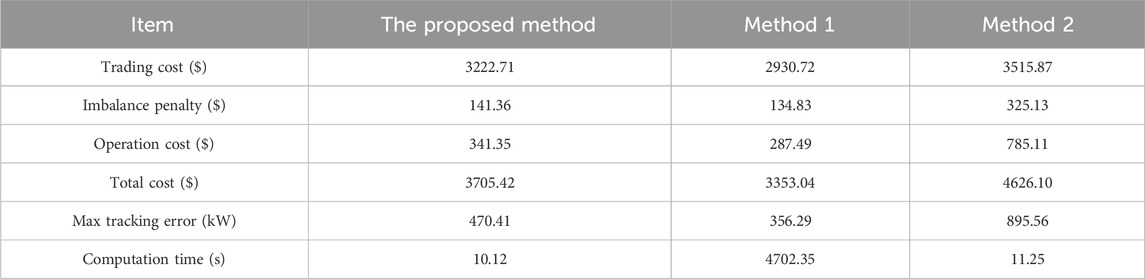
Table 5. Evaluation metrics comparison.
5 Conclusion
This paper proposes a two-stage optimization-based scheduling strategy for demand-side flexible resources participating in the intraday power market. The strategy consists of two stages: bidding optimization and real-time scheduling. In the bidding optimization stage, firstly, the generalized energy storage model is used to measure the adjustable flexibility of demand-side flexible resources, and describe their charge and discharge features and constraints; secondly, the rolling optimization method is used to optimize the bidding amount of demand-side flexible resources in the intraday market, so as to maximize their profits; in the real-time scheduling stage, firstly, the target output of demand-side flexible resources is determined according to the bidding optimization results; secondly, considering the impact of uncertain factors such as renewable energy production and market price, real-time scheduling optimization is carried out to minimize the system operation cost and deviation; then, the output commands of demand-side flexible resources obtained by real-time scheduling optimization are decomposed to each control unit, and power tracking is achieved by controllers; finally, through simulation verification on the test system, it is proved that the proposed two-stage optimization scheduling strategy can effectively coordinate the operation of demand-side flexible resources, overcome the interference of uncertainty, and improve the economic operation of the system.
Data availability statement
The raw data supporting the conclusion of this article will be made available by the authors, without undue reservation.
Author contributions
LW: Writing–original draft, Conceptualization, Methodology, Formal Analysis. HL: Writing–review and editing, Conceptualization, Funding acquisition, Resources, Supervision. QW: Writing–Original Draft, Software, Validation, Visualization. BC: Writing–Original Draft, Software, Validation. YC: Writing–Original Draft, Investigation, Resources. YD: Writing–Original Draft, Visualization. XZ: Writing–Original Draft, Software.
Funding
The author(s) declare financial support was received for the research, authorship, and/or publication of this article. This research was funded by Inner Mongolia Electric Power (Group) Co., Ltd. 2023 sci-entific project “Research on Large-scale Distributed Photovoltaic Grid Integration Oscillation Risks and Early Warning Methods” (Project No. 2023-5-28).
Conflict of interest
Authors LW, HL, QW, BC and YC were employed by Inner Mongolia Power (Group) Co., Ltd.
The remaining authors declare that the research was conducted in the absence of any commercial or financial relationships that could be construed as a potential conflict of interest.
The authors declare that this study received funding from Inner Mongolia Electric Power (Group) Co., Ltd. The funder had the following involvement in the study: data collection and analysis.
Publisher’s note
All claims expressed in this article are solely those of the authors and do not necessarily represent those of their affiliated organizations, or those of the publisher, the editors and the reviewers. Any product that may be evaluated in this article, or claim that may be made by its manufacturer, is not guaranteed or endorsed by the publisher.
References
Ali, S.-R., Ali, B., and Ali, Z. (2017). Day-ahead scheduling of virtual power plant in joint energy and regulation reserve markets under uncertainties. Energy 121, 114–125. doi:10.1016/j.energy.2017.01.006
Bao, Z., Hu, Z., and Mujeeb, A. (2024). A Novel electric vehicle aggregator bidding method in electricity markets considering the coupling of Cross-day charging flexibility. IEEE Trans. Transp. Electrification, 1. doi:10.1109/tte.2024.3359059
Ben, S. J., Hu, N., Han, W., Xie, M. C., Tang, N., and Wang, B. B. (2020). Two-stage optimization dispatching research of new energy power system considering demand response virtual power plant. Electr. demand-side Manag. 22 (01), 41–47.
Chen, L. J., Zhu, X., Xu, X. H., and Liu, H. X. (2019). Multi-time scale coordinated optimal dispatch of microgrid cluster based on MAS. Electr. Power Syst. Res. 177 (5), 105976. doi:10.1016/j.epsr.2019.105976
Chen, W. D., Liang, S., Xiao, Y. Y., and Guo, M. (2018). Real-time optimization dispatching method of microgrid based on two-stage linear model. Mod. Electr. Power 35 (05), 24–33. doi:10.19725/j.cnki.1007-2322.2018.05.004
Denholm, P. (2012). Energy storage to reduce renewable energy curtailment. 2012 IEEE Power Energy Soc. General Meet. 2012, 1–4. doi:10.1109/PESGM.2012.6345450
Du, S. P., Wu, D., Dai, Z., Li, G. Q., and Lahaxibai, S. (2023). Regional collaborative planning equipped with shared energy storage under multi-time scale rolling optimisation method. Energy 277 (5), 127680. doi:10.1016/j.energy.2023.127680
Hao, H., Wu, D., Lian, J., and Yang, T. (2017). Optimal coordination of building loads and energy storage for power grid and end user services. IEEE Trans. Smart Grid 9 (5), 4335–4345. doi:10.1109/tsg.2017.2655083
Heleno, M., Matos, M. A., and Lopes, J. A. P. (2015). Availability and flexibility of loads for the provision of reserve. IEEE Trans. Smart Grid 6 (2), 667–674. doi:10.1109/TSG.2014.2368360
Hosseinnezhad, V., Rafiee, M., Ahmadian, M., and Siano, P. (2016). Optimal day-ahead operational planning of microgrids. Energy Convers. Manag. 126, 142–157. doi:10.1016/j.enconman.2016.07.076
Hu, Y., Yan, K., Zhao, J. J., Ren, Y. G., Yan, X. H., and Zhao, H. S. (2020). Estimating demand response flexibility of SmartHome Appliances via NILM algorithm. 2020 IEEE 4th Inf. Technol. Netw. Electron. Automation Control Conf. (ITNEC) 2020, 394–398. doi:10.1109/ITNEC48623.2020.9084961
Ju, L. W., Tan, Z. F., Yuan, J. Y., Tan, Q. K., Li, H. H., and Dong, F. G. (2016). A bi-level stochastic scheduling optimization model for a virtual power plant connected to a wind-photovoltaic-energy storage system considering the uncertainty and demand response. Appl. Energy 171, 184–199. doi:10.1016/j.apenergy.2016.03.020
Kornrumpf, T., Meese, J., Zdrallek, M., Neusel-Lange, N. L., and Roch, M. (2016). Economic dispatch of flexibility options for Grid services on distribution level. 2016 Power Syst. Comput. Conf. (PSCC) 2016, 1–7. doi:10.1109/PSCC.2016.7540836
Li, Y. Q., Zhang, D. Y., Chen, Y. X., and Lv, K. (2019). Optimization dispatching of microgrid considering transferable load. Smart Power 47 (05), 51–58.
Li, Z. M., Wu, L., Xu, Y., and Zheng, X. D. (2021). Stochastic-weighted robust optimization based bilayer operation of a multi-energy building microgrid considering practical thermal loads and battery degradation. IEEE Trans. Sustain. Energy 13 (2), 668–682. doi:10.1109/TSTE.2021.3126776
Naval, N., and Yusta, J. M. (2021). Virtual power plant models and electricity markets-A review. Renew. Sustain. Energy Rev. 149, 111393. doi:10.1016/j.rser.2021.111393
Pan, X. Y., Niu, X. Y., Yang, X., Jacquet, B., and Zheng, D. (2015). Microgrid energy management optimization using model predictive control: a case study in China. IFAC-PapersOnLine 48 (30), 306–311. doi:10.1016/j.ifacol.2015.12.395
Pourghaderi, N., Fotuhi-Firuzabad, M., Moeini-Aghtaie, M., and Kabirifar, M. (2018). Commercial demand response programs in bidding of a technical virtual power plant. IEEE Trans. Industrial Inf. 14 (11), 5100–5111. doi:10.1109/TII.2018.2828039
Ren, H., Zhou, Y., Wen, F., and Liu, Z. (2023). Optimal dynamic power allocation for electric vehicles in an extreme fast charging station. Appl. Energy 349, 121497. doi:10.1016/j.apenergy.2023.121497
Riveros, J. Z., Bruninx, K., Poncelet, K., and D’haeseleer, W. (2015). Bidding strategies for virtual power plants considering CHPs and intermittent renewables. Energy Convers. Manag. 103, 408–418. doi:10.1016/j.enconman.2015.06.075
Saboori, H., Mohammadi, M., and Taghe, R. (2011). Virtual power plant (VPP), Definition, concept, Components and types. 2011 Asia-Pacific Power Energy Eng. Conf. 2011, 1–4. doi:10.1109/APPEEC.2011.5749026
Wang, G., Li, Z., and Wang, F. (2021). Enhanced sufficient battery model for aggregate flexibility of thermostatically controlled loads considering coupling constraints. IEEE Trans. Sustain. Energy 12 (4), 2493–2496. doi:10.1109/tste.2021.3099314
Xie, H. L., Zheng, Y. N., and Li, Y. Q. (2019). Economic dispatching model of microgrid based on energy blockchain network. J. North China Electr. Power Univ. Nat. Sci. Ed. 46 (03), 17–25.
Xu, H., Jiao, Y., and Pu, L. (2017). Stochastic scheduling optimization model for virtual power plant of integrated wind-photovoltaic-energy storage system considering uncertainty and demand response. Power Syst. Technol. 41 (11), 3590–3597. doi:10.13335/j.1000-3673.pst.2016.3379
Yan, M., Li, H., Wang, J., and He, Y. J. (2022). Optimization operation model of park integrated energy system considering comprehensive demand response uncertainty. Power Syst. Prot. Control 50 (02), 163–175. doi:10.19783/j.cnki.pspc.210330
Yang, L. J., Li, H. Q., Yu, X. Y., Zhao, J. S., and Liu, W. Y. (2018). Multi-objective intraday optimization dispatching method of islanded microgrid considering flexibility. Power Syst. Technol. 42 (05), 1432–1440. doi:10.13335/j.1000-3673.pst.2017.2674
Yi, Z., Xu, Y., Gu, W., Yang, L., and Sun, H. (2021). Aggregate operation model for numerous small-capacity distributed energy resources considering uncertainty. IEEE Trans. Smart Grid 12 (5), 4208–4224. doi:10.1109/tsg.2021.3085885
Yu, Z. Y., Lu, F., Zou, Y., and Yang, X. D. (2022). Quantifying the real-time energy flexibility of commuter plug-in electric vehicles in an office building considering photovoltaic and load uncertainty. Appl. Energy 321 (12), 119365. doi:10.1016/j.apenergy.2022.119365
Zhao, L., Zhang, W., Hao, H., and Kalsi, K. (2017). A geometric approach to aggregate flexibility modeling of thermostatically controlled loads. IEEE Trans. Power Syst. 32 (6), 4721–4731. doi:10.1109/tpwrs.2017.2674699
Keywords: two-stage optimization, generalized energy storage, intraday market, real-time dispatch, rolling optimization
Citation: Wang L, Liu H, Wang Q, Cao B, Cong Y, Ding Y and Zheng X (2024) An intraday dispatch strategy for demand-side flexible resources based on two-stage optimization. Front. Energy Res. 12:1343728. doi: 10.3389/fenrg.2024.1343728
Received: 24 November 2023; Accepted: 22 May 2024;
Published: 14 June 2024.
Edited by:
Ivan Pavić, University of Luxembourg, LuxembourgReviewed by:
Alireza Akbari-Dibavar, University of Tabriz, IranHong Fan, Shanghai University of Electric Power, China
Copyright © 2024 Wang, Liu, Wang, Cao, Cong, Ding and Zheng. This is an open-access article distributed under the terms of the Creative Commons Attribution License (CC BY). The use, distribution or reproduction in other forums is permitted, provided the original author(s) and the copyright owner(s) are credited and that the original publication in this journal is cited, in accordance with accepted academic practice. No use, distribution or reproduction is permitted which does not comply with these terms.
*Correspondence: Hongqing Liu, aG9uZ3FpbmdfbGl1QDEyNi5jb20=