 Boyuan Zhang1,2*
- 1UCL Energy Institute, University College London, London, United Kingdom
- 2Energy Internet Research Institute, Tsinghua University, Beijing, China
Through quantitative modeling, the study established a dynamic supply and demand system from freight demand, renewable energy production, alternative new energy, renewable energy consumption and carbon dioxide emissions to assess the impact of demand-side and supply-side changes on energy decarbonization. The results indicate that adjusting the freight volumes of railway and aviation, renewable energy electricity supply, and the use of alternative new energy sources have varying degrees of impact on decarbonization in transportation. Through interventions on the demand side of freight volumes, CO2 emissions from transportation decrease to levels below those before the intervention-induced fluctuations, while consumption of renewable energy increases to levels above those before the adjustment.
1 Introduction
Freight transportation could be one of the major contributors of global greenhouse gas emissions. Despite the crucial role in maintaining global supply chains and promoting economic development, reducing carbon emissions from freight transportation has become a global challenge in addressing climate change and achieving sustainable development goals. Especially in G20 countries, the carbon emissions from freight transportation are staggering due to the huge economic scale and population size. Therefore, to address climate change and achieve sustainable development goals, G20 countries need to consider various interventions to reduce carbon emissions in transportation. Interventions related to demand and supply are considered important ways to reduce carbon emissions from freight transportation, including demand-side management, the use of electricity sourced from renewable energy and the promotion of alternative new energy applications. However, the impact of the intervention measures could be uncertain, so it could be of significance to explore the impact in the decarbonization process of freight transportation.
Based on panel data covering G20 countries, this research constructs a scenario system by using panel vector autoregressive model (PVAR) to integrate important indicator variables of demand, supply and decarbonized transportation. The aim would be studying the impact of scenario with demand and supply-side intervention measures for freight transport on decarbonized transportation.
2 Literature review
The existing research has employed quantitative analysis of panel data to evaluate the dynamic connections and interactions between carbon emissions and interventions related to demand and supply. Arvin et al. (2015) explored the interrelationships and connections between variables such as transportation density, urbanization level, and carbon dioxide emissions by using the PVAR model. The study suggests that the government could encourage research and development in biofuel technology to reduce CO2 emissions and focus on improving the service efficiency of the transportation system. Habib et al. (2021) estimated the dynamic connections between variables such as transportation intensity, transportation freight volume, and road carbon emissions using panel models. The results indicate a unidirectional relationship between freight transportation and CO2 emissions. Furthermore, as the largest carbon emitter, the G20 countries should promote environmentally friendly technology and foster the development of renewable technologies. Li et al. (2022) discovered with the PVAR model that transportation efficiency and structure have a mutually reinforcing effect, while interventions could be made by adjusting transportation configurations to reduce energy consumption.
Neves et al. (2019) used PVAR analysis of panel data from OECD countries to suggest that policymakers should encourage the use of alternative energy sources to decarbonize the transportation sector. However, the use of electricity in the transportation sector could not have a significant impact on CO2 emissions. The study proposes that the possible reason would be the CO2 emissions saved by the transportation sector through the use of alternative energy sources are compensated by the increase in CO2 emissions generated in the electricity generation process. Research from Ajanovic and Haas (2016) also support this interpretation, where the environmental benefits associated with the use of electricity in the transportation sector could be only achieved when using renewable energy sources for electricity generation. Carfora et al. (2022) analyzed the PVAR model of EU member states and found that the most effective interventions would be to encourage the abandonment of fossil fuels, while to replace oil and coal with renewable energy sources. Furthermore, Petruška et al. (2022) estimated the short-term relationship between variables such as energy consumption and energy produced from renewable sources using the generalized method of moments (GMM). The results confirm the positive effect of renewable energy production on transport decarbonization, where the increase in the share of renewable energy leads to a reduction for CO2 emissions.
3 Analysis framework and methodology
3.1 Dataset construction
For data collection and classification, the WDI (World Development Indicators) database was employed in this study. However, due to objective factors, a significant number of countries had missing data for variables. Therefore, a thorough trade-off between the number of countries and the size of the dataset was made to guarantee a balanced panel data and a long enough research period. After the extended period of adjustments and attempts, the focus of the study was narrowed down to the G20 nations from 1995 to 2015, during which energy transformation, freight transport innovation, and decarbonized transportation underwent rapid development. The decision to select this time frame was based on careful consideration of the research objectives. The panel data set was chosen for analysis due to the advantages of time-series and cross-sectional data, which allow for the utilization of more information in examining the dynamic relationships of the research.
3.2 Proxy measures for variables
After conducting initial research, a pool of 17 indicators were identified as potential variables. However, due to incomplete sequences for some of the indicators, a further screening process was conducted to ensure the balance of the panel data.
3.2.1 Demand side intervention
As the primary methods of freight transportation, railway and air transport offer efficient completion of transport tasks while meeting the diverse requirements of various types and scales of transportation. Both modes of transport exhibit high efficiency in terms of speed and capacity, while also covering a broad range of areas spanning countries and regions. Under the conditions, large-scale cargo transportation undertaken by railway and air transportation predominates due to cost-effectiveness. Therefore, goods transported by railway (RailTrGood) and freight transported by aircraft (AirTrFre) could be indicative of the demand for freight transportation. Intervention on the demand side could reduce carbon emissions during transportation by adjust freight volumes.
3.2.2 Supply side intervention
The utilization of electricity derived from renewable energy sources and the adoption of alternative new energy sources would exert the intervention effect on freight transportation from the supply side. Electricity generated from renewable energy sources (such as wind, solar and hydro power) could reduce carbon emissions significantly during transport. The adoption of alternative new energy sources such as electric locomotives and hydrogen fuel cells could enable more environmentally friendly transportation. Thus, Electricity production from renewable sources (EleProRe) and Alternative and new energy (AltNuE) would be key factors driving decarbonization of freight transportation and could be used as proxy variables for the supply side intervention.
3.2.3 Decarbonized transportation
To reduce the reliance on fossil fuels, decarbonized transportation necessitates the utilization of renewable energy sources such as wind and solar power. The increase in consumption of renewable energy sources would facilitate the growth and transformation of decarbonized transportation, thereby achieving emission reduction targets. Additionally, carbon dioxide, as a primary greenhouse gas, could be one of the major causes of global climate change. The key to decarbonized transportation would lie in reducing carbon dioxide emissions during the process. Therefore, Renewable energy consumption (ReEneCon) and CO2 emissions from transport (CO2EmTra) could be used as important indicators to measure decarbonized transportation.
3.3 PVAR model formulation
The Panel Vector Autoregression (PVAR) model was first introduced by Holtz-Eakin et al. (1988). The model could be characterized by elaborate structure and capacity to capture diverse aspects of the data by modeling research variables as endogenous variables while treating each variable as a function of the lag value of all variables in the system. (Holtz-Eakin et al. 1988). Therefore, to examine the dynamic relationship from freight transport demand and supply factors to the context of decarbonized transportation, the PVAR model would be used to investigate and elucidate the research. Moreover, the PVAR presentation format provides the intuitive representation of the interactions between variables in the transport system.
From the theoretical perspective, the PVAR model utilized for the purpose of analysis could be characterized as follows:
As
Integrated with the framework of the analysis, the quantification of the freight transportation demand side, supply side, and decarbonized transportation components within the system in the scenario could be expressed as follows:
Demand side:
Supply side:
Decarbonized transportation:
4 Analysis and results
4.1 Unit-root tests
Ensuring the stationarity of variables could be crucial before beginning the analysis process. If non-stationarity would be present in the variable sequence, the estimation of the model would deviate from the principles of asymptotic theory, potentially leading to distorted subsequent analysis results. Moreover, non-stationary variables may result in spurious regression estimates. In order to guarantee the dependability of the analysis findings, a Fisher-type examination, predicated on the Augmented Dickey-Fuller test, would be utilized to scrutinize the presence of unit roots in the six variables extracted from the panel data. After undergoing unit-root testing, all the variables (RailTrGood, AirTrFre, EleProRe, AltNuE, ReEneCon, and CO2EmTra) chosen for incorporation into the PVAR model were found to have rejected the null hypothesis. (Please refer to the Supplementary Appendix for the test results due to space constraints).
4.2 Lag order selection
The selection of lag order could be a critical step that impact the estimation outcomes of the model. To determine the reasonable lag order, relevant information criteria would be commonly employed. Based on the 1 to 4 lag values of the variables, the first to third order PVAR models were evaluated and considered as reasonable choices.
Based on the data presented in Table 1, the determination coefficients for each lag were comprehensively evaluated. In accordance with the selection criteria proposed by Andrews and Lu (2001), the first order PVAR model was deemed to be a relatively reasonable choice, given that it had the lowest MBIC, MAIC and MQIC among the criteria for 1 to 3 lags. Therefore, the subsequent analysis and estimation focused on the PVAR model with first order.
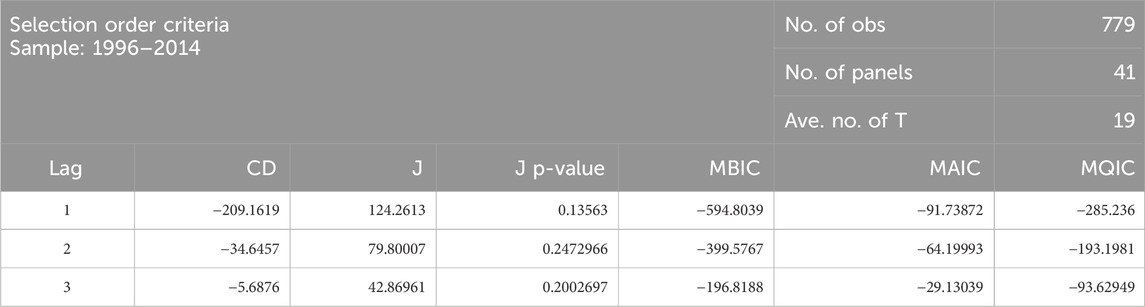
Table 1. Lag order selection.
4.3 PVAR and GMM estimation
In order to estimate the models, the initial four lag periods were utilized as instruments. The outcomes presented in Table 2 suggest that the regression analysis indicates a notable level of significance for the variables examined. Specifically, the lag term of EleProRe and AltNuE exhibited a considerable level of significance at the 1% and 5% levels respectively. Moreover, the statistical significance of RailTrGood, AirTrFre, and ReEneCon was demonstrated at a 10% significance level.
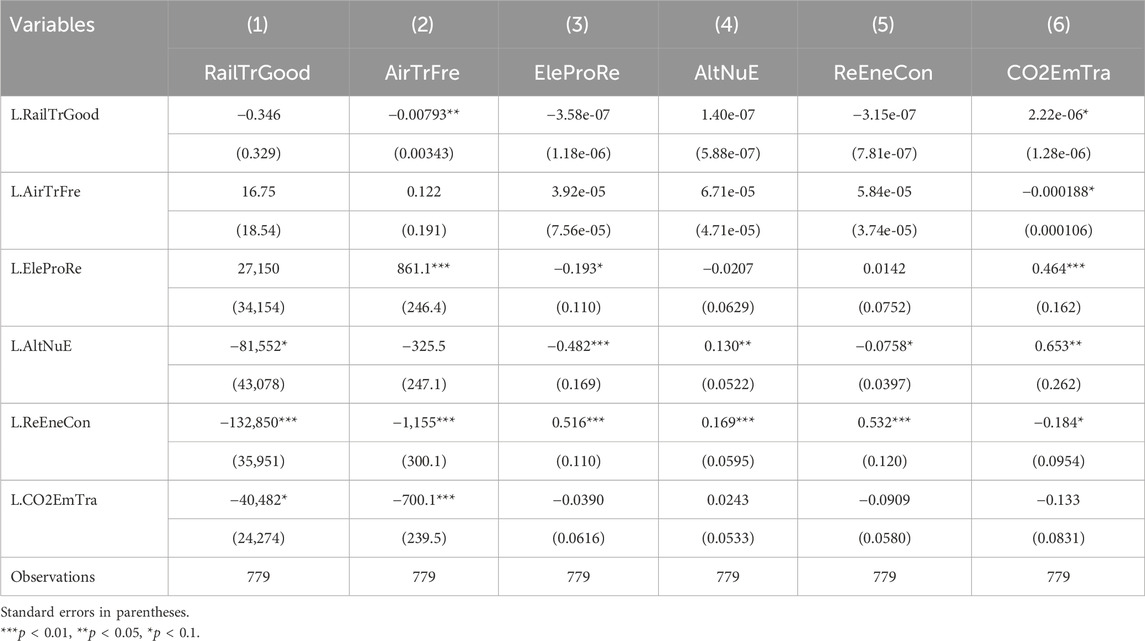
Table 2. PVAR estimation.
The subsequent phase of the analysis involves addressing missing data and enhancing estimation accuracy through the implementation of the Generalized Method of Moments (GMM) instruments recommended by Holtz-Eakin et al. (1988). As noted by Hall (2004), the utilization of GMM facilitates the automatic exclusion of observations without valid instruments and the imputation of missing values. Consequently, the effective sample size could be expanded, thereby improving the estimation efficiency of the model.
Table 3 indicates that the variable parameters estimated through the use of GMM exert a relatively stronger influence compared to presented in Table 2. The lagged term of RailTrGood and AltNuE has the enhancement of 5% and 1% significance level for CO2 emissions from transport respectively.
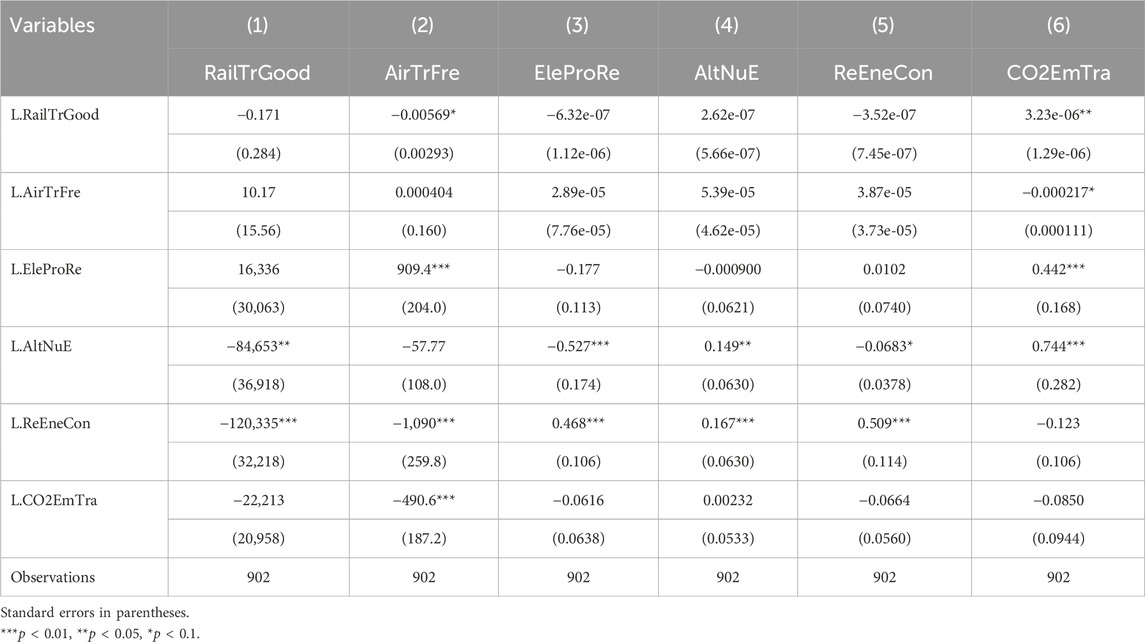
Table 3. PVAR with GMM estimation.
4.4 PVAR granger causality wald test
Following the estimation of the aforementioned process, the investigation of the influence of past values of one variable on the identification and prediction of another variable could be performed through Granger causality analysis (Granger, 1969), thereby providing insight into the interdependence between the variables. The examination of the relationship between the variables could serve as a valuable quantitative foundation for the analysis of decarbonized transportation and related proxy variables.
Tables 4, 5 indicate the results that reveal the causal relationships among the variables in the model system.
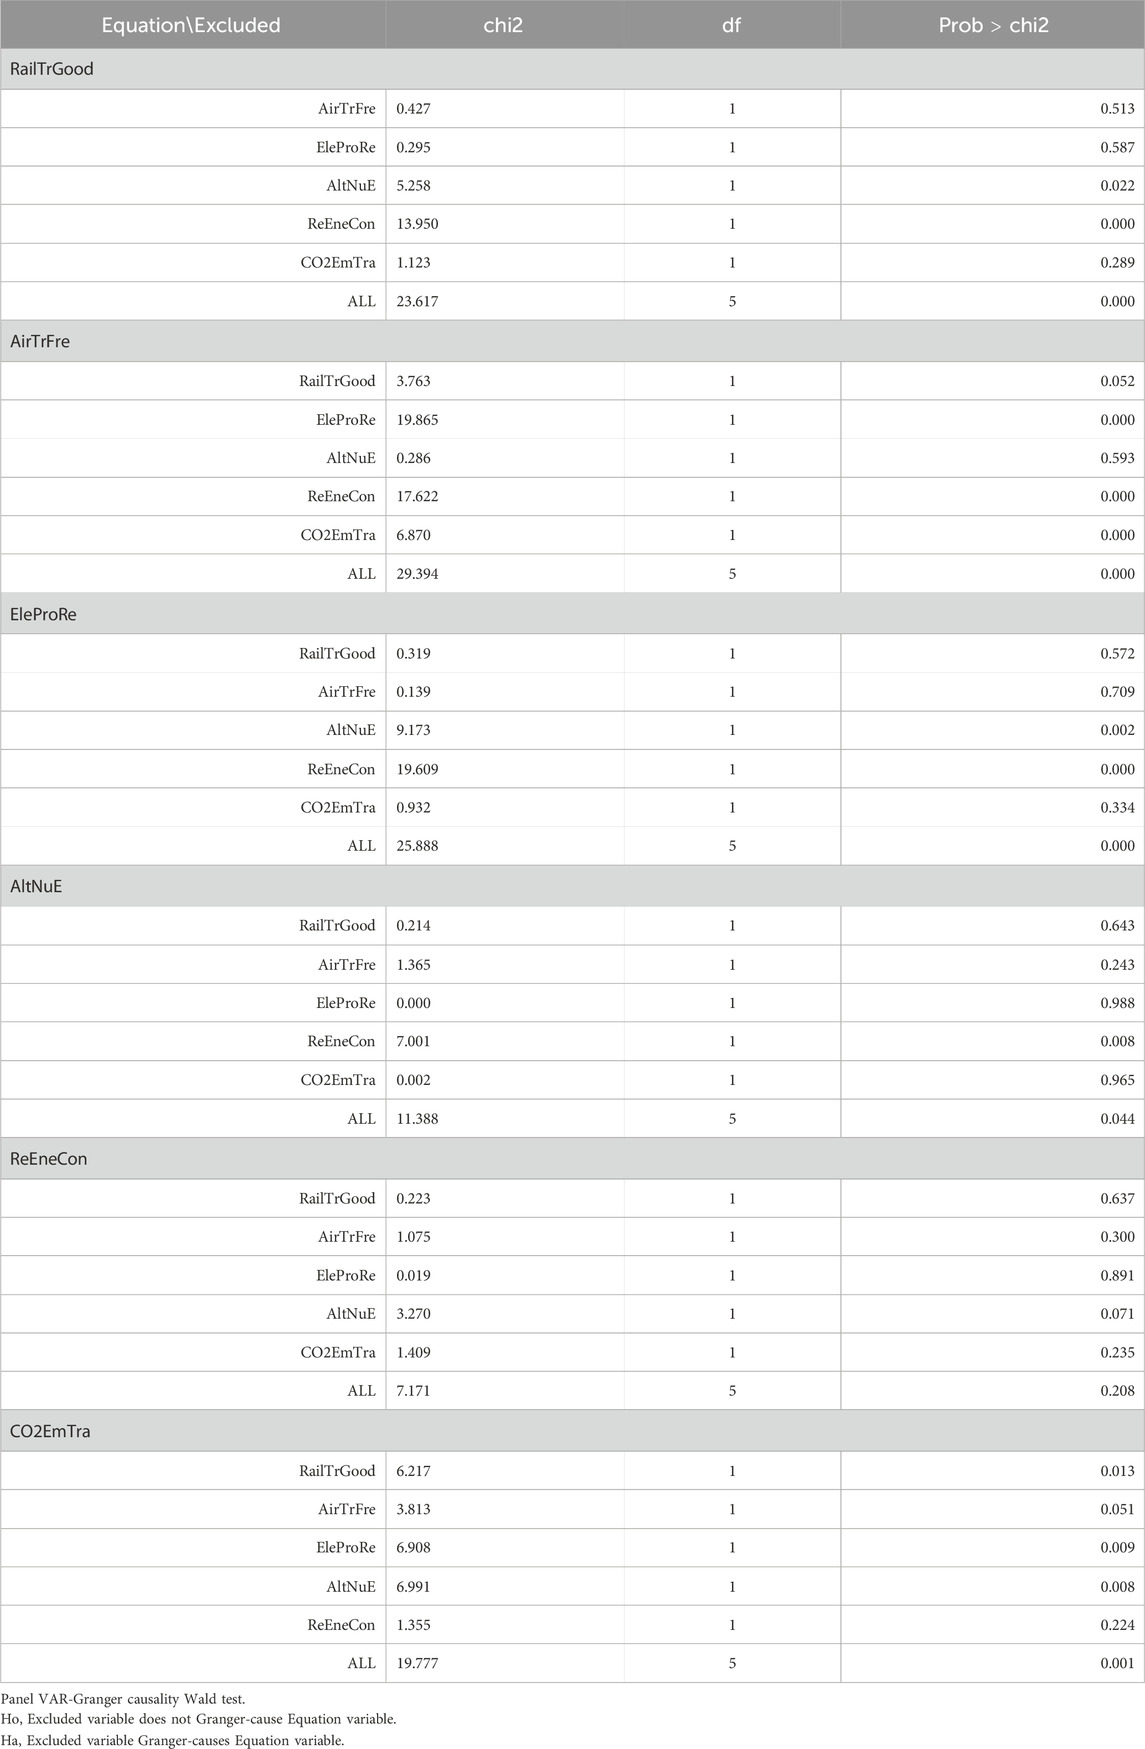
Table 4. Granger causality.
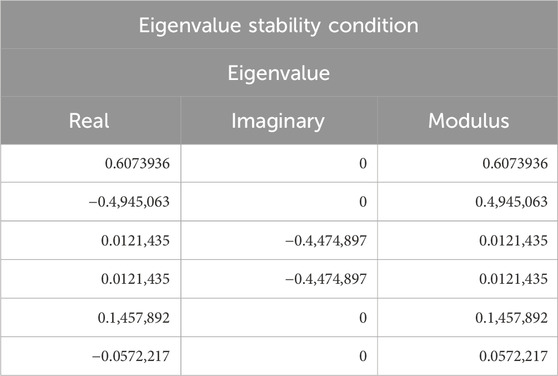
Table 5. Stability condition.
From the perspective of Demand side: RailTrGood could Granger-cause the CO2EmTra at 5% significance level while CO2EmTra could not be observed Granger-cause the RailTrGood. Single direction causality could be existed from the goods transported by railway to CO2 emissions from transport. A two-sided causality could be indicated as AirTrFre could Granger-cause CO2EmTra at 10% significance level while CO2EmTra could be observed Granger-cause the RailTrGood at 1% level.
From the perspective of Supply side: A single way causality could be observed from electricity production from renewable sources to CO2 emissions from transport, which EleProRe could Granger-cause the CO2EmTra at 1% significance level. Similarly, AltNue could Granger-cause the CO2EmTra at 1% significance level while CO2EmTra could not be observed Granger-cause AltNue. Moreover, AltNue could Granger-cause the ReEneCon at 10% significance level while ReEneCon could relatively more significantly Granger-cause the AltNue at 1% level.
4.5 Stability condition
As noted by Abrigo and Love (2016), the causal effects that explain the relationship among PVAR variables could not be elucidated without identifying the constraints on the parameters. Consequently, it would be of considerable importance to assess the stationarity of the PVAR model prior to conducting procedures such as IRF and FEVD analysis. By satisfying the stationarity condition, it would become possible to derive meaningful interpretations for IRF and FEVD analysis in the following stage.
According to the findings presented in Table 5; Figure 1, it could be concluded that the PVAR model meets the criterion for stability. The result could be supported by the observation that all of the eigenvalues are situated within the interior of the unit circle, as well as the fact that the modulus of the companion matrix for the variables is less than 1.
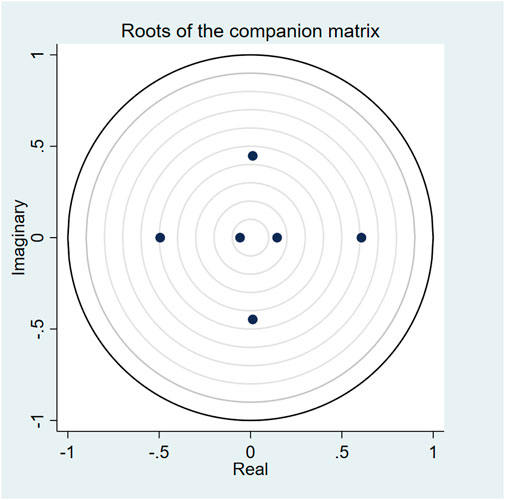
Figure 1. Roots of the companion matrix.
4.6 Impulse response function (IRF)
The Impulse Response Function (IRF) plot depicts the response pattern and trajectory of the delayed impact of the target variable under the assumption of independent shocks with a standard deviation of one from other variables (Abrigo and Love, 2016). Thus, the analysis could reveal the influence and directionality of the effects from demand-side and supply-side interventions on the decarbonization of the transportation through the impact on proxy variables.
4.6.1 Scenario of supply side intervention
Figure 2 illustrates the Impulse Response Function (IRF) analysis that applies 200 Monte Carlo simulations and spans a time horizon of 10 periods, thereby providing the overview of the interplay and response patterns of the six variables in the simulated scenario system. In the next stage, indicators to measure decarbonized transportation (CO2EmTra and ReEneCon) would be used as the response variable, while the intervention impact of the other four variables from demand and supply side on decarbonising transport would be focused on.
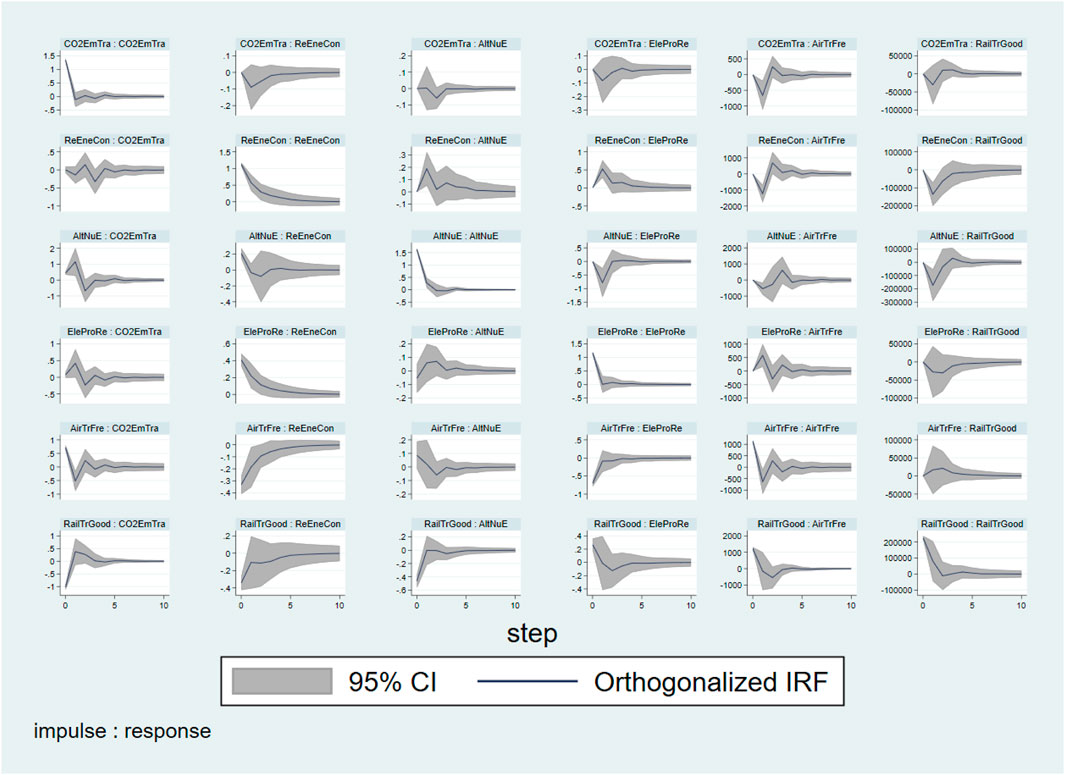
Figure 2. Overall IRF.
According to the results of Figures 3A, B above, following the impact of one standard deviation of AltNuE, a positive impact to CO2EMTra could be observed during the first period. Subsequently, the positive impact turn to negative from 2nd to 3rd period, the impact increase slightly at 4th period then reached a stable state which below the starting level. In addition, a downward trend of positive influence for ReEneCon could be observed in the first two periods. In subsequent periods, ReEneCon recovered and increased from 2nd to 4th period approximately, followed by a slight decline after the fourth period then returned to a steady state.
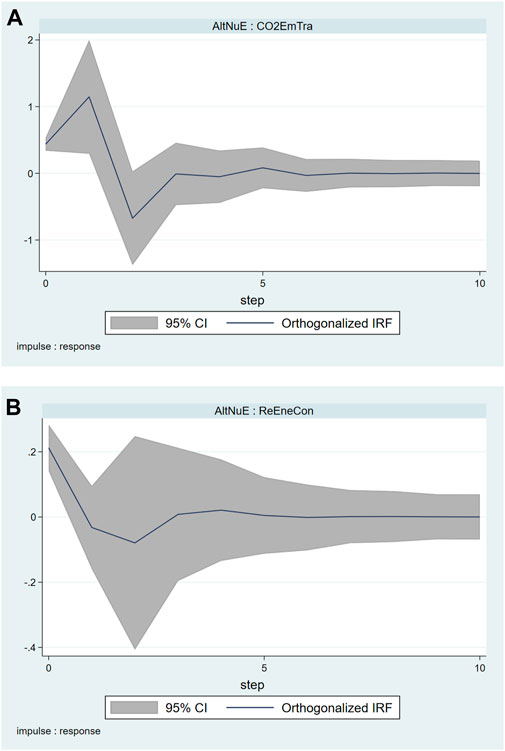
Figure 3. (A) IRF for AltNuE: CO2EMTra. (B) IRF for AltNuE: ReEneCon.
As the result from Figures 4A, B, for a standard deviation impact from EleProRe, CO2EmTra could be observed positively affected at the first period then fall back and turns to negative impact from to 2nd to 3rd period. The impact tends to stabilize lower than the initial level after experiencing slight fluctuations between 3rd to 6th period. The impact of EleProRe on ReEneCon exhibits a singular declining trend, with a gradually decreasing rate observed from the first to the 5th period, followed by the tendency towards stability.
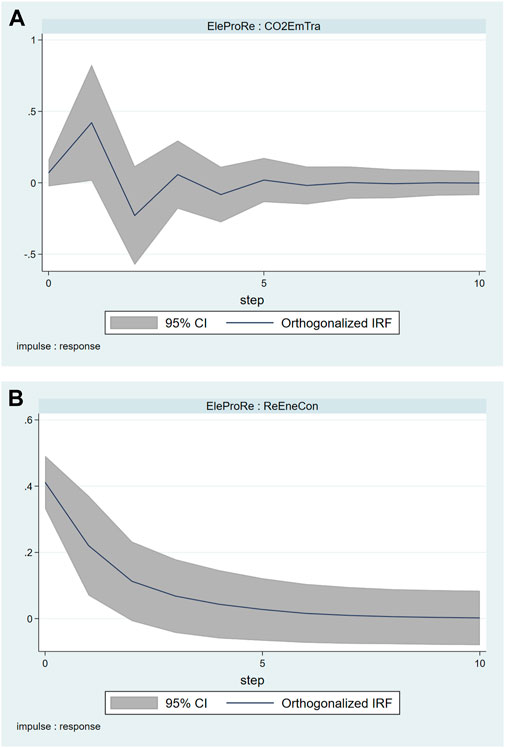
Figure 4. (A) IRF for EleProRe: CO2EmTra. (B) IRF for EleProRe: ReEneCon.
4.6.2 Scenario of demand side intervention
Based on the results presented in Figures 5A, B, it could be observed that CO2EmTra exhibited a notable decline during the first time period subsequent to the influence of AirTrFre. However, in the following time periods spanning from the second to the fifth, fluctuations were observed. The fluctuations gradually diminished beyond the fifth time period, eventually stabilizing at a level lower than the initial state. ReEneCon was observed to have been continuously affected by negative impacts, despite the decreasing intensity of the influence over time, which eventually reached a stable state higher than the beginning level.
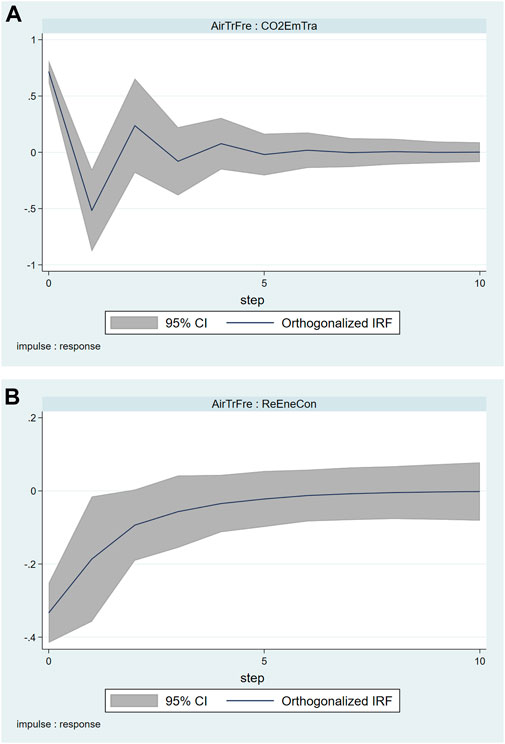
Figure 5. (A) IRF for AirTrFre: CO2EmTra. (B) IRF for AirTrFre: ReEneCon.
The results of Figures 6A, B demonstrate that, following the influence of RailTrGood, CO2EmTra exhibited a gradually diminishing negative impact during the first period and gradually shifted to a positive influence. During the second to fourth periods, the positive impact gradually weakened and turned into negative, eventually stabilizing at the end of the period. Also, ReEneCon was observed to continuously experience negative impacts, which persisted over time and stabilized at a level higher than the initial state.
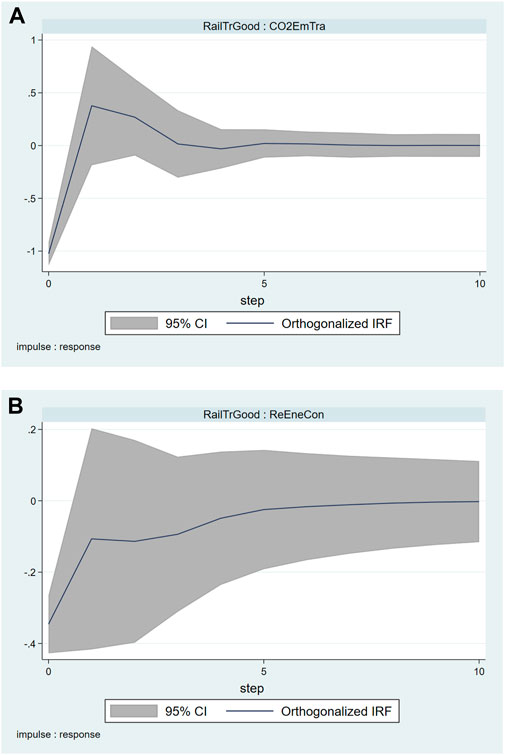
Figure 6. (A) IRF for RailTrGood: CO2EmTra. (B) IRF for RailTrGood: ReEneCon.
4.7 Forecast error variance decomposition (FEVD)
The FEVD technique could be used to determine how much each variable in the created scenario system contributes to the forecast for the target variable. As a result, the technique emphasises the matching levels of importance associated with each variable. The FEVD would concentrate on the implications from variables of demand and supply side interventions for decarbonizing transportation.
Based on the results shown in Figure 7, in terms of CO2EmTra, the largest contribution could be attributed to the supply-side technology AltNuE, accounting for approximately 31%. The contribution from EleProRe would be relatively lower, at approximately 3.8%. The demand-side technologies RailTrGood and AirTrFre have contributions of approximately 20% and 13%, respectively. As for ReEneCon, the largest contribution could be derived from the own lagged values, which remains at 74.08% from the first period to the tenth period, only slightly decreasing to 73.84%. The supply-side technology EleProRe has the highest contribution among the remaining variables, accounting for approximately 10%. The lowest contribution could be observed from AltNue, at around 2.2%. The demand-side variables RailTrGood and AirTrFre both have contributions of approximately 6.5%.
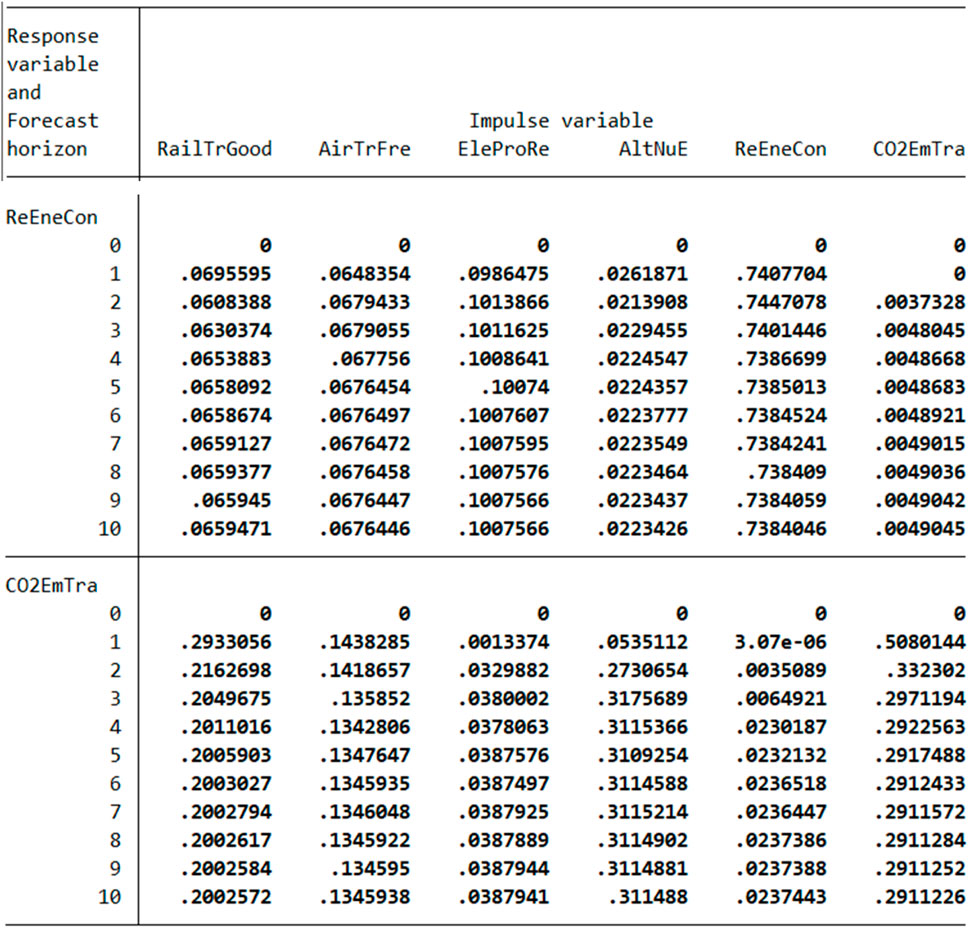
Figure 7. FEVD for ReEneCon and CO2EmTra.
5 Discussion and conclusion
This study explores the panel data of G20 countries during 1995–2015 using the PVAR model. By establishing scenarios involving demand and supply-side interventions and decarbonization of transportation, the research analyzes the effects of adjusting railway and air freight volume, renewable energy electricity supply and alternative new energy use on decarbonization of transportation.
The results suggest that adjusting railway and air freight volume, renewable energy electricity supply and alternative new energy use could have varying degrees of impact on decarbonization of transportation. By intervening in demand-side freight volume, the CO2 emissions from transportation decrease below the pre-adjustment level after a fluctuation caused by the intervention, while renewable energy consumption increases above the pre-adjustment level. The result supports the findings of Li et al. (2022) and similar to the results of Habib et al. (2021). Combining supply-side interventions, renewable energy electricity supply could continuously have a positive effect on consumption of renewable energy and reduce CO2 emissions from transportation below the pre-adjustment level, confirming the views of Petruška et al. (2022). Alternative new energy use causes more fluctuations in CO2 emissions from transportation, although the emissions could be observed lower than before the intervention in the later stages, while this fluctuation could be explained by the views of Neves et al. (2019). The intervention of alternative new energy on renewable energy consumption has a positive impact for most of the period, stimulating the use of renewable energy and further reflecting the measures mentioned by Carfora et al. (2022).
Due to the difference in research focus, this study explores factors concentrate on demand and supply-side interventions. Future research could further investigate and consider additional external factors such as urbanization and population growth to provide a more comprehensive evaluation of the impact and effectiveness of decarbonized transportation.
Data availability statement
The original contributions presented in the study are included in the article/Supplementary material, further inquiries can be directed to the corresponding author.
Author contributions
BZ: Investigation, Writing–original draft.
Funding
The author(s) declare that no financial support was received for the research, authorship, and/or publication of this article.
Conflict of interest
The author declares that the research was conducted in the absence of any commercial or financial relationships that could be construed as a potential conflict of interest.
Publisher’s note
All claims expressed in this article are solely those of the authors and do not necessarily represent those of their affiliated organizations, or those of the publisher, the editors and the reviewers. Any product that may be evaluated in this article, or claim that may be made by its manufacturer, is not guaranteed or endorsed by the publisher.
Supplementary material
The Supplementary Material for this article can be found online at: https://www.frontiersin.org/articles/10.3389/fenrg.2024.1341010/full#supplementary-material
References
Abrigo, M. R. M., and Love, I. (2016). Estimation of panel vector autoregression in stata. Stata J. Promot. Commun. statistics Stata 16 (3), 778–804. doi:10.1177/1536867x1601600314
Ajanovic, A., and Haas, R. (2016). Dissemination of electric vehicles in urban areas: major factors for success. Energy 115, 1451–1458. doi:10.1016/j.energy.2016.05.040
Andrews, D. W. K., and Lu, B. (2001). Consistent model and moment selection procedures for GMM estimation with application to dynamic panel data models. J. Econom. 101 (1), 123–164. doi:10.1016/s0304-4076(00)00077-4
Arvin, M. B., Pradhan, R. P., and Norman, N. R. (2015). Transportation intensity, urbanization, economic growth, and CO2 emissions in the G-20 countries. Util. Policy 35, 50–66. doi:10.1016/j.jup.2015.07.003
Carfora, A., Passaro, R., Scandurra, G., and Thomas, A. (2022). The casual nexus between income and energy poverty in EU member states. Energies 15 (8), 2822. doi:10.3390/en15082822
Granger, C. W. J. (1969). Investigating causal relations by econometric models and cross-spectral methods. Econometrica 37 (3), 424. doi:10.2307/1912791
Habib, Y., Xia, E. X., Hashmi, S. H., and Ahmed, Z. (2021). The nexus between road transport intensity and road-related CO2 emissions in G20 countries: an advanced panel estimation. Environ. Sci. Pollut. Res. 28, 58405–58425. doi:10.1007/s11356-021-14731-7
Holtz-Eakin, D., Newey, W., and Rosen, H. S. (1988). Estimating vector autoregressions with panel data. Econometrica 56 (6), 1371. doi:10.2307/1913103
Li, Z., Hao, T., and Zheng, R. (2022). The relationship between transportation industry efficiency, transportation structure, and regional sustainability development in China: based on DEA and PVAR models. Sustainability 14, 10267. doi:10.3390/su141610267
Neves, S. A., Marques, A. C., and Fuinhas, J. A. (2019). The interactions between conventional and alternative energy sources in the transport sector: a panel of OECD countries. Ext. Energy-Growth Nexus, 231–252. doi:10.1016/B978-0-12-815719-0.00008-5
Keywords: energy decarbonization, freight transportation, time series, PVAR, group of twenty
Citation: Zhang B (2024) Exploring the impact of demand and supply-side interventions on energy decarbonization of freight transportation: a research based on G20 nations. Front. Energy Res. 12:1341010. doi: 10.3389/fenrg.2024.1341010
Received: 19 November 2023; Accepted: 18 April 2024;
Published: 24 May 2024.
Edited by:
Qing Yang, Huazhong University of Science and Technology, ChinaReviewed by:
Cong Men, University of Science and Technology Beijing, ChinaHewen Zhou, Shandong University, China
Copyright © 2024 Zhang. This is an open-access article distributed under the terms of the Creative Commons Attribution License (CC BY). The use, distribution or reproduction in other forums is permitted, provided the original author(s) and the copyright owner(s) are credited and that the original publication in this journal is cited, in accordance with accepted academic practice. No use, distribution or reproduction is permitted which does not comply with these terms.
*Correspondence: Boyuan Zhang, Ym95dWFuLnpoYW5nLjIyQHVjbC5hYy51aw==