 Fei Jiao1
 Zhenyuan Ma
 Qikun Chen
 Dezong Zhao
95% of researchers rate our articles as excellent or good
Learn more about the work of our research integrity team to safeguard the quality of each article we publish.
Find out more
ORIGINAL RESEARCH article
Front. Energy Res. , 14 June 2024
Sec. Smart Grids
Volume 12 - 2024 | https://doi.org/10.3389/fenrg.2024.1340421
This article is part of the Research Topic Application of Image Processing and Knowledge Reasoning in the Construction of New Power System View all 23 articles
Extensive research validates the effectiveness of employing Dissolved Gas Analysis (DGA) for diagnosing electric power transformer failures. However, a significant portion of existing research focuses on static data for classifying failure types, lacking a thorough exploration of causality. This study proposes an approach integrating causality and the DGA framework to infer power transformer failures. Validation through 96 historical samples from diverse transformers demonstrates the capability of this method to identify probable abnormal failures of the power transformer accurately. The proposed causal reasoning method is able to diagnose all common transformer states, accounting for the level of severity in both electrical and thermal failures, and with an accuracy of 95.8%.
In modern power systems, power transformers are vital for uninterrupted energy supply. The uninterrupted functioning of various industries and daily life is contingent upon the reliable transmission and distribution facilitated by power transformers. Early failure detection is essential to prevent disruptions and ensure the stability and resilience of the power system.
Diagnosing failures in power transformers is a complex task, and Dissolved Gas Analysis (DGA) is one of the most effective methods for this purpose. DGA evaluates transformer faults by measuring concentrations of gases in transformer oil, such as hydrogen (H2), methane (CH4), ethane (C2H6), ethylene (C2H4), acetylene (C2H2), carbon monoxide (CO), and carbon dioxide (CO2) (Kari et al., 2018). These gases can indicate different types of faults. Partial discharges generate hydrogen and methane, and the presence of acetylene and hydrogen can confirm arcing (Gouda et al., 2016). The analysis of these gases, including their levels, and proportions provides crucial insights for identifying potential malfunctions in transformers.
Various methods are used to interpret DGA data, while the conventional approaches are ratio methods like the Doernenburg ratio, Rogers ratio, and the Duval triangle (Aizpurua et al., 2018). However, while these techniques are highly accurate, they are time-consuming and expensive (Aizpurua et al., 2018). To address these challenges, there has been a shift towards intelligent diagnostic approaches that integrate soft computin methods with DGA for cost reduction (Tomsovic et al., 1993; Guo et al., 2019). For instance,g the Dempster-Shafer Theory demonstrates that soft computing methods can achieve high accuracy with large sample databases (Min and Chang, 2009). However, the adoption of machine learning in transformer failure diagnosis is hampered by the scarcity of failure data caused by the frequency of transformer failures.
To address the challenge of low transparency and the lacking of training data, this study proposes a method that integrates the DGA with causal reasoning to diagnose the transformer failures. In general, failure diagnosis and explanation are rooted in the fundamental concept of causality Lewis (1986) Achieving a clear understanding of these processes relies on accurately identifying the interdependence and causal relationships among their constituent components, as discussed in further research Özgür-Ünlüakın et al. (2021). Causal reasoning, an emerging approach, leverages knowledge of causal relationships between variables to predict outcomes based on cause-and-effect models Pearl and Mackenzie (2018). It effectively reduces the requirements for training datasets as it leverages knowledge of causal relationships between dissolved gases and equipment failures instead of static data regression.
The paper is organized as follows. After the introduction in Section 1, the conventional failure diagnosis methods are presented in Section 2. The methodology of the proposed system is proposed in section 3. The experimental results including the comparison with three conventional methods and discussions are stated in section 4. Finally, the conclusions are summarized in section 5.
The generation of the hydrocarbon gases within the normal operating transformers would be caused by thermal and electrical stresses, which can indicate potential problems within the transformer (Syafruddin and Nugroho, 2020). As transformers age, some gas generation is anticipated; distinguishing between normal and excessive gassing rates is crucial. Normal gas generation in transformers is influenced by several factors. These include transformer design, loading, and the type of insulating material used. To identify abnormal behavior in transformers, standard gassing rates are employed as a universal metric (Ali et al., 2023).
The breakdown of insulation in transformers leads to the production of crucial gases such as H2, CH4, C2H6, C2H4, C2H2. Other gases such as CO and oxygen (O2) are also present, originating from the degradation of cellulose insulation (Kari et al., 2018). Moreover, external factors like CO2, nitrogen (N2), and moisture can be absorbed from the air due to an oil/air interface or tank leak. The specific gases generated and their quantities depend on the fault’s location, severity, and energy. Low-energy events like partial discharge produce hydrogen, methane, and ethane. The sustained high-energy arcing results in the generation of all gases, with acetylene requiring the most energy. The appearance of these gases in transformers is influenced by temperature, as they dissolve within the insulation oil based on the nature and intensity of the failures (Syafruddin and Nugroho, 2020).
An accurate fault diagnosis involves alerting to gases surpassing the standard limits in terms of concentrations, increments, rates of change, or ratios. The diagnostic report should include concise interpretive remarks and recommendations derived from these findings. To facilitate the identification of various faults during the diagnostic process, distinct classes have been established. These classes are determined through the physical examination of numerous faulty transformers, which are detectable through visual inspections and DGA outcomes. These classes are also summarised in Table 1.
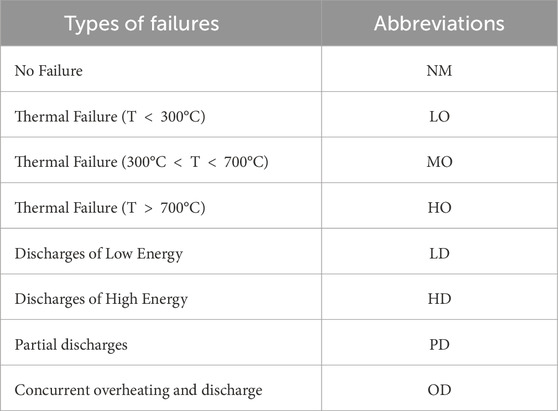
Table 1. Transformer types of failure.
Failures such as overheating, discharges, and Concurrent overheating and discharge generate various gases. The specific nature and intensity of the fault can be determined by analyzing the concentrations and types of these gases. The primary approach for diagnosing transformer failures using Dissolved Gas Analysis (DGA) involves extracting status information, which consists of various combinations of characteristic gases, throughout the operation of the power transformer. Subsequently, an existing diagnostic model algorithm is applied to analyze and differentiate this state information. Based on the judgment results, power system operators can discern the fault type and severity of the transformer. This information enables them to promptly devise specific countermeasures tailored to different situations, aiming to minimize fault-related losses within the power system to the greatest extent possible. The conventional methods include Doernenburg Ratio Method (CH4/H2, C2H2/C2H4, C2H2/CH4, C2H6/C2H2), Rogers Ratio Method (CH4/H2, C2H2/C2H4, C2H4/C2H6, C2H6/CH4), and Duval Triangle Method (CH4/H2, C2H2/C2H4, C2H4/C2H6).
Doernenburg Method (DRM), which can be found in the IEEE C57.104–1991 guide, makes use of the ratios of the concentration of the key gases Hydrogen, Methane, Ethane, Ethylene, and Acetylene (Stenkovski et al., 2022). Although it was withdrawn by IEEE in 2006, it is one of the most effective methods in the diagnosis of electrical equipment such as transformers. This method is restricted by a few criteria. This diagnostic approach often has the drawback of leading to ‘no diagnosis’, a situation that happens more often than not (Jongvilaikasem et al., 2022). To apply this method, one of the key gases (H2, C2H2, C2H4, C2H6, or CH4) must have a concentration at least double the L1 concentration levels listed in Table 2. By referring to Table 3, the failure can be diagnosed.
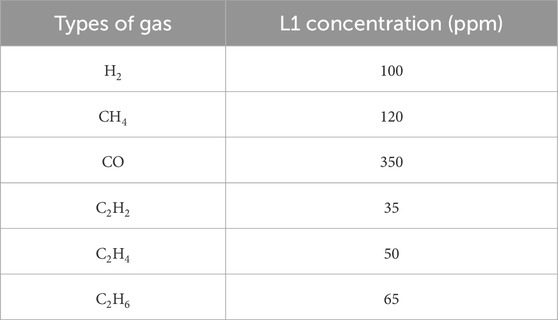
Table 2. The limited concentration of the dissolved gas (Jongvilaikasem et al., 2022).
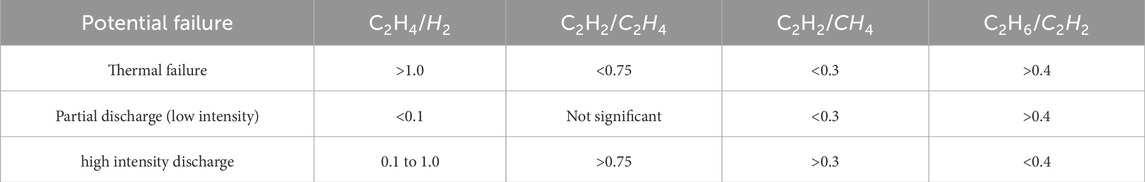
Table 3. Doernenburg RATIO FAILURE DIAGNOSIS METHOD (Jongvilaikasem et al., 2022).
The Roger Ratio Method (RRM) utilizes gas ratios similar to those in the DRM, specifically C2H2/C2H4and CH4/H2, with the exception of the ratio of C2H4/C2H6 (Bakar et al., 2014), as shown in Table4. Unlike the DRM, the RRM can be used even if the key gases are not at high concentrations. This means that, with RRM, the gas concentrations do not need to be at least twice the L1 levels (Rogers, 1978). DRM and RRM are effective in diagnosing failures, but they have a limitation. Sometimes, certain gas combinations do not fit within the specified value range. When this happens, it becomes impossible to determine the type of fault.
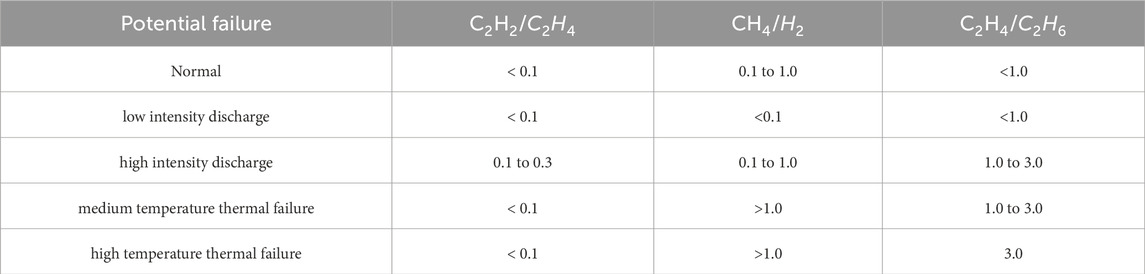
Table 4. Rogers ratio failure diagnosis method (Jongvilaikasem et al., 2022).
DTM works on the idea that various faults in a transformer create different gases. By measuring the amounts of these gases, it is possible to figure out what kind of fault is present (Duval, 2008). It came from IEC TC10 databases and an existing IEC 60599 Ratio method. The results of the gas analysis are then plotted on a triangular diagram, known as the Duval Triangle. This triangle is divided into different zones, each corresponding to a particular type of fault, such as thermal faults, electrical discharges, or a combination of both (Li and Zhang, 2016). The application of the DTM relies on three essential gases (CH4, C2H4, and C2H2), which represent progressively higher energy levels of gas generation. The concentrations of these gases are computed and subsequently graphed on the three edges of a triangular diagram, as shown in Figure 1. Compared with DRM and RRM, DTM will not appear in cases where some results can fall outside the codes and no diagnostics can be given. DTM has created a closed-loop so it can always consistently yield a diagnosis, and maintain a low rate of incorrect assessments.
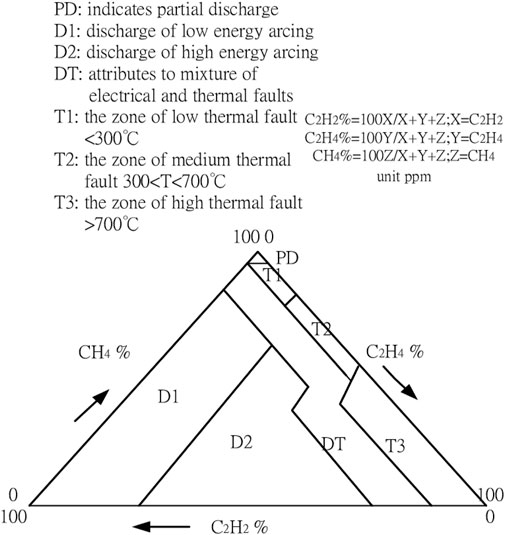
Figure 1. Duval triangle Failure Diagnosis (Jongvilaikasem et al., 2022)
Several approaches have been suggested to enhance the precision of ratio-based DGA diagnostic approaches. These can generally be divided into fuzzy logic-based methods, heuristic methods and multiple data-driven artificial intelligence (AI) technologies.
Fuzzy logic facilitates the expression of imprecise requirements, encompassing uncertain criteria or loosely defined constraints, allowing for reasoning in situations with uncertain specifications. Tomsovic et al. (1993) introduced a theoretical fuzzy information model and inference scheme, utilizing rule-based representation to systematically integrate diverse diagnostic methods. This approach effectively resolved the potential rule conflicts and ensured the generation of the most consistent conclusions. Its advantages included robustness to missing data, ease of expansion to new diagnostic methods, and analytical performance evaluation. However, functions in fuzzy logic systems need to be determined based on expert experience, and effective fuzzy logic systems require comprehensive knowledge from human experts. In addition, the limitation also occurred when the rules in the rule-based system could not be automatically adjusted through the self-learning process, requiring more interventions from human experts.
Most of the intelligent fault diagnosis methods in power transformers are based on a variety of data-driven machine-learning technologies. Saravanan et al. (2020) applied a Multilayer Artificial Neural Network (ANN) to classify the transformer failure with an accuracy of 76%. However, Katooli and Koochaki (2020) indicated that the ANNs utilized BPA as a learning algorithm that reduced their level of accuracy. Some works applied the machine learning approaches as attribute selectors and combined them with the Support Vector Machine (SVM) to improve precision and reliability. Moreover, other than the SVM, some works implemented the ANN as the failure classifier. For example, Li et al. (2016) proposed a power transformer failure diagnosis approach based on an SVM achieving a diagnosis accuracy of 87.18%. In this approach, GA selected the free control parameters of SVM including penalty parameter, sigma, and type of kernel function, and then SVM was for transformer failures classification. Moreover, Dwiputranto et al. (2021) proposed a method that combined GA and ANN to classify the type of transformer failure reliably based on DGA data and achieved an accuracy of 95%.
Numerous techniques have been introduced for diagnosing power transformer failures. However, most of the existing technologies utilise black-box models to obtain fault diagnosis results while the causality was relatively inconsiderate in this domain. When it comes to diagnosing faults and understanding the reasoning process, using black-box models often fails to provide explanations that match real-world phenomena. Explanations are rooted in the fundamental concept of causality and the absence of a causal framework in contemporary systems has been linked to issues related to generalization, interpretability, and outcome quantification (Peters et al., 2017). The exploration of techniques to distil rules from equipment failure events remained a developing area. This approach often lacked a deep understanding of the basic causes and struggled with diagnosing multiple failures and updating with new knowledge (Saravanan et al., 2020). Our approach aims to identify and understand how different types of failures cause various gases to be produced. This helps in clearly determining the source and type of the failure.
To solve the challenges of lacking transparency and training data, this research proposes a causal-based method to diagnose the type of failure by discovering the causal relationship between the concentration and the types of the specific gases and the types of failures. To process the methodology, it would be necessary to review the causal reasoning first.
Causal reasoning, recognized as a fundamental cognitive capability, empowers individuals to navigate the complexities of the world by discerning the underlying causes of observed phenomena and devising effective problem-solving strategies (Waldmann, 2017). The objective of causal reasoning is to acquire adequate knowledge about the causal relationships between variables to predict/infer the outcome accurately (Stuart, 2010). Within this context, causal reasoning serves as a framework for systematically formalizing our comprehension of the data-generating process through the application of Structural Causal Models (SCMs). SCMs, or Structural Causal Models, help estimate how interventions affect the data produced by a certain process (Nogueira et al., 2022). To analyze the causal impacts of certain variables on others, a formalization of causal relationships is required. A widely accepted method for representing these relationships is through the utilization of a causal-directed acyclic graph (causal DAG), often referred to as a causal diagram (Shen et al., 2020). Such a diagram can capture prior assumptions regarding the causal structure of interest, which can include insights from expert knowledge. Usually, conventional causal reasoning focuses on figuring out the effects of certain causes. But this diagnostic system works the other way around: it starts from the effects and tries to find out what the possible causes might be.
Bayesian Networks (BNs), probabilistic graphical models that depict the probabilistic associations among random variables, are regarded as a potent instrument in the domain of causal reasoning (Lu et al., 2023). Moreover, Lakehal et al. (2015) illustrates that BNs allow for the reversal of probabilities, enabling the identification of causes when effects observations and cause consequences are known. Refer to Figure 2, a Bayesian Network contains an edge connecting two variables signifies a direct dependence between them, with one acting as the parent (cause) and the other as the child (effect). To capture this relationship, each node in the network possesses a conditional probability table, quantifying the child variable’s behavior in response to its parent(s) if multiple parents are involved. However, for root nodes without parents, the probability table is non-conditional, representing prior probabilities related to variable values. The graphical representation is referred to as the model structure, with associated probability tables termed model parameter. Therefore, identifying the cause-and-effect relationships and conducting the causal model requires both structural learning and parameter learning. These structural elements can either be derived from expert knowledge or computed based on available data.
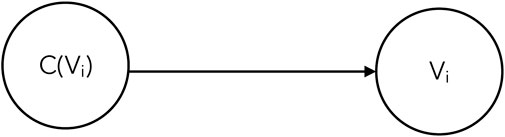
Figure 2. General Bayesian network.
BNs effectively handle uncertainty and depict interrelationships between problem variables, offering a visually accessible representation and enabling comprehensive failure probability analysis for complex systems (Lakehal et al., 2015; Özgür-Ünlüakın et al., 2021). Consequently, BNs serve as the foundational framework underpinning this paper. By leveraging BNs, our approach discovers the relationship between the types and quantities of specific gases under various power transformer states. Integrating this relationship under the dissolved gas analysis framework, the invention establishes the BNs model for power transformer state diagnosis. Our proposed diagnosis approach will be introduced in detail in Section 3.2.
Our proposed method, integrating causal reasoning and dissolved gas analysis. It aims to work well in general, using a small amount of data to evaluate the condition and track faults in various types of power transformers. As shown in Figure 3. The proposed method comprises three main steps: 1) Conducting a Causal model; 2) Training a Bayesian Network with structure learning and parameter learning; and 3) Utilizing the model to diagnose failures. For this study, a quantity of 823 samples was obtained from the North China Electric Power Research Institute (2021), involving the transformers in 110 kV, 220 kV, 330 kV, 500 kV, and 750 kV. This dataset consists of a subset of 727 samples for the model training and a subset of 96 samples for the testing. After the conduction of the model, the proposed method will be tested through the testing dataset with a comparison with the conventional methods, including DRM, RRM, and DTM. The following will introduce the process of model conduction.
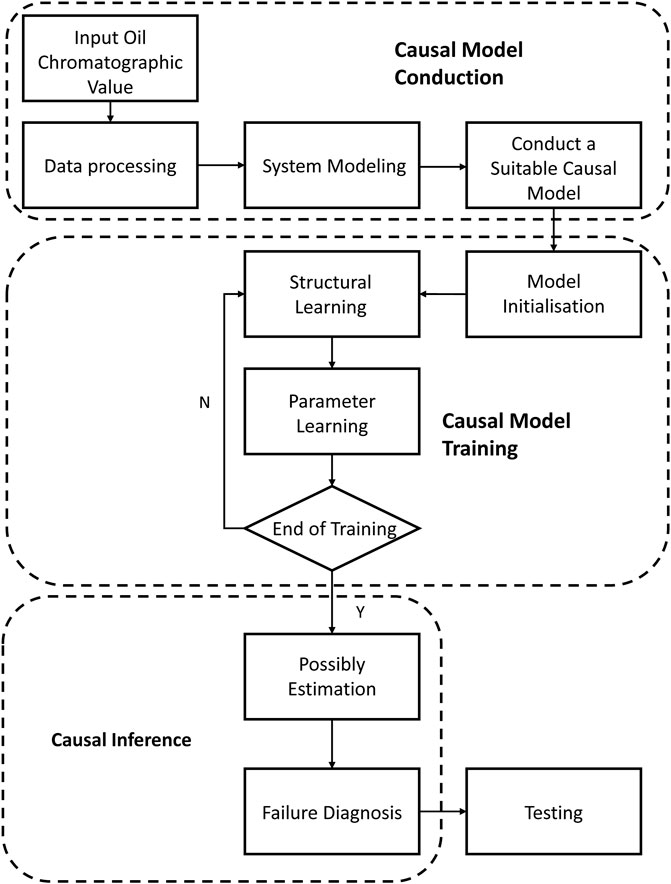
Figure 3. General causal model for transformer failure diagnosis.
Given the differences in initial data from various transformers, it is crucial to preprocess this data. This step aligns the inputs with the model, minimizing noise and ensuring the accuracy of the causal model. Addressing the issue of limited failure data and the low interpretability of power grid transformers, our method is proposed to refine by discovering and constructing causal relationships between transformer status, gas production types, and quantities. The BNs serve as the foundational method for fault diagnosis and traceability. In light of inevitable errors from causal learning, manual intervention, branch reduction, and optimization through expert experience are implemented to enhance model accuracy. Ultimately, a fault reasoning method is formulated based on the cause-and-effect model of power transformer status and gas production. This method conducts explainable reasoning, failure-type judgment, and screening to support operational, maintenance, and repair activities. This enhancement seeks to enhance work quality and efficiency in power transformers.
Diehl and Ramirez-Amaro (2022) indicate that the process of explaining failures necessitates the acquisition of knowledge regarding the cause-and-effect relationship between potential causes and the effects of a phenomenon. The framework of this model is established based on the DGA technology. Therefore, the potential causes should be various transformer states (refer to Table 1) and the effects should be the type and the content of the dissolved gases in transformer oil. According to (Feng et al., 2021), due to the rareness of safety-critical events, adversarial learning proves valuable in significantly reducing the necessary data quantity without compromising impartial evaluation. In other words, an appropriate reduction of the normal data subset can substantially reduce the overall dataset size without reducing the capacity of the model. Therefore, the training dataset was designed as shown in Table 5.
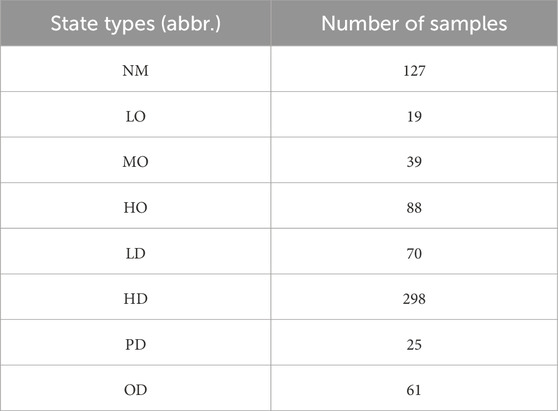
Table 5. Transformer STATE types in the training samples.
Moreover, in the analysis of gas release, seven types of dissolved gases are commonly considered: H2, CH4, C2H2, C2H4, C2H6, CO, and CO2 (Gouda et al., 2016). However, to reduce dataset requirements and simplify the model, the investigation of the two carbon oxides (CO, CO2) will be eliminated as their relatively minor proportional variations.
This research includes multiple transformers, and gas production levels may vary. To address this, data preprocessing will use gas proportions instead of the content. Unlike traditional ratio-based DGA or other methods that use normalization, our method calculates specific gas ratios to the total gas, offering comprehensive observations. A sudden increase in a specific gas raises its proportion, reducing the ratios of other gases. H2, with significant overall presence, is considered separately. Proportions are calculated as follows:
After identifying the variables, the next step is to construct the causal model. A set of treatments X will be generated, and denoted as C ⊂ X, representing potential causes, along with outcome variables identified as E ⊂ X. The primary objective of causal inference will be to assess and quantify the impact of C on E and utilize the impact to trace back the potential states. To concise the training process, our method absorbs the benefits from fuzzy logic concepts and processes the computed proportion data of the gases (the outcomes of Eq. 1-5) into six intervals, denoted as X1 to X6, effectively representing severity. Consequently, the input of the model will, therefore, become the interval index. Its primary objective is to learn how the gas release severity reflects the current state type.
As mentioned previously, this study adopts BNs as the framework of the causal model conduction, due to the benefits such as their capability for the reversal of inference. BNs are characterized by a graphical structure denoted as G=(V, A), which forms a directed acyclic graph (DAG). In which, V = {X1, X2, … , Xn}, refer to the set of nodes and A refer to the set of arcs. By utilizing the dependency structure in the Directed Acyclic Graph (DAG) and the Markov property, the joint probability distribution of a Bayesian Network (BN) can be broken down into a set of local probability distributions. In this situation, each random variable Xi on its direct parents ΠX:
Learning the Bayesian network from the data requires two steps: structure learning and parameter learning (Diehl et al., 2021). Structure learning is dedicated to learning the graphical structure G=(V, A). Refer to Figure 4, learning the structure of the BNs is to identify the different types of failures associated with the proportion of the target gases. There are two families of the most common methods to learn the graphical model including constraint-based algorithms and score-based algorithms. Constraint-based algorithms consider conditional independence constraints, whereas score-based algorithms generate multiple potential causal graphs, assign scores to each, and ultimately choose a final graph based on these scores (Shen et al., 2020). In this research, the score-based algorithm was chosen because, despite its higher computational time demands, it has been demonstrated to exhibit greater accuracy in learning causal structures (Shen et al., 2020). It is important to highlight that acquiring reliable assumptions regarding causal relationships represents a significant challenge within the broader domain of causal inference (Sharma et al., 2021). The gold standard causal structure for the transformer system was not available. As a result, the resulting causal structure will be presumed correct or manually adjusted based on domain knowledge.
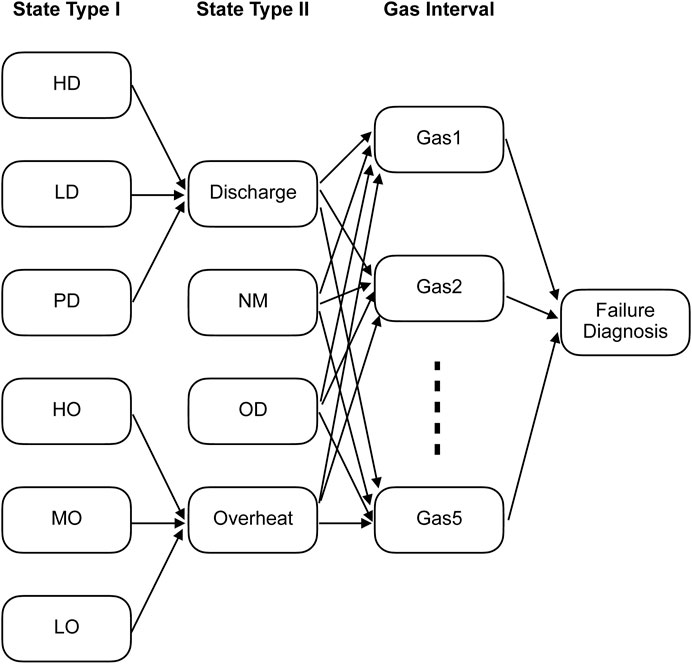
Figure 4. General causal model for transformer failure diagnosis.
Ji et al. (2015) indicate that structural learning is about the exploration of casual relationships among a multitude of variables, and parametric learning focuses on the estimation of conditional probability tables, which capture probabilistic relationships between variables. Moreover, the computation of the desired probabilities within the model becomes feasible only once both the structure and parameters have been defined. In this study, the maximum likelihood estimator will be employed to construct a conditional probability table, leveraging the previously established network structure.
In this research, the causal model utilizes the BNs to compute the possibility of the occurrence of the states. By training the historical data of the transformers, the model will be able to determine the occurrence probabilities of each state, based on the conditional probability tables s. The probability of occurrence is computed from the formula (6) ultimately enabling the diagnosis of transformer failures.
In this approach, BNs were employed as the causal model to calculate the occurrence probability of the states. By inputting and processing gas production data from power transformers, the model determines the probability of each state based on conditional probability tables. The probability of occurrence is computed according to the formula (6), enabling the diagnosis of transformer faults. To address data limitations, the model simplifies training by streamlining the inference process. In Figure 3, fault types are initially classified through expert knowledge into fault type I and fault type II, addressing diagnostic challenges and enhancing accuracy. The proposed method enables multi-layer fault diagnosis and traceability for current power transformers, identifying fault types through intelligent and interpretable reasoning based on known gas production conditions.
The testing revolves around the utilization of 96 authentic samples, which involve the transformers in 110 kV, 220 kV, 330 kV, 500 kV, and 750 kV. Each of these testing samples has been painstakingly labelled with its corresponding failure type. The primary objective of this testing is to examine our diagnosis model by analyzing these data and then comparing its diagnostic results with the existing labelled state types. The following presents an example of the testing of the proposed model.
Taking an example using the data in Table 6, the system follows the evaluation procedure (as shown in Figure 4) during the diagnostic process.
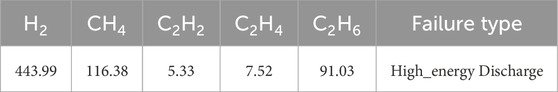
Table 6. An example of the testing dataset.
The probabilities of occurrence for each STATE TYPE II are illustrated in Table 7.
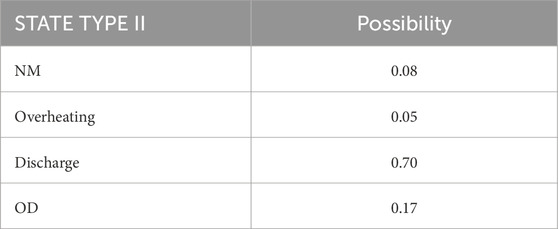
Table 7. List of possibilities for each State Type II.
It can be seen that Discharge presents the highest possibility of occurrence. Therefore, the system will then move to STATE TYPE II, and diagnose the failure among HD, LD, and PD. The probabilities of occurrence for each STATE TYPE I are illustrated in Table 8.
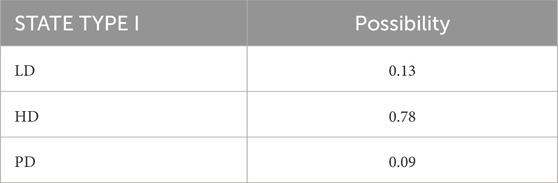
Table 8. List of possibilities for each State Type I.
After the BN inference, posterior probabilities given by the network are presented in TABLE8. In this table, the posterior probability of the high_energy discharge is 0.78, a higher probability compared to the probability of low_energy discharge (0.13) and partial discharge (0.09). Based on this inference, the model is possible to make a conclusive decision, confirming the state type as high_energy discharge. The actual description of the state is a high_energy discharge caused by the solder joints of the potential connection wire falling off, and the diagnosis results are consistent with it.
The objective of the testing is to evaluate the diagnostic accuracy of the system in identifying and classifying transformer failures. In the assessment of the testing, four systems were tested by analyzing 96 individual samples. The results are listed in Table 9. The Equation of accuracy and % unsolved is as follows:
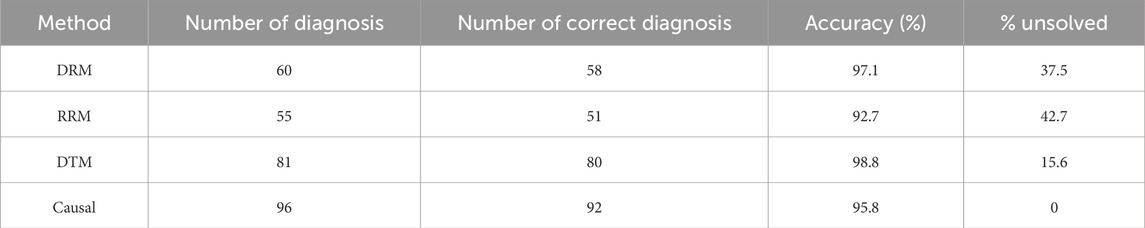
Table 9. Number of correct diagnosis among different methods.
The evaluation outcomes presented in Table 9 indicate that among the evaluated methods, the DTM achieves the highest level of accuracy. While DRM, RRM, and DTM all demonstrate commendable accuracy, the %Unsolved indicates that they encounter challenges in diagnosing certain scenarios, particularly NM conditions. For instances, these methods can not identify an ‘NM’ state, consistently indicating the presence of a fault instead. Moveover, when certain gas combinations fall outside the designated value range upon calculation, DRM and RRM was inpossible to identify the fault type. Consequently, their diagonosis presents a sector of unsolved.
The proposed causal system attained an impressive accuracy rate of 92 out of 96 cases. It not only showed good accuracy compared to conventional methods but also demonstrated the capability to discern system failures. Moreover, both RRM and DRM present less accuracy in diagnosing the LO condition while DTM and Causal method performs better. It is important to acknowledge that variations in the testing dataset contributed to differences in accuracy. Despite this, the results clearly show that the model accurately identified the state types in almost all tested instances across various transformer types, underscoring its practical effectiveness. Besides, unlike the one-size-fits-all approach of conventional methods, the proposed method presents the probabilities of occurrence of all states and provides higher flexibility for more personalized and accurate assessments.
To explore the failures, notably, in some instances, failures occur when the actual failure type is the second most likely failure type predicted by the system. Moreover, failures also happen during the distinction between HO and MO. One possible reason might be the challenge due to the variability in the data. Temperature measurements in real-world transformer operations can fluctuate, making it difficult to establish clear thresholds for categorization. The employment of interval data prepossessing would also affect the accuracy of the system, the exact distinction of each interval should be tuned manually. This highlights a potential area for further improvement or manual involvement in the diagnostic process. Besides, these situations highlight the advantage of utilizing BNs in this diagnostic context, which is the transparency it offers across all possible scenarios. This transparency can be instrumental in understanding the system’s reasoning and decision-making process, enabling engineers and experts to analyze and intervene when necessary, further enhancing the system’s diagnostic capabilities. Besides, the proposed Bayesian model offers the added benefit of simultaneous diagnosis of two failures, for example, the diagnosis of OD.
This paper proposes an approach to transformer failure diagnosis based on the relationship between dissolved gases in transformer oil and the type of failures in electric power operations. While previous studies primarily focused on failure classification, this study proposes an approach integrating causality and the DGA framework to infer power transformer failures. The proposed causal reasoning method can diagnose all potential transformer states, accounting for varying degrees of severity in both electrical and thermal failures. By comparing with the conventional ratio-based DGA methods including DTM, DRM, and RRM, the system was tested with a good accuracy of 95.8%. Furthermore, our model demonstrates proficiency in diagnosing various types of failures from different types of transformers, offering robust failure detection and classification, and the ability to diagnose multiple failures simultaneously. Besides, this study also extends the applicability of causal reasoningin the domain of power systems. Future work will explore the failure prediction by employing the time-series data.
The raw data supporting the conclusion of this article will be made available by the authors, without undue reservation.
FJ: Writing–original draft, Project Administration. ZM: Writing–review and editing, Data curation and Resources. QC: Conceptualisation, Methodology, Data curation, Writing–original draft. FZ: Funding acquisition, Writing–review and editing. DZ: Writing–original draft, Writing–review and editing.
The author(s) declare financial support was received for the research, authorship, and/or publication of this article. This work was supported by the Science and Technology Program of the Headquarters of State Grid Corporation of China, Research on Causal Reasoning Technology Based on the Electric Power Equipment Knowledge Graph, under Grant 5700-202255291A-2-0-QZ. The funder was not involved in the study design, collection, analysis, interpretation of data, the writing of this article, or the decision to submit it for publication.
The authors declare that the research was conducted in the absence of any commercial or financial relationships that could be construed as a potential conflict of interest.
All claims expressed in this article are solely those of the authors and do not necessarily represent those of their affiliated organizations, or those of the publisher, the editors and the reviewers. Any product that may be evaluated in this article, or claim that may be made by its manufacturer, is not guaranteed or endorsed by the publisher.
Aizpurua, J. I., Catterson, V. M., Stewart, B. G., McArthur, S. D., Lambert, B., Ampofo, B., et al. (2018). Power transformer dissolved gas analysis through bayesian networks and hypothesis testing. IEEE Trans. Dielectr. Electr. Insulation 25, 494–506. doi:10.1109/tdei.2018.006766
Ali, M. S., Bakar, A. H. A., Omar, A., Jaafar, A. S. A., and Mohamed, S. H. (2023). Conventional methods of dissolved gas analysis using oil-immersed power transformer for fault diagnosis: a review. Electr. Power Syst. Res. 216, 109064. doi:10.1016/j.epsr.2022.109064
Bakar, N. A., Abu-Siada, A., and Islam, S. (2014). A review of dissolved gas analysis measurement and interpretation techniques. IEEE Electr. Insul. Mag. 30, 39–49. doi:10.1109/mei.2014.6804740
Diehl, M., Paxton, C., and Ramirez-Amaro, K. (2021). “Automated generation of robotic planning domains from observations,” in 2021 IEEE/RSJ International Conference on Intelligent Robots and Systems (IROS) (IEEE), 6732–6738.
Diehl, M., and Ramirez-Amaro, K. (2022). Why did i fail? a causal-based method to find explanations for robot failures. IEEE Robotics Automation Lett. 7, 8925–8932. doi:10.1109/lra.2022.3188889
Duval, M. (2008). The duval triangle for load tap changers, non-mineral oils and low temperature faults in transformers. IEEE Electr. Insul. Mag. 24, 22–29. doi:10.1109/mei.2008.4665347
Dwiputranto, T. H., Setiawan, N. A., and Adji, T. B. (2021). “Dga-based early transformer fault detection using ga-optimized ann,” in 2021 International Conference on Technology and Policy in Energy and Electric Power (ICT-PEP) (IEEE), 342–347.
Feng, S., Yan, X., Sun, H., Feng, Y., and Liu, H. X. (2021). Intelligent driving intelligence test for autonomous vehicles with naturalistic and adversarial environment. Nat. Commun. 12, 748. doi:10.1038/s41467-021-21007-8
Gouda, O. E., Salem, S., and El-Hoshy, S. H. (2016). Power transformer incipient faults diagnosis based on dissolved gas analysis. TELKOMNIKA Indones. J. Electr. Eng. 17, 10–16. doi:10.11591/ijeecs.v16.i3
Guo, C., Dong, M., and Wu, Z. (2019). “Fault diagnosis of power transformers based on comprehensive machine learning of dissolved gas analysis,” in 2019 IEEE 20th International Conference on Dielectric Liquids (ICDL) (IEEE), 1–4.
Ji, Z., Xia, Q., and Meng, G. (2015). “A review of parameter learning methods in bayesian network,” in Advanced Intelligent Computing Theories and Applications: 11th International Conference, ICIC 2015 Proceedings, Part III 11, Fuzhou, China, August 20-23, 2015 (Springer), 3–12.
Jongvilaikasem, K., Pattanadech, N., Wattakapaiboon, W., Kando, M., Maneerot, S., and Pannil, P. (2022). The comparison of dga interpretation techniques application for actual failure transformer inspections including experience from power plants in Thailand. Int. J. Electr. Eng. Inf. 14, 224–233. doi:10.15676/ijeei.2022.14.1.14
Kari, T., Gao, W., Zhao, D., Zhang, Z., Mo, W., Wang, Y., et al. (2018). An integrated method of anfis and dempster-shafer theory for fault diagnosis of power transformer. IEEE Trans. Dielectr. Electr. Insulation 25, 360–371. doi:10.1109/tdei.2018.006746
Katooli, M. S., and Koochaki, A. (2020). Detection and classification of incipient faults in three-phase power transformer using dga information and rule-based machine learning method. J. Control, Automation Electr. Syst. 31, 1251–1266. doi:10.1007/s40313-020-00625-5
Lakehal, A., Ghemari, Z., and Saad, S. (2015). “Transformer fault diagnosis using dissolved gas analysis technology and bayesian networks,” in 2015 4th International Conference on Systems and Control (ICSC) (IEEE), 194–198.
Lewis, D. (1986). “Causal explanation,” in Philosophical papers vol. 2 (Oxford University Press), 214–240.
Li, J., Zhang, Q., Wang, K., Wang, J., Zhou, T., and Zhang, Y. (2016). Optimal dissolved gas ratios selected by genetic algorithm for power transformer fault diagnosis based on support vector machine. IEEE Trans. Dielectr. Electr. Insulation 23, 1198–1206. doi:10.1109/tdei.2015.005277
Li, Y., and Zhang, G.-J. (2016). “Combining conventional and artificial intelligence dga interpretation methods using optimized weighting factor,” in 2016 International Seminar on Intelligent Technology and Its Applications (ISITIA) (IEEE), 37–42.
Lu, Y., Zheng, Q., and Quinn, D. (2023). Introducing causal inference using bayesian networks and do-calculus. J. Statistics Data Sci. Educ. 31, 3–17. doi:10.1080/26939169.2022.2128118
Min, L. H., and Chang, C. (2009). “Application of dempster-shafer’s theory of evidence for transformer incipient fault diagnosis,” in 8th International Conference on Advances in Power System Control, Operation and Management (APSCOM 2009), Hong Kong, China, 08-11 November 2009 (IET). doi:10.1049/cp.2009.1844
Nogueira, A. R., Pugnana, A., Ruggieri, S., Pedreschi, D., and Gama, J. (2022). Methods and tools for causal discovery and causal inference. Wiley Interdiscip. Rev. data Min. Knowl. Discov. 12, e1449. doi:10.1002/widm.1449
North China Electric Power Research Institute (2021). Transformer oil chromatographic analysis and fault diagnosis case. Beijing, China: China Electric Power Press.
Özgür-Ünlüakın, D., Türkali, B., and Aksezer, S. Ç. (2021). Cost-effective fault diagnosis of a multi-component dynamic system under corrective maintenance. Appl. Soft Comput. 102, 107092. doi:10.1016/j.asoc.2021.107092
Pearl, J., and Mackenzie, D. (2018) The book of why: the new science of cause and effect. Basic Books.
Peters, J., Janzing, D., and Schölkopf, B. (2017). Elements of causal inference: foundations and learning algorithms. The MIT Press.
Rogers, R. (1978). Ieee and iec codes to interpret incipient faults in transformers, using gas in oil analysis. IEEE Trans. Electr. insulation 13, 349–354. doi:10.1109/TEI.1978.298141
Saravanan, D., Hasan, A., Singh, A., Mansoor, H., and Shaw, R. N. (2020). “Fault prediction of transformer using machine learning and dga,” in 2020 IEEE international conference on computing, power and communication technologies (GUCON) (IEEE), 1–5.
Sharma, A., Syrgkanis, V., Zhang, C., and Kıcıman, E. (2021). Dowhy: addressing challenges in expressing and validating causal assumptions. arXiv preprint arXiv:2108.13518.
Shen, X., Ma, S., Vemuri, P., Simon, G., Weiner, M. W., Aisen, P., et al. (2020). Challenges and opportunities with causal discovery algorithms: application to alzheimer’s pathophysiology. Sci. Rep. 10, 2975. doi:10.1038/s41598-020-59669-x
Stenkovski, T., Mojsoska, N., and Arapinoski, B. (2022). Methods of analysis of dissolved gasses in transformer oil, 1–4.
Stuart, E. A. (2010). Matching methods for causal inference: a review and a look forward. Stat. Sci. a Rev. J. Inst. Math. Statistics 25, 1–21. doi:10.1214/09-sts313
Syafruddin, H., and Nugroho, H. P. (2020). “Dissolved gas analysis (dga) for diagnosis of fault in oil-immersed power transformers: a case study,” in 2020 4rd International Conference on Electrical, Telecommunication and Computer Engineering (ELTICOM), Medan, Indonesia, 03-04 September 2020 (IEEE), 57–62.
Tomsovic, K., Tapper, M., and Ingvarsson, T. (1993). A fuzzy information approach to integrating different transformer diagnostic methods. IEEE Trans. Power Deliv. 8, 1638–1646. doi:10.1109/61.252690
Keywords: failure diagnosis, dissolved gas analysis, causality, ratio-based DGA, Bayesian network (BN)
Citation: Jiao F, Ma Z, Chen Q, Zhang F and Zhao D (2024) A causal reasoning approach for power transformer failure diagnosis. Front. Energy Res. 12:1340421. doi: 10.3389/fenrg.2024.1340421
Received: 17 November 2023; Accepted: 03 May 2024;
Published: 14 June 2024.
Edited by:
Fuqi Ma, Xi’an University of Technology, ChinaReviewed by:
Quan Zhou, University of Birmingham, United KingdomCopyright © 2024 Jiao, Ma, Chen, Zhang and Zhao. This is an open-access article distributed under the terms of the Creative Commons Attribution License (CC BY). The use, distribution or reproduction in other forums is permitted, provided the original author(s) and the copyright owner(s) are credited and that the original publication in this journal is cited, in accordance with accepted academic practice. No use, distribution or reproduction is permitted which does not comply with these terms.
*Correspondence: Qikun Chen, cWlrdW4uY2hlbkBnbGFzZ293LmFjLnVr
Disclaimer: All claims expressed in this article are solely those of the authors and do not necessarily represent those of their affiliated organizations, or those of the publisher, the editors and the reviewers. Any product that may be evaluated in this article or claim that may be made by its manufacturer is not guaranteed or endorsed by the publisher.
Research integrity at Frontiers
Learn more about the work of our research integrity team to safeguard the quality of each article we publish.