 Muhammad Salman
 Brieuc Beguin
 Thomas Nyssen
 Grégoire Léonard
- Chemical Engineering, University of Liège, Liège, Belgium
Compared to conventional monoethanolamine (MEA), alternative solvents are expected to substantially contribute to reduce the energy demand of post-combustion CO2 capture from flue gases. This study presents a comprehensive techno-economic analysis of a 27 wt% 2-amino-2-methyl-1-propanol (AMP) + 13 wt% piperazine (PZ) aqueous solution for CO2 capture, compared to a 30 wt% MEA solution. The study addresses the retrofit of a carbon capture unit to a biomass-fired combined heat and power (CHP) plant, effectively making it a bioenergy with a carbon capture and storage (BECCS) system. The treated flue gas has a flow rate of 23 tons/hour (t/h) with 11.54 vol% CO2 and a 90% capture rate is aimed for. Aspen Plus V14 was employed for process simulations. Initially, binary interaction parameters for AMP/PZ, AMP/H2O, and PZ/H2O are regressed using vapor-liquid equilibrium (VLE) data, which were retrieved from literature along with reaction kinetics. Validation of parameters from available experimental literature yields an average absolute relative deviation (AARD) of only 5.9%. Afterwards, a process simulation model is developed and validated against experimental data from a reference pilot plant, using a similar AMP/PZ blend, resulting in 5% AARD. Next, a sensitivity analysis optimizes operating conditions, including solvent rate, absorber/stripper packing heights, and stripper pressure, based on regeneration energy impact. Optimized results, compared to MEA, reveal that AMP/PZ reduces the energy consumption from 3.61 to 2.86 GJ/tCO2. The retrofitting of the capture unit onto the selected CHP plant is examined through the development of a dedicated model. Two control strategies are compared to address energy unavailability for supplying the capture unit. The analysis spans 4 months, selected to account for seasonal variations. At nominal capacity, CO2 emissions, rendered negative by biomass combustion and CO2 capture, reach a maximum of −3.4 tCO2/h compared to 0.36 tCO2/h before retrofitting. Depending on the control strategy and CHP plant operating point, the Specific Primary Energy Consumption for CO2 Avoided (SPECCA) ranges from 4.91 MJ/kgCO2 to 1.76 MJ/kgCO2. Finally, an economic comparison based on systematic methodology reveals a 7.87% reduction in capture cost favoring the AMP/PZ blend. Together, these findings highlight AMP/PZ as a highly favorable alternative solvent.
1 Introduction
Most of the world’s heat and power are currently produced from fossil fuels, resulting in significant CO2 emissions that contribute substantially to global warming (IEA, 2021). Low-emission fuels such as biomass significantly improve the carbon footprint of energy generation. For instance, the life cycle emission (LCE) factor for a biomass-fired power plant typically ranges from 35 to 178 gCO2/kWhel, while a natural gas equivalent emits approximately 607.6 gCO2/kWhel (Varun et al., 2009). Enhancing fuel conversion efficiency is another key factor in reducing carbon footprint. Combined heat and power (CHP) plants have effectively achieved this by converting primary energy source into multiple products, like heat and electricity. Using biomass as fuel amplifies these advantages. Additionally, integrating carbon capture units into CO2 emitters offers another effective approach to mitigate emissions. The combination of carbon capture technology with biomass-fired plants is one promising example of Bioenergy with Carbon Capture and Storage (BECCS). By capturing CO2 emissions during biomass combustion, BECCS facilitates negative emissions, thereby reducing atmospheric CO2 levels. However, the credibility of this approach hinges on effective carbon management and comprehensive accounting of life cycle emissions. Despite its theoretical nature and limited demonstrations, negative emissions via BECCS is highlighted by the IPCC as a crucial strategy to achieve the goals outlined in the Paris Agreement (IPCC, 2023). Among other emission reduction strategies, BECCS stands out as one of the most prevalent in many mitigation scenarios (Fuss et al., 2016).
One of the key factors in this aspect is the selection of the right technology for CO2 capture. Various technologies exist, each with different technology readiness levels (Rubin et al., 2012). Among these, post-combustion capture (PCC) through chemical absorption processes is widely studied for use in combination with power plants. It is the most mature technology, exhibiting exceptional versatility in its applicability to various processes. Furthermore, it is particularly well-suited for achieving higher capture rates at an industrial scale (Khan et al., 2023). One significant advantage of PCC is its retrofit capability for existing power plants without disrupting ongoing operations, provided that spatial constraints are met. However, technologies such as membrane separation have lower environmental impacts compared to chemical absorption (Wang et al., 2023). Despite this, the capture cost for achieving higher recoveries in large-scale implementations of other technologies remains considerably high compared to absorption (Zanco et al., 2021).
The chemical absorption process itself, though cheaper than other technologies, is a costly and energy-intensive process and is largely influenced by solvent selection (Herzog et al., 2009). Optimal solvent selection, aiming to minimize costs and energy consumption, requires pilot-scale testing, process simulation, and energy integration studies (Wang et al., 2011). In this study, we will address all three aspects to assess the performance of a 2-amino-2-methyl-1-propanol (AMP) and piperazine (PZ) blend as a promising alternative solvent for CO2 capture solvent.
30 wt% monoethanolamine (MEA) is the prevalent amine-based solvent for PCC. Nonetheless, MEA has disadvantages, including corrosiveness, high regeneration energy demands, and issues with degradation and evaporative losses (N.Borhani and Wang, 2019). The specific energy consumption for MEA-based carbon capture typically ranges from 3.7 to 4.1 GJ per ton of CO2, which necessitates diverting energy from plant production, thereby diminishing power plant efficiency (Dave et al., 2011). To address these challenges, alternative solvents can be utilized for PCC in conjunction with optimized process designs and energy integration within the retrofitted power plant. Extensive research has been done to study alternative solvents for amine-based PCC. Xue et al. (2017) studied the performance of diethanolamine (DEA) and reported a 3.17 GJ/tCO2 reboiler duty which, compared to MEA, results in 0.38%–4.61% lower energy consumption. Aroonwilas and Veawab. (2009) reported that a 2:1 M ratio blend of AMP with MEA, respectively, can decrease reboiler duty from 3.46 GJ/tCO2 (MEA) to 3.15 GJ/tCO2.
Recently, aqueous blends containing AMP have gained a lot of attention as an alternative to conventional MEA (Brúder et al., 2011). Indeed, utilizing sterically hindered primary, secondary or tertiary amines such as AMP can twice increase the CO2 absorption capacity compared to conventional amines like MEA (Sartori and Savage, 1983). Additionally, it is worth noting that the reaction of MEA with CO2 results in the formation of a stable carbamate, while in the case of AMP, most of the reacted CO2 is converted into carbonate and bicarbonate ions, leading to a reduced need for regeneration energy (Saha et al., 1999). However, MEA exhibits a higher mass transfer rate for CO2 compared to AMP (Tontiwachwuthikul et al., 1992). To enhance the absorption of CO2 in AMP, different blends of amines or activators can be employed. A blend of AMP with MEA or DEA can increase its rate of reaction and the absorption of CO2 (Mandal and Bandyopadhyay, 2006). Lee et al. (2012) suggested that utilizing an aqueous solution of 1,8-diamino-p-menthane with a blend of AMP/MEA can increase the rate of absorption by 9.3%. Another interesting option to enhance the performance of AMP is to use PZ as an activator. It is known to significantly promote the reactions of MEA, methyl diethanolamine (MDEA) and AMP due to its cyclic diamine structure (Bishnoi and Rochelle, 2002b). Each mole of PZ can theoretically bind with 2 mol of CO2 (Bishnoi and Rochelle, 2000). When combined with AMP, PZ is expected to maximize the equilibrium cycle capacity (CO2 loading ability) of AMP, enhance the reaction rate, and maintain low regeneration energy requirements, showing better performance than other options to enhance capture performance (Samanta and Bandyopadhyay, 2009; Zhang et al., 2018).
A blend of sterically hindered amines and diamines, composed of 28 wt% AMP and 17 wt% PZ, known as CESAR1, was developed under the European Union-funded CESAR project (CESAR, 2011). Detailed pilot-scale tests on CESAR1’s performance were conducted by (Mangalapally and Hasse, 2011), by varying parameters such as liquid-to-gas ratio (L/G), flue gas flow rate, and CO2 partial pressure. Results showed that CESAR1 requires 20% less energy and uses 40% less solvent compared to conventional MEA. Artanto et al. (2014) studied the blend of 25 wt% AMP and 5 wt% PZ in a pilot plant for CO2 capture from coal-fired power stations. The blend was compared to conventional MEA by varying absorber L/G ratio while keeping CO2 lean loading constant, revealing an optimal lower L/G for reduced reboiler duty. The study suggested that further enhancements can be achieved by increasing solvent concentration and modifying process configurations. Furthermore, the International Energy Agency Greenhouse Gas R&D program (IEAGHG) introduced a new benchmark solvent for chemical absorption, comprising 27 wt% AMP and 13 wt% PZ (IEAGHG, 2019). According to the report, this blend significantly reduces reboiler duty during regeneration and lowers CO2 avoidance costs by 22% for coal-fired and 15% for gas-fired power plants.
Another critical attribute of solvents in the absorption/regeneration process is their susceptibility to thermal degradation due to the high regeneration temperatures. Studies indicate that similar to MEA, AMP/PZ blends also exhibit greater resistance to such thermal degradation. Li et al. (2013) characterized a 16 wt% AMP +7.5 wt% PZ blend for CO2 capture, showing that degradation of the blend began at around 127°C. Similarly, Freeman’s study of a 21 wt% AMP +14 wt% PZ blend identified the initial degradation of the solvent blend at 135°C (Freeman and Rochelle, 2012). Hence, based on these findings, it can be concluded that AMP/PZ blends can effectively operate at temperatures below 127°C–135°C, making them a competitive alternative to MEA.
While significant research has been conducted through experimental and pilot-scale studies on the performance of AMP/PZ, detailed process simulations, parametric optimization, and economic analysis are essential to grasp the scale-up potential and commercial viability of this solvent. Although numerous authors have compared the performance of selected blends, a holistic techno-economic comparison of such amine blends is still lacking (Aghel et al., 2022; Ding et al., 2023). Notz et al. (2011) conducted an initial process simulation study to assess the performance of the AMP/PZ blend, drawing from the CASTOR project (CASTOR, 2008), employing a short-cut model approach. The model was based on the thermodynamics and chemistry of the solvent and needed only solubility data, the heat of both absorption and regeneration, and the solvent thermal capacity to provide an initial estimate of the regeneration energy of the blend. Nevertheless, this work lacked a comprehensive mass and energy balance analysis at the process level. Sanchez Fernandez et al. (2014) developed a thermodynamic process simulation model for PCC using AMP/PZ as the solvent, comparing results with conventional MEA. They utilized the Aspen properties databank, which offered e-NRTL parameters for AMP and PZ. However, as noted by Hermann (2014), these datasets yielded less accurate predictions of solvent performance. Similarly, Van der Spek et al. (2016) constructed a process simulation model for the AMP/PZ solvent in PCC, using Procede Process Simulator (PPS) software to evaluate process performance. According to their findings, the use of the AMP/PZ blend could significantly reduce reboiler duty to 2.9 GJ/tCO2, notably lower than conventional MEA at 3.6 GJ/tCO2. Likewise, cooling duty decreased to 3.4 GJ/tCO2 from 4.1 GJ/tCO2. However, as indicated by the authors, though the predicted results are very precise, there is still room for improvement in the development and validation of the model from the point of view of reducing the uncertainties and increasing the accuracy of the results.
Ding et al. (2023) conducted an economic analysis of different amine blends (MEA/MDEA, PZ/MEA, and PZ/MDEA) in comparison to standard MEA. They optimized stripper pressure and lean solvent loading for cost efficiency, revealing PZ/MDEA as the most economical. This blend lowered the annualized capture cost from 41.36 $/tCO2 to 31.43 $/tCO2. Nwaoha et al. (2018) studied an AMP-PZ-MEA blend within the context of a cement plant. The capture cost of the MEA-based process peaked at 93.2 $/tCO2 while the blend reached 77.3 $/tCO2. Meanwhile, Manzolini et al. (2015) compared the economic performance of MEA with the CESAR1 blend in advanced coal and natural gas power plants. The blend outperformed MEA by reducing the CO2 avoidance cost from 45.9 €/tCO2 to 39.2 €/tCO2 for coal plant and 49.0 €/tCO2 to 46.8 €/tCO2 for natural gas plant. Hence, in light of the previous research, this study aims to delve further into exploring the techno-economic advantages of employing a blend of 27 wt% AMP +13 wt% PZ–as recommended by (IEAGHG, 2019)–in a PCC unit coupled to a biomass-fired CHP plant, effectively investigating the potential of BECCS with the promising blend.
First, a precise thermodynamic model is developed to predict binary interactions between components, including AMP/H2O, PZ/H2O, and AMP/PZ. To achieve this, the most up-to-date vapor-liquid equilibrium (VLE) data is retrieved from the literature to compute updated e-NRTL binary interaction parameters for the solvent system. Subsequently, a detailed process simulation model of a PCC unit is developed and validated against available experimental data from the literature. Its optimal operating conditions are identified thanks to a comprehensive sensitivity analysis conducted on key process variables, with a focus on minimizing energy consumption. To compare its performance to a reference solvent, the work is also conducted for a MEA-based capture system. In particular, the energy consumption of both solvents is compared.
Second, a case study is introduced to see how each solvent would fare in a realistic situation. The case study is based on a biomass-fired CHP plant located on the Liège University campus. The impact of retrofitting a capture unit on the existing plant is assessed and two control strategies are evaluated over four selected months.
Third, a systematic economic analysis is carried out on the case study to evaluate capital expenditures (CAPEX) and operating expenditures (OPEX), ultimately providing capture costs for both MEA and AMP/PZ systems.
2 PCC process description and thermodynamic simulation model
2.1 Process description
The process flow diagram of an amine-based CO2 capture process is depicted in Figure 1. This configuration is utilized for both model validation and optimization studies involving both AMP/PZ and MEA solvents. The process starts with cooling high-temperature flue gas to 45°C using a direct contact cooler, followed by a slight pressure increase to 1.08 bar using a blower, to accommodate pressure losses in absorber. In the absorber, CO2 is captured from the flue gas by the solvent introduced at the top, with clean gas exiting after passing through a washing section. Recirculated washing water, supplemented with makeup water, helps maintain the water balance. The rich solvent, leaving the bottom of the absorber, is pumped and then heated approximately to 110°C in a lean-rich heat exchanger (LRHX) before entering the stripper, which operates at 120°C to regenerate the solvent and releases CO2. The stripper pressure can be adjusted between 1 to 2.4 bar, as higher operating pressures reduce the process energy requirements (Léonard et al., 2015). However, higher temperatures can also lead to increased solvent degradation (Li et al., 2013), hence the need for a tradeoff with respect to the stripper pressure. This tradeoff is further discussed in Section 6.1.4. The lean solvent is recycled through the LRHX and cooled to 40°C before re-entering the absorber. A condenser removes water vapors from the captured CO2, yielding a purified stream. This study focuses solely on CO2 capture and does not address storage or utilization. However, it includes a compression train to anticipate future CO2 handling. This train gradually increases the pressure of the purified CO2 stream to 152.4 bar, suitable for storage applications like the Porthos project in the North Sea (Porthos, 2023).
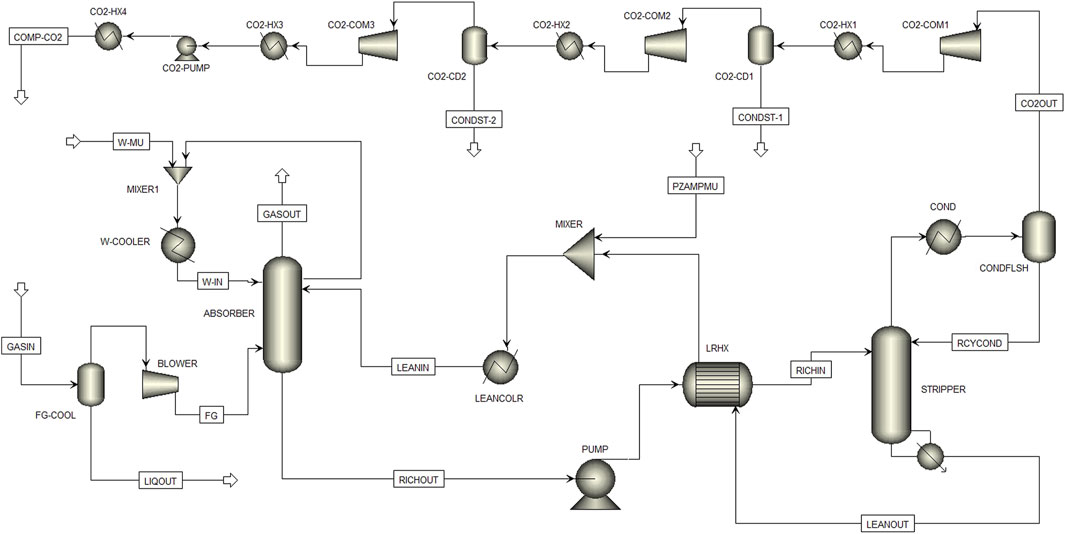
Figure 1. Process flow diagram of solvent-based PCC Unit.
2.2 Development and validation of thermodynamic and kinetic models for the AMP/PZ solvent
The kinetic model for MEA-based carbon capture was previously summarized in our work (Léonard et al., 2015). However, CO2 absorption kinetics in AMP/PZ blends have received less attention in the literature. In this section, we develop a thermodynamic and kinetic model for the AMP/PZ solvent and validate it based on existing literature.
For this purpose, the process simulation software Aspen Plus V14 is used with the e-NRTL property method. This method combines the electrolyte version of the NRTL approach for the liquid phase and the Redlich Kwong equation of state for the vapor phase. To accurately perform calculations, the e-NRTL method requires the definition of binary interaction parameters for the CO2/AMP/PZ/H2O system using vapor-liquid equilibrium (VLE) data. The pre-existing NRTL binary interaction parameters from the Aspen Properties databank are not used in this work as they proved to inaccurately reproduce literature values, as discussed below.
To address this, three distinct VLE datasets are acquired from the literature and used to calculate the e-NRTL binary interaction parameters thanks to the Aspen Properties regression tool. Table 1 presents the selected binary interaction parameters alongside their respective sources.
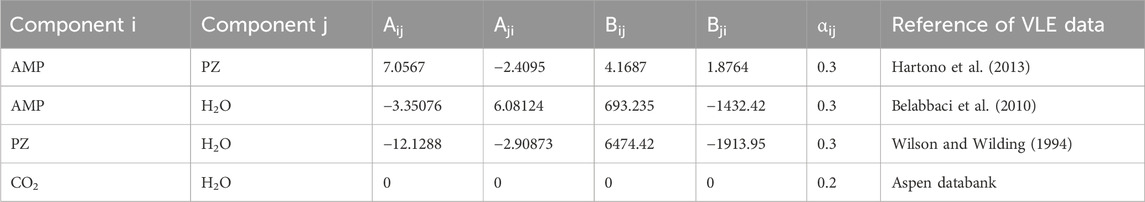
Table 1. Binary interaction parameters of the components, calculated by regression through Aspen Plus regression tool.
Following the calculation of binary interaction parameters, the accuracy of the regression is assessed. To do this, the binary VLE data for the AMP/H2O system is compared with the original dataset of (Belabbaci et al., 2010) and the VLE data of (Hartono et al., 2013) for the AMP/H2O system as illustrated in Figure 2. Additionally, the binary VLE data using default parameters from the Aspen databank is also included for reference.
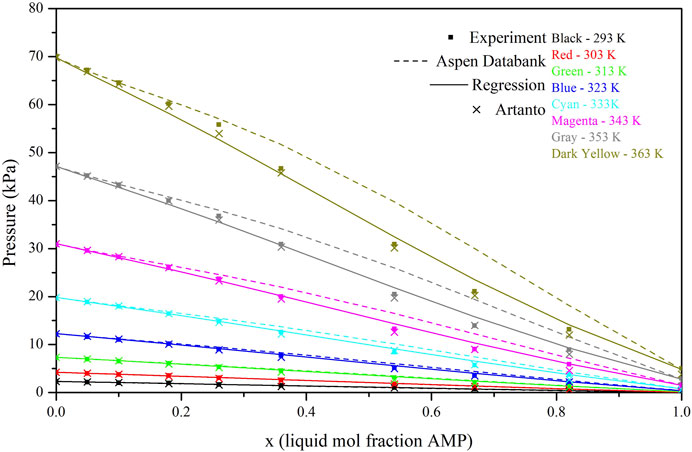
Figure 2. P-x curves of AMP/H2O system for four datasets at different temperatures. Circle markers represent the experimental work of Belabbaci, cross markers represent experimental work of Hartono, solid lines represent the new regression, and the dashed lines represent the dataset generated from Aspen Databank.
The figure shows that the regressed data deviates slightly from the experimental datasets. However, it provides a more accurate representation compared to the VLE model using the Aspen databank, which exhibits more substantial deviations from the experimental values. To compare this difference mathematically, average absolute relative deviation (AARD) has been calculated between these datasets, using the following equation:
Where N is the number of values, xi,cal is the calculated value of the parameter for the ith component and xi,ref is the value of the experimental parameter (bubble pressure in this case) retrieved from the literature. The calculated AARD for the regressed dataset amounts to 4.7% from the values of Belabbaci and 7.1% from the values of Hartono (combinedly 5.9%), while in the case of default Aspen databank values, it reaches 8.76% and 10% from values of Belabbaci and Hartono respectively. This comparison depicts the improved accuracy of the proposed regressed model.
Next, the Aspen Plus RadFrac block model, which is based on the RateSep model, is used to model the absorber and the stripper. However, to perform rate-based calculations using the RateSep model, the detailed reaction kinetics of the process are required. To calculate the rate of the reactions, power law expressions as presented in Eq. 2 are used.
Where r is the rate of reaction, k is the pre-exponential factor, n is the temperature exponent, Π is the product operator, N is the number of components, Ci concentration of the ith component and αi is the exponent of the ith component. The following reaction set is considered for the interaction of AMP (C4H11NO) and PZ (C4H10N2) with other components.
The kinetic parameters such as activation energy (E) and pre-exponential factor (k) for the aforementioned reactions are obtained from the literature and are presented in Table 2. These kinetic parameters can then be used as inputs for the reaction kinetics in simulations.
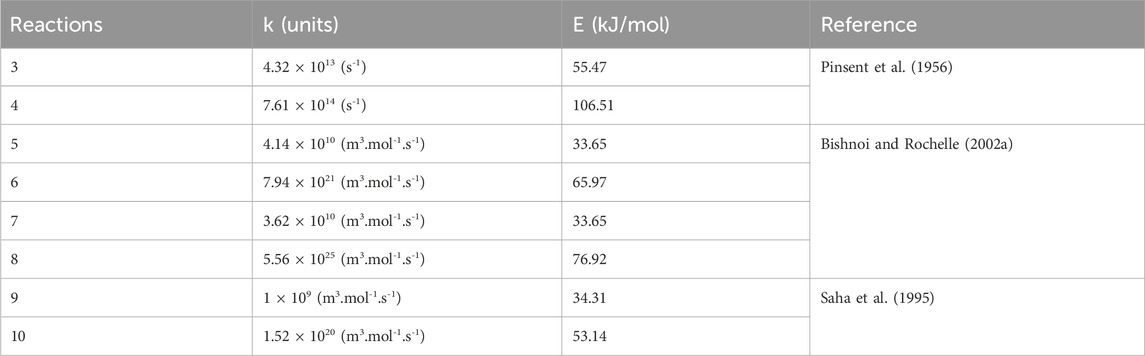
Table 2. Kinetic parameters of the reactions to be used as input in Aspen Plus.
The RateSep model can perform detailed mass and energy balance calculations while considering the reaction kinetics as well. As proposed by Bravo et al. (1992), various equations are being solved in the RateSep model such as mass and energy balance for vapor and liquid phases, estimation of coefficients of heat and mass transfer, and rates of interphase. For liquid holdup, the correlation of Stichlmair et al. (1989) is used and other relevant parameters are calculated using the per-default correlations available in Aspen Databank.
3 Validation of the AMP/PZ simulation model
To validate the simulation model, the experimental study conducted by Mangalapally and Hasse (2011) is used as a reference. In their study, CESAR1 solvent, consisting of 40 wt% (28 wt% AMP +17 wt% PZ), was employed in a pilot absorption-desorption PCC unit to treat flue gas from natural gas combustion. The flue gas flow rate ranged from 30–100 kg/h, with CO2 partial pressures varying between 35–135 mbar (3–14 vol% dry basis). The solvent flow rate was in the range of 75–275 kg/h. Both the absorber and stripper had a diameter of 0.125 m, with heights of 4.25 m and 2.25 m, respectively. Sulzer BX500 packing was utilized in both columns. To validate with their findings, the study focused on a specific condition, using 80 kg/h of flue gas and a CO2 partial pressure of 102 mbar (0.101 vol%), while keeping other parameters the same.
Three sets of operating conditions are simulated for validation in comparison with the experimental work: (1) capture rate, (2) effect of L/G on lean and rich loadings in the absorber and (3) effect of L/G on reboiler duty.
3.1 Capture rate
In their work (Mangalapally and Hasse, 2011), reached a 90% capture rate when the inlet CO2 partial pressure was at 102 mbar (CO2 mass flow rate in flue gas of 11.67 kg/h), the reboiler duty at 11.67 kW and the solvent flow rate at 232 kg/h. The model developed in this work yields a capture rate of 92% based on the same operating conditions, which is quite close to what was reported by the experimental study.
3.2 Absorber L/G vs. lean and rich loadings
The next step in the validation process is examining the impact of the L/G ratio in the absorber on rich and lean loadings. The solvent flow rate to the absorber is adjusted while keeping the gas flow rate constant. As seen in Figure 3, increasing the L/G ratio leads to higher lean loadings for both simulation and experimental data. This is consistent with expectations, as a higher solvent flow rate in the absorber can capture more CO2, thus reducing the required extent of solvent regeneration and allowing for a higher lean loading. Similarly, rich loading is higher at lower L/G ratios and decreases with an increase in L/G, which aligns with the lower delta loading observed at larger solvent flow rates.
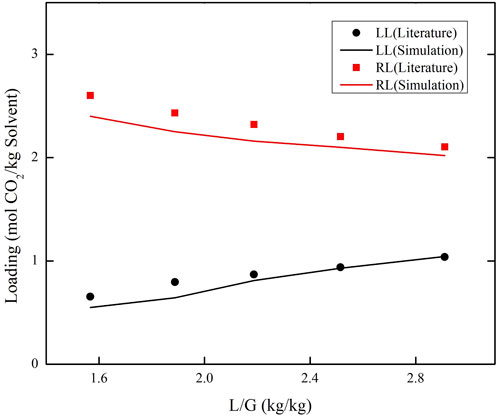
Figure 3. Effect of absorber L/G on the lean and rich loading in comparison with work of Mangalapally and Hasse (2011). The markers represent the experimental data from literature and the solid lines represent the simulation work.
Figure 3 shows that while the simulation results exhibit a slight deviation, they are overall in good agreement with the experimental data. The AARD between simulation and experiment is calculated to be 8.6% for the lean loading and 6.2% for the rich loading. This minor deviation is likely attributed to remaining inaccuracies in the thermodynamic model, as evidenced in Figure 2. In summary, these results validate the absorption performance of the solvent and the selection of kinetics and physical property parameters.
3.3 Effect of L/G on the reboiler duty
To accurately calculate the energy consumption and the corresponding operating costs in the PCC process, the model must precisely estimate energy consumption. To achieve this, we examine the impact of the absorber’s L/G ratio on the reboiler duty and compare it with experimental values. All other parameters are kept constant. As Figure 4 illustrates, increasing the L/G ratio initially leads to a decrease in reboiler duty, reaching a minimum, after which the reboiler duty begins to increase with further increases in the L/G ratio.
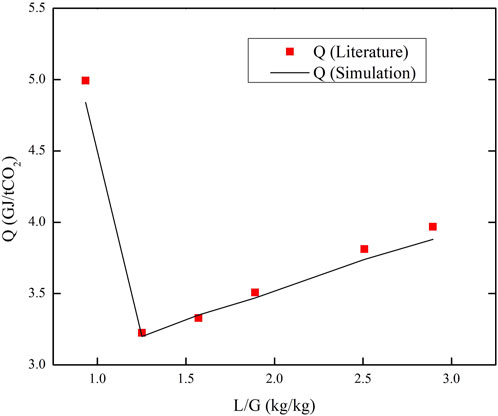
Figure 4. Effect of L/G on the reboiler duty. Markers represent the work of Mangalapally and Hasse (2011) while the solid line represents the work of this simulation.
To understand this effect, it is essential to grasp the different contributions to the heating duty of the stripper. Heat is required in the stripper for several purposes: (1) to elevate the temperature of the rich solvent stream and match the regeneration temperature, (2) CO2 desorption reaction heat, and (3) to generate steam in the reboiler as CO2 stripping agent (Léonard, 2009). At a constant capture rate, the reaction heat is changeless. At lower L/G ratios, when the lean loading is minimal, the driving force to strip the CO2 is lower, increasing the steam needs. This results in higher thermal energy requirements. Increasing the L/G ratio leads to a significant reduction in reboiler duty until it reaches a minimum, after which the reboiler duty begins to increase again. The increase in the latter part is attributed to the increased mass of solvent that needs to be heated, resulting in a higher energy requirement. Ultimately, the energy consumption calculated from the simulation aligns well with the literature, with an AARD of only 2%.
4 Case study of a CHP plant to be retrofitted with CO2 capture
4.1 Description
The developed process models can predict the energy consumption associated with each solvent. To enhance the comparison between the two competitors, it is valuable to frame their performance within a realistic case study. The biomass-fired CHP plant of the University of Liège (Sart-Tilman Campus, Belgium) is selected for this purpose. This plant produces heat to supply the local district heating network (DHN) and generates electricity with the leftover energy.
Its 12 MWth boiler is stoked by 2.5 tons/hour (t/h) of wood pellets and generates approximately 13 t/h of steam at 420°C and 42 bar. Steam is first expanded in a primary turbine to produce electricity and is then split between two subsystems: heat supply to the DHN (up to 7.4 MWth), and additional power generation using a secondary turbine (up to 2.4 MWel with both turbines). During operation, both figures vary in opposite directions according to the heating demand, which is the primary purpose of the plant. Part of the produced electricity is consumed onsite (around 0.4 MWel) while the remainder is sold to the grid. The biomass-fired furnace operates at nominal capacity most of the time. Heating demand peaks are absorbed by conventional, complementary gas boilers. More details on the CHP plant and its internals are available in (Sartor et al., 2014). At nominal capacity, the biomass boiler emits 23 t/h of flue gas, with the following composition: 11.54 vol% CO2, 11.19 vol% H2O, 70.51 vol% N2 and 6.753 vol% O2.
The case study focuses on the biomass-fired boiler of the CHP plant. The backup gas boilers are left outside of the scope. The following scenario is assumed: a solvent-based CO2 capture unit is retrofitted to the existing CHP plant to capture 90% of the emitted CO2 (3.73 t/h) while maintaining heat supply to the DHN as a priority. The heat demand of the capture unit is catered by steam, which is withdrawn from the thermodynamic cycle (between the two turbines) and the power demand is covered by the cogeneration production.
Depending on the DHN demand, the energy generated by the CHP plant might be insufficient to fulfill both the DHN and the capture unit requirements. In such cases, two control strategies can be implemented: (1) reducing the capture rate to match the available system consumption, and (2) maintaining a 90% capture rate while supplementing the deficit energy through natural gas combustion and grid power purchase. However, analysis indicates that electricity import is unnecessary during the examined periods.
The capture rate reduction can be used as a metric to evaluate the first strategy. Another penalty metric must be defined to quantify the impact of the capture unit on the existing CHP plant when the second control strategy is applied. This work considers the Specific Primary Energy Consumption for CO2 Avoided (SPECCA) (Campanari et al., 2010), defined as:
where HR is the heat rate of the plant (MJLHV/MWh), e is the CO2 emission rate (kgCO2/MWh), and
with
To evaluate the two proposed control strategies associated with the carbon capture retrofit, a simplified model of the CHP plant is developed using Engineering Equation Solver (EES), version 10. Each component of the thermodynamic cycle is modelled based on mass balance, energy balance, and several parameters that were identified during the design of the plant, such as turbine efficiencies or operating pressure levels. The simplified model evaluates the energy distribution within the plant by allocating steam between (1) heat supply to the DHN, (2) heat supply to the capture unit, and (3) electricity generation, in that order of priority. The model can then compute the capture rate, the cogeneration efficiency, the respective heat and power productions and the CO2 emissions of the system. These emissions encompass emissions from biomass combustion, emissions from additional gas combustion, and captured emissions, which are counted negatively. Emissions from biomass combustion and natural gas combustion are estimated based on locally applicable emissions factors: 30 kgCO2/MWhth, prim and 251 kgCO2/MWhth, prim (CWAPE, 2010), respectively.
When needed in the relevant control strategy, natural gas combustion will bring the missing energy to achieve 90% capture, but it automatically implies an increased primary energy consumption and increased CO2 emissions. The SPECCA formula (defined in Eq. 11) must then be adapted:
where
The simplified model of the CHP plant is used to evaluate both control strategies proposed in case of insufficient available energy: (1) lowering the capture rate and (2) supplying the missing energy thanks to natural gas combustion. The operation of the plant is simulated for four selected months which span over all seasons: August 2022 November 2022, February 2023 and May 2023. All results are presented in Section 6.2.
4.2 PCC unit inputs
The case study also provides the necessary inputs for the simulation models of the capture unit. The process description and the flow diagram of the PCC plant are presented in Section 2.1. The initial operating parameters of the equipment are presented in Table 3. It is worth noting that the capture rate is initially set at 90% for designing the PCC unit. This choice aligns with the nominal capture rate of the unit. However, during operation, the capture rate may be reduced if the first control strategy is implemented.
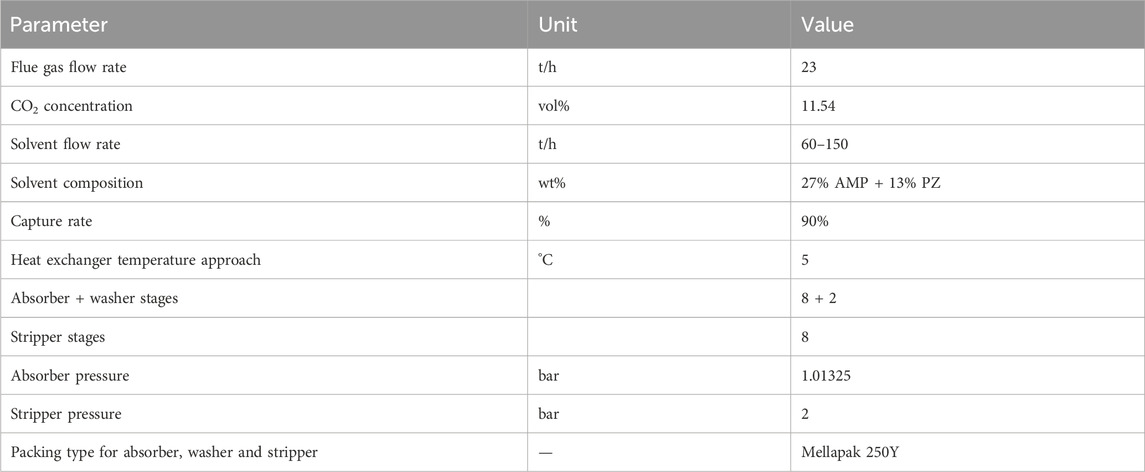
Table 3. Initial operating parameters.
To perform the process simulation, an equilibrium-based model of the columns, assuming that chemical and thermodynamic equilibria are fully achieved at each stage, is used at first. For the equilibrium model, 8 stages for the absorber and the stripper are taken as an initial guess. For the absorber, 2 additional stages for the washer are assumed and for the stripper, the top stage is assumed as washer since the rich solvent is being added at the second stage. The 90% capture rate is used as a design specification while the reboiler duty is set to vary. As mentioned in Table 3, Mellapak 250Y packing is used in the columns. For this packing, the range of pressure drop per unit height of the packing is 11.3–0.41 mbar/m. Furthermore, the 80% approach to flooding is also used in Aspen as a design factor. The holdup correlation, mass transfer method and interfacial area method of Bravo et al. (1993) are selected. Once the simulation converges successfully in equilibrium mode, the model is converted to the RateSep mode to find the relevant diameters and heights of the columns. Unlike the previous model, this model considers mass transfer limitations that take place in the packing. The parameters mentioned in Table 3 are also used as initial values. After simulating in rating mode, the calculated diameter for the absorber is 2 m and 1.2 m for the stripper. As mentioned in Section 2.1, the diameter of the absorber and washer should be the same, i.e., 2 m. Hence, the minimum water flow rate was set to 1.5 t/h to ensure satisfying conditions in the washer. The parametric optimization introduced in the following section aims at computing the height of both columns.
5 Methodology for techno-economic analysis
Within the frame of the selected case study, the simulation models can be used to perform a detailed techno-economic study. In particular, the optimal operating parameters, the energy consumption and the capture cost can be compared between the competing solvents. The relevant steps to perform this techno-economic analysis are presented hereunder.
5.1 Parametric optimization via sensitivity analysis
When designing the PCC process, the total energy consumption was selected as the primary governing factor. The largest energy consumers are the reboiler and the compression train. The energy allocated to the compression train only depends on the captured CO2 stream. Therefore, minimizing the total energy consumption at a given capture rate boils down to the optimization of the reboiler heat duty. It is affected by process parameters such as the solvent flow rate, the absorber and stripper heights, and the stripper pressure. To find their optimal value, a sensitivity analysis is performed for each of them while the other parameters, such as the flue gas flow rate, the inlet streams, the capture rate, and the diameters of the columns are kept constant at their nominal value.
5.2 Economic analysis
For a comprehensive comparison, it is crucial to conduct a fair economic evaluation based on the optimal design. The scope of this analysis is confined to the retrofitted carbon capture unit.
As identified in Section 4.1., the PCC unit might operate at part load or energy imports might be necessary. For the sake of simplicity, these cases are voluntarily excluded from the economic analysis, i.e., it is assumed that sufficient energy can be extracted from the CHP plant all year round to operate the PCC unit at its nominal point. The outcome of this assumption is an underestimated cost. However, these eventualities are addressed and discussed extensively in Section 6.2.
Several economic evaluation methods exist, of which the choice depends on the required preciseness. The most precise methods, such as assembling vendor quotes, require accurate sizing of all pieces of equipment and many design choices, both of which were not performed in this modelling work. Comparing two contenders requires a fair, common ground as well as systematicity. For these reasons, the methodology developed by Turton et al. (2012) was selected. It relies on empirical correlations together with estimation charts and correction factors. The governing principles and specific assumptions are explained hereafter, while the reader is referred to Turton et al. (2012) for an exhaustive, step-by-step description of the methodology.
5.2.1 Capital expenditures (CAPEX)
Capital expenditures (CAPEX) encompass all costs that precede the operation of a given plant: process engineering, purchase of equipment, construction, as well as installation.
The Turton methodology relies on a bottom-up approach. First, the individual purchase cost of each piece of equipment is estimated based on its capacity factor (e.g., the heat exchange area for a heat exchanger) while assuming operation at near-atmospheric pressure and the use of carbon steel as material.
Second, equipment-specific pressure factors are added to account for deviations from the previous assumption. Likewise, material factors are also included to reflect the cost difference between carbon steel and the selected material. In the present work, all pieces that are in contact with the amine solvent are assumed to be made of stainless steel. The remaining ones are made with carbon steel.
Third, the sum of individual costs is updated to the current economic reality. Tabulated data from the reference were curated in 2001. Inflation, technological maturity, and standardization have since reshaped the price ranges. To express an economic figure in today’s money, those effects must be accounted for. A reference index, namely, the Chemical Engineering Plant Cost Index (CEPCI), allows for this update:
The values of this index were taken from (Maxwell, 2023). Lastly, while off-the-shelf purchase, installation, insurance, and fire-proofing costs are included, unforeseen expenditures are anticipated by an additional 1.18 safety factor.
The calculated total capital cost (or CAPEX) can then be annualized over the
5.2.2 Operational expenditures (OPEX)
The annualized CAPEX is used to obtain a yearly cost together with the operational expenditures (OPEX). These include the costs of labor (
The plant is assumed to operate for 8,000 h over the course of a year. Because the capture unit is retrofitted to an operating, staffed facility, the required number of operators is assumed to be one per 8-h shift. This assumption is a tradeoff between the additional needs from the capture unit and the plausible training of the initial shift workers. This circumvents lightly the Turton methodology, which is based on the number of processing steps with solids, compressors and other specific pieces of equipment, but which is rather aimed at grassroots facilities. If a single employee can do 5 shifts per week, 46 weeks per year, a total of 5 workers must be hired. An annual salary of 80 k€ is assumed.
Regarding the raw material costs, it should be noted that solvent degradation is excluded from the calculation because it has not been included in the chemical model that forms the base of the simulation. However, solvent losses by flue gas entrainment can be extracted from the results and are included in the OPEX based on the following unit costs: 1.8 k€/tMEA (Jilvero et al., 2014), 2.48 k€/tAMP and 4.19 k€/tPZ (Lassagne et al., 2016).
The utilities cost includes the costs of cooling water and electricity, which volumes are predicted by the simulation model. Cooling water (assumed to be available at 20°C) is used in the solvent cooler and the condenser at an assumed cost of 0.36 €/GJ. For electricity, a grid price of 0.1 €/kWh is assumed. Indeed, even if the PCC unit consumes electricity that is produced onsite, the plant is burdened by a loss of revenue for this exact electricity volume. Compared to the base case (i.e., before retrofitting the capture unit), this loss of revenue can be seen as a cost. The same logic applies to the heat consumption of the capture unit. As it is catered by steam that would originally be used to produce electricity, there is a loss of income that must be accounted for.
According to Turton et al. (2012), the three contributions and the previously calculated CAPEX can be weighted to account for maintenance, administrative costs, and other expenses then gathered into a single figure:
6 Results and discussions
6.1 Parametric optimization
6.1.1 Absorber height
Firstly, the height of the absorber column is varied to analyze its impact on both the reboiler heat duty and the total annual cost of the column, following the methodology described in Section 5. Since the absorber height affects the reboiler heat duty, the cost of steam is included for heating in the operating expenses (OPEX). Table 3 specifies the parameters held constant at their base case values, and an initial solvent rate of 75 t/h is used as a reference point. The results of this analysis are presented in Figure 5.
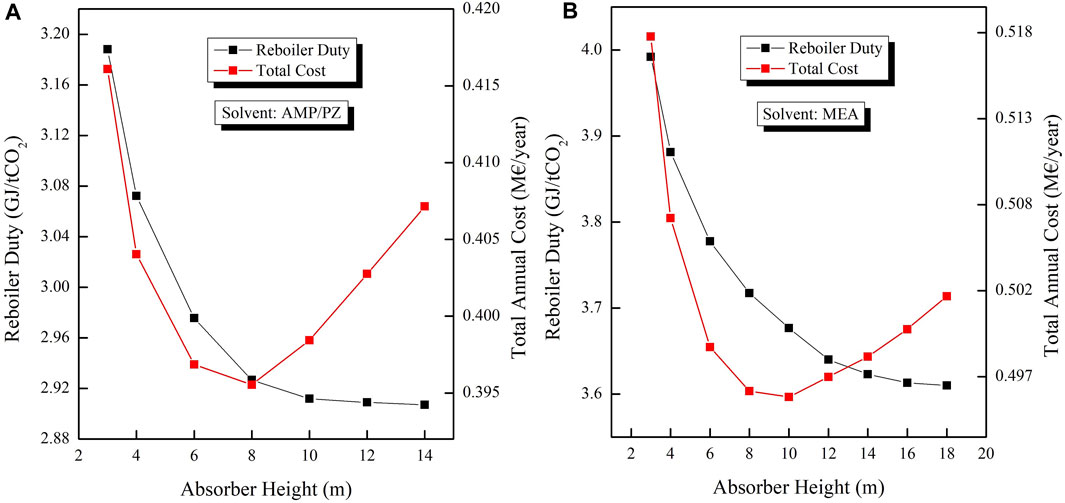
Figure 5. Effect of the absorber height on the reboiler duty and the total annual cost. (A) AMP/PZ case, (B) MEA case.
From Figure 5A, increasing the height of the absorber exponentially decreases the reboiler duty as more height of the packing results in longer contacting time between the solvent and the inlet gas, taking the load of the reboiler in terms of decreasing lean loading (Dutta, 2007). In contrast, from the curve of the total cost, there is a decrease at the start and after a height of 8 m, the cost starts increasing almost linearly, which results in more dominance of CAPEX over the decrease in OPEX. Hence, a trade-off must be made at some point. As seen from the Figure, the decrease in the reboiler duty becomes marginal, and further increase in height merely results in more cost for the column. Thus, it is economically and technically viable to choose 8 m as the optimum height of the absorber for the AMP/PZ case. Similarly, from Figure 5B, the decrease in the reboiler duty is observed with an increase in height however, after 10 m height the total cost starts increasing. Hence, for the MEA case, 10 m is selected as the optimum height.
6.1.2 Solvent rate
After optimizing the absorber height for both cases, the next step is to choose the optimum solvent rate to minimize energy consumption. The results are presented in Figure 6. Again, the other parameters are kept constant to the base case values mentioned in Table 3, along with the relevant absorber heights.
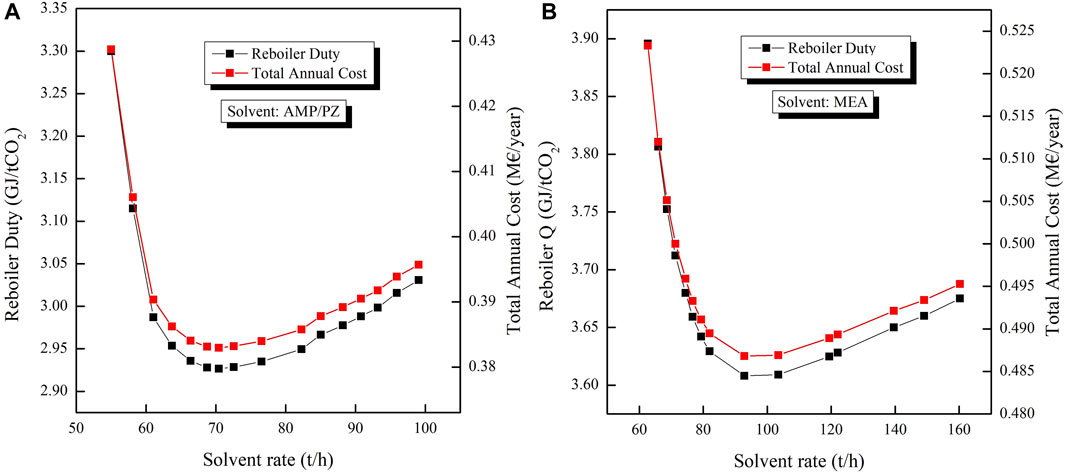
Figure 6. Effect of solvent rate on the reboiler duty. (A) AMP/PZ case, (B) MEA case.
From Figure 6A, initially at the lower solvent rates, the reboiler duty is high and then exhibits a minimum at 70 t/h and eventually starts increasing again at higher rates. A similar trend is observed in the case of total annual cost. The reason for such behavior is due to the division of heating duty in the stripper, as explained in detail in Section 3.3. At 70 t/h, a minimum reboiler duty of 2.93 GJ/tCO2 is observed, hence it can be selected as the optimum solvent rate for the case of AMP/PZ. However, for MEA, due to high regeneration energy and lower capacity compared to AMP/PZ, the minimum reboiler duty of 3.61 GJ/tCO2 is observed at 90 t/h. The result of the MEA case is presented in Figure 6B.
6.1.3 Stripper height
Similarly to the absorber height, a sensitivity study is performed on the stripper height against the reboiler duty and the total cost. Here again, the total cost is the annual OPEX (steam cost for regeneration) and the annual CAPEX of the column. In this case, the absorber height and the solvent rate are also kept constant along with other constant parameters.
From Figure 7, the trend for the height against the reboiler duty for the AMP/PZ case is quite the same as the absorber height. An increase in packing height results in a decrease in the reboiler duty as it aids in the better regeneration of the solvent by increasing the overall heat transfer area. However, it comes with an increase in the cost of the stripper. While the initial decrease in total cost can be attributed to the reduced steam requirement, further increments lead to an increase in total costs due to higher CAPEX. In this case, choosing a height of 6 m appears to be the optimum choice, as further increases do not result in a significant reduction in duty but only lead to higher total costs. In the case of MEA, Figure 7B illustrates a decrease in reboiler duty and total cost as the height increases initially. However, beyond 8 m, the total cost begins to rise, primarily because the reduction in OPEX is not as substantial as the increase in CAPEX. Therefore, in this case, selecting a height of 8 m is advisable as it represents the optimal choice.
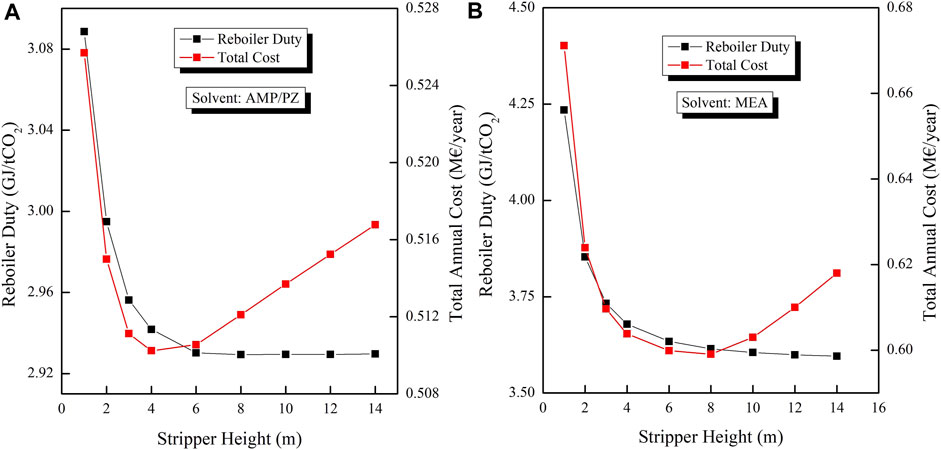
Figure 7. Effect of the stripper height on the reboiler duty and the total annual cost. (A) AMP/PZ case, (B) MEA case.
6.1.4 Stripper pressure
The last parameter to study is the stripper pressure which significantly affects the reboiler duty. Increasing the pressure results in a decrease in the reboiler duty and vice versa. The decrease in energy consumption can be explained by the fact that increasing pressure results in better achievement of the higher temperatures in the stripper, thus reducing the heat duty. However, higher temperatures can also result in the degradation of the solvent as discussed in Section 1. Therefore, it is safe to utilize a temperature slightly lower than the degradation temperature. Figure 8A present the effect of the pressure on the reboiler duty and temperature of the solvent for both AMP/PZ and MEA solvents respectively.
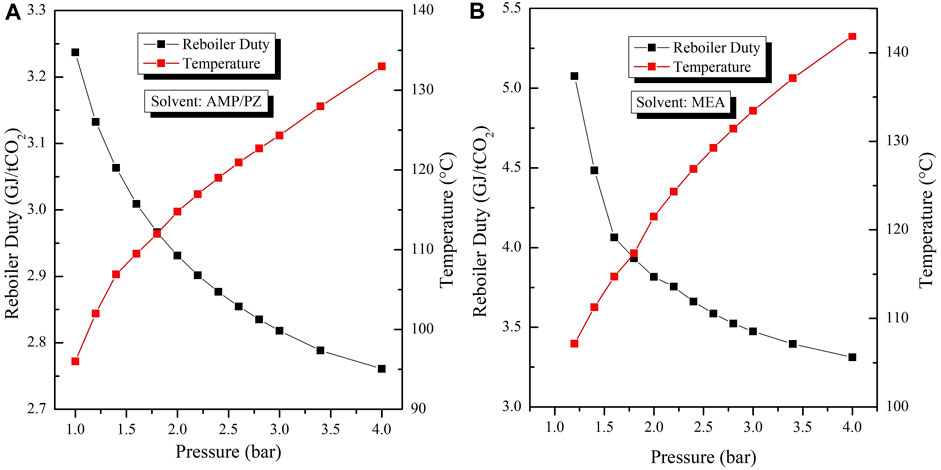
Figure 8. Influence of the stripper pressure on the reboiler duty and temperature. (A) AMP/PZ case, (B) MEA case.
From Figure 8A, increasing the pressure decreases the reboiler duty as expected, however, the temperature of the solvent is also increasing in the column. As mentioned in Section 1, the AMP/PZ blends present degradation at 127°C–135°C. At 2.4 bar pressure, the solvent temperature is 120°C which is below this range and can be chosen as the safest temperature considering the uncertainties. However, in the case of MEA, various studies have reported the degradation of MEA occurring within the temperature range of 125°C–140°C (Rochelle, 2012; Huang, 2015). To err on the side of caution, it is advisable to set the threshold at 125°C. Figure 8B shows that MEA reaches higher temperatures more rapidly than AMP/PZ as pressure increases. At 2 bar, the solvent reaches 120°C, and further increasing the pressure carries the risk of solvent loss due to degradation. Consequently, for the MEA case, 2 bar is the selected optimum pressure.
6.1.5 The optimal parameters and comparison
After performing parametric optimization for variables such as solvent flow rate, absorber and stripper heights, and stripper pressure, the optimized parameters for both AMP/PZ and MEA cases were determined. To assess the performance of the AMP/PZ blend, we compared the technical analysis results with conventional MEA, as presented in Table 4. Utilizing the optimized parameters presented in Table 4, the reboiler duties for both cases were calculated. Employing AMP/PZ solvent results in a reboiler duty of 2.86 GJ/tCO2, whereas MEA requires a higher reboiler duty of 3.61 GJ/tCO2. These results are in good accordance with the results reported by IEA in the 2019 technical report (IEAGHG, 2019), where they calculated ∼3.0 GJ/tCO2 for the same composition of AMP/PZ and ∼3.6 GJ/tCO2 for 30 wt% MEA. This lower reboiler duty in the AMP/PZ case is attributed to its reduced regeneration energy requirement, as discussed in Section 1. Moreover, the power consumption of the compression train is identical for both solvents, as it only depends on the captured CO2 flow rate. This comparison underscores that when treating an equivalent amount of flue gas with a target 90% capture rate, the AMP/PZ solvent significantly enhances overall process performance by reducing solvent flow rates, column sizes, reboiler duty and power consumption. Utilizing AMP/PZ solvent results in a 17% lower total energy consumption compared to MEA.

Table 4. Optimized parameters of AMP/PZ solvent and comparison with conventional MEA.
6.2 Energy impact of the PCC unit on the CHP plant
Once optimized, the capture unit can be retrofitted to the case study, which is the CHP plant introduced in Section 4. For both solvents, the required heat and power to reach a 90% capture rate are reported in Table 4. Two control strategies were previously proposed if the CHP plant cannot meet these demands: (1) the capture rate is lowered, and (2) energy is provided by an external source.
The first strategy is evaluated by simulating the simplified model of the CHP plant without energy imports for each of the four selected months, with hourly discretization. Each operating point of the CHP plant has an optimal achievable capture rate, resulting in a specific amount of captured CO2. Table 5 shows the average capture rate for each studied month and the corresponding emissions. The latter stands out as negative emissions, since the capture unit is coupled with biomass CHP. The extent of the negative emissions depends on the biomass emission factor. The biomass to the studied CHP plant is supplied by local producers, hence the carbon balance is favorable. Bringing biomass from distant origins would degrade the carbon balance.
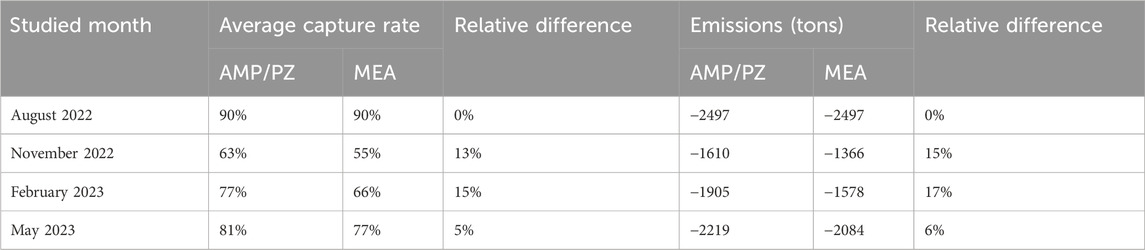
Table 5. Solvent comparison framed with the first control strategy (lowering the capture rate when needed).
Calculating the SPECCA for each operating point shows a variability from 4.91 MJ/kgCO2 for AMP/PZ (or 5.75 MJ/kgCO2 for MEA) down to 1.76 MJ/kgCO2 (2.05 MJ/kgCO2 for MEA). Based on this metric, the AMP/PZ blend outperforms MEA by almost 15%. The SPECCA must be read carefully: as more heat is supplied to the DHN, the efficiency of the cogeneration unit increases, and the best achievable capture rate decreases because less energy remains available for the PCC unit. Consequently, the captured emissions decrease. Together, these contributions synergize to yield a lower SPECCA but one must keep in mind that it corresponds to limited capture rates. The average capture rates compiled in Table 5 suggest that lowering the capture rate when the plant itself cannot supply enough energy might not be a suitable control strategy. Indeed, the capture unit would often operate at part load and the capital invested might not be adequately exploited.
The second control strategy can be analyzed by enabling energy imports in the simplified CHP plant model. For each hour of the four studied months, the SPECCA and the CO2 emissions are computed. It is interesting to have a closer look at the calculated SPECCA, which was defined by Eq. 13. Because the studied system is a cogeneration plant, the efficiency varies depending on the energy distribution between heat and electricity. If the system provides more heat to the district heating network, it produces less electricity and its overall efficiency increases. That is because heat supply is more efficient than electricity generation. Moreover, when the cogeneration efficiency increases, the SPECCA value decreases. In other words, the more heat the CHP plant produces, the less primary energy is needed to capture CO2. This is illustrated in Figure 9. Upon observation, it is also striking to notice that the previous trend reaches a minimum. Indeed, from a certain heat supply upward, the cogeneration is not capable of supplying enough heat and power to the PCC unit because it prioritizes the district heating network demand. Natural gas combustion starts to bridge the gap progressively to maintain the targeted capture rate. Eq. 13 highlights two contributions of natural gas: increased primary energy consumption (numerator) and increased CO2 emissions (denominator). Combined, these effects explain the sudden rise of SPECCA. The minimal SPECCCA appears at a higher value for AMP/PZ. This is simply related to the lower energy consumption of the capture unit (reported in Section 6.1.).
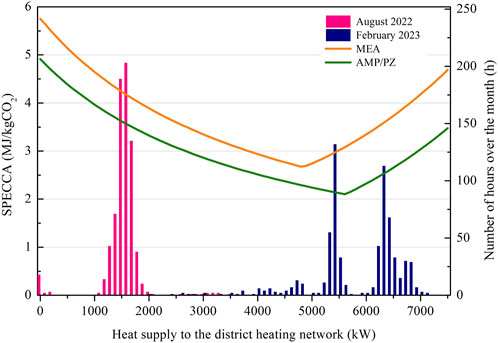
Figure 9. Influence of CHP plant operating point on the SPECCA (solid lines, left axis) and hourly distribution of said operation point (bars, right axis).
Figure 9 shows that the SPECCA (solid lines, left axis) varies between 5.75 MJ/kgCO2 and 2.68 MJ/kgCO2 for MEA while using AMP/PZ brings down the maximum and minimum values to 4.91 MJ/kgCO2 and 2.10 MJ/kgCO2. Instead of averaging these ranges, it is relevant to identify the most plausible values during operation. Out of the 4 months studied previously, August 2022 and February 2023 are selected for their different profiles and the number of hours spent at each operating point over the course of the respective month and are presented in Figure 9 by bars associated with the right axis. In August, the DHN heat demand is limited and most of the energy produced by the CHP is used to generate electricity. Consequently, the SPECCA is on the higher end of the range. In February, the opposite behavior is observed: the colder weather implies a larger heating demand which, in turn, leads to lower SPECCA values. The difference between MEA and AMP/PZ is also more pronounced. This would suggest that colder climates have an additional reason to select AMP/PZ over MEA, as the energy savings would concern a larger fraction of the operating time.
Regarding CO2 emissions, the nominal capture rate of 90% that can be achieved by both solvents results in a negative emission stream of around 3.4 tCO2/h. What differentiates the solvents is the amount of CO2 emitted by natural gas combustion. Because MEA requires more energy, more CO2 is emitted by said combustion. The difference remains small: over the four studied months, AMP/PZ outperforms MEA in terms of negative CO2 emissions by a maximum of 4.80%.
6.3 Economic analysis
Setting aside the implications of energy unavailability, it is valuable to compare the two competing solvents through a detailed economic analysis. First, the CAPEX for both processes is calculated using the methodology presented in Section 5.2.1. The results are reported in Table 6. The AMP/PZ process appears to have 12.23% lower CAPEX compared to MEA. The difference is due to the lower heat exchange area in the lean-rich heat exchanger (36.36% price difference), the different column sizes (16.33%), and the lower heat exchange area in the reboiler (14.55%). The differences mainly result from the smallest reboiler heat duty that was identified in Section 6.1.5. The actual figures seem to underestimate the cost of such a system, based on experience from internal costing studies and pilot plant deployment on the Liège University campus. Whereas the methodology that was used offers serious advantages such as systematicity and simplicity, it is most reliable for mature technologies, which is not the case for carbon capture as industrial-scale deployments are still limited. In other words, the calculated CAPEX is probably closer to what a nth-of-a-kind facility would cost rather than to a first-of-its-kind demonstrator. The deployment of such systems should be expected with the largest costs until the technology reaches industrial maturity.
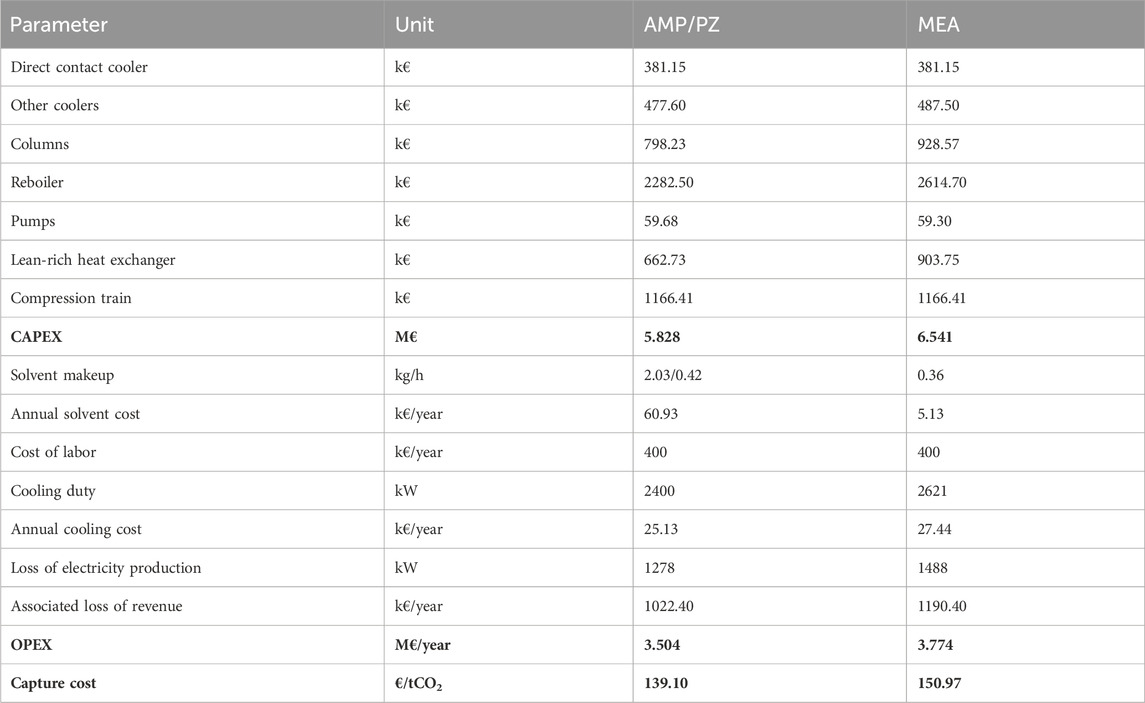
Table 6. Detailed results of the economic analysis.
Then, the OPEX for both processes is calculated utilizing the methodology explained in Section 5.2.2. Detailed results are also reported in Table 6. It is important to note that, while being a large contributor to the OPEX, the labor cost is equal in both scenarios. Indeed, the same assumptions were taken for the operation of the PCC unit (see Section 5.2.2.). The first noticeable difference between both solvents is the chemical make-up cost, i.e., the cost of raw chemicals to compensate for entrainment losses with the clean gas. It amounts to 61 k€/year for AMP/PZ and goes down to 5 k€/year for MEA. However, one should keep in mind that degradation losses were neglected. It is expected to be a larger issue with MEA, therefore dampening this difference. As expected, much of the OPEX difference comes from the cost that pertains to the reboiler heat duty. In this case, it is the loss of revenue due to the lower electricity generation. As highlighted previously, the AMP/PZ blend performs better than MEA in terms of energy consumption. Steam consumed to cater for the reboiler does not go through the secondary turbine to produce electricity. The power production difference between the base case (before the retrofit) and both solvents are computed by the simplified model of the CHP plant and the results are reported in Table 6.
Finally, the capture cost per ton of CO2 is computed by dividing the annual cost (OPEX + annualized CAPEX) by the annual mass of captured CO2. The results are reported in Table 6. The economic comparison is therefore in favor of the AMP/PZ blend, as its cost of capture is 11.88 €/t lower (7.87%), which is a significant difference. The IEAGHG technical report (IEAGHG, 2019) announces a cost of capture difference of 15%–22%, depending on the application. The difference can be explained by the relative accuracy of the method used in the present work and the neglection of degradation. Moreover, substantial discrepancies commonly arise in independent economic evaluations, primarily attributed to variations in sizing methodologies and the estimation of capital costs (van der Spek et al., 2017). However, the respective conclusions converge. The present estimations shall be extended in future works, in which more accurate evaluation methods can be used. In particular, the previous section highlighted the need to consider operation not only at nominal capacity but also given the evolving demand of the energy system.
7 Conclusion
In the present work, two competing solvents for CO2 capture were compared: conventional MEA and the 27 wt% AMP +13 wt% PZ solution.
First, simulation models were developed using Aspen Plus. In particular, a detailed thermodynamic model was presented to compute the accurate NRTL binary interaction parameters for the AMP/PZ/CO2/H2O system. Thanks to the Aspen regression tool, a more accurate set of parameters is proposed based on VLE data available in the literature. The parameters regressed showed excellent improvement with only 4.7% AARD from the experimental values of Belabbaci and 7.1% from the values of Hartono. In comparison to the parameters available in the Aspen databank which showed 8.76% and 11% AARD, respectively.
Second, the models were adapted to the flue gases of a case study: the Sart Tilman CHP plant, located on the Liège University campus, in Belgium. Simulations were then run to determine the optimal operating parameters of the capture unit for both AMP/PZ and MEA solvents. Parametric optimization was used to minimize the energy consumption of the process. The studied parameters were the solvent flow rate, the absorber height, the stripper height, and the stripper operating pressure. The results of the optimization showed that the AMP/PZ blend performs 21% better than MEA energy-wise. This already suggests that AMP/PZ can be a suitable alternative to MEA for the PCC process.
Third, the implications of retrofitting a capture unit were studied using the same case study under the scope of the overall emissions and the energy impact on the host process. Because the CHP plant is fueled by biomass, capturing the CO2 results in negative emissions. When the PCC unit operates at nominal capacity, it can remove around 3.4 tCO2/h from the atmosphere, versus the current positive emissions of 0.36 tCO2/h. However, when the heating demand of the district heating network gets too high, insufficient energy remains available to operate the capture unit at nominal capacity. The capture can then be lowered, or complementary energy can be imported into the system by natural gas combustion. In the first case, AMP/PZ outperforms MEA during all studied months, with a worst-case monthly average capture rate of 63% against 55% for MEA. In the second case, natural gas combustion and the associated emissions encumber the Specific Primary Energy Consumption for CO2 Avoided (SPECCA) which, depending on the heating demand of the DHN, varies between a maximum of 4.91 MJ/kgCO2 (5.71 MJ/kgCO2 for MEA) down to a minimum of 2.10 MJ/kgCO2 (versus 2.68 MJ/kgCO2).
Then, an economic comparison was carried out. For this purpose, CAPEX and OPEX of both processes were calculated. A systematic methodology was used to ensure a fair comparison. Again, AMP/PZ outperformed MEA with a 7.87% reduction in overall capture cost. A closer look at the contributions showed that the main culprits were the differences in optimal sizing and energy consumption. While the methodology yielded figures that seem to underestimate the real cost, the comparison still holds because both competitors were evaluated based on identical assumptions.
The above discussion allows to say that for the 90% capture rate of CO2, 27 wt% AMP +13 wt% PZ solution can be used as an excellent alternative to conventional 30 wt% MEA. Moreover, similar results are expected if the capture rate is higher (such as 95%), as both solvents should consume more energy to reach this capture rate, and the AMP/PZ blend should still be less energy-intensive. What could change is the quantification of the additional energy, but the trend will remain the same.
Nevertheless, this study did not address the environmental impact and oxidative degradation of AMP/PZ solvent in comparison to MEA. Future research should prioritize examining higher amine emissions of AMP/PZ and methods to mitigate oxidative degradation, particularly compared to MEA. To improve the accuracy of the thermodynamic model, comparing results with recent VLE datasets or other available software is crucial. Additionally, optimizing the PCC process by exploring alternative configurations to cut energy use and overall costs is essential.
Lastly, integration with the host process brings another round of challenges and opportunities. In particular, the operational behavior and the need for an external energy source could be studied over a longer period. Innovative heat supply strategies, such as high-temperature heat pumping, could also become more and more accessible for PCC processes as improvements from the base case can decrease the reboiler heat duty. Also, integrating the calculated cost of capture to the cost of heat (or to the cost of electricity) could allow the comparison with other heat (and electricity) sources, which would further help define the role of carbon capture in our energy systems. Duplicating the study with other fuels could also help underline the striking benefits of negative emissions thanks to BECCS.
Data availability statement
The original contributions presented in the study are included in the article, further inquiries can be directed to the corresponding author.
Author contributions
MS: Conceptualization, Data curation, Formal Analysis, Investigation, Methodology, Software, Validation, Visualization, Writing–original draft, Writing–review and editing. BB: Data curation, Formal Analysis, Investigation, Software, Validation, Visualization, Writing–original draft, Writing–review and editing. TN: Formal Analysis, Investigation, Software, Writing–review and editing. GL: Conceptualization, Funding acquisition, Investigation, Methodology, Resources, Supervision, Writing–review and editing.
Funding
The author(s) declare that financial support was received for the research, authorship, and/or publication of this article. This research is supported via the energy transition funds project “Trilate” organized by the FPS Economy, S.M.E.s, Self-employed and Energy. It also benefits from the support of the Walloon Region through a FRIA-FNRS grant.
Acknowledgments
The authors would like to thank Dr. Cristhian Molina Fernandez for his careful review of the present paper.
Conflict of interest
The authors declare that the research was conducted in the absence of any commercial or financial relationships that could be construed as a potential conflict of interest.
Publisher’s note
All claims expressed in this article are solely those of the authors and do not necessarily represent those of their affiliated organizations, or those of the publisher, the editors and the reviewers. Any product that may be evaluated in this article, or claim that may be made by its manufacturer, is not guaranteed or endorsed by the publisher.
References
Aghel, B., Janati, S., Wongwises, S., and Shadloo, M. S. (2022). Review on CO2 capture by blended amine solutions. Int. J. Greenh. Gas Control 119, 103715. doi:10.1016/j.ijggc.2022.103715
Aroonwilas, A., and Veawab, A. (2009). Integration of CO2 capture unit using blended MEA–AMP solution into coal-fired power plants. Energy Procedia 1, 4315–4321. doi:10.1016/j.egypro.2009.02.244
Artanto, Y., Jansen, J., Pearson, P., Puxty, G., Cottrell, A., Meuleman, E., et al. (2014). Pilot-scale evaluation of AMP/PZ to capture CO2 from flue gas of an Australian brown coal-fired power station. Int. J. Greenh. Gas Control 20, 189–195. doi:10.1016/j.ijggc.2013.11.002
Belabbaci, A., Ahmed, N. C. B., Mokbel, I., and Negadi, L. (2010). Investigation of the isothermal (vapour + liquid) equilibria of aqueous 2-amino-2-methyl-1-propanol (amp), n-benzylethanolamine, or 3-dimethylamino-1- propanol solutions at several temperatures. J. Chem. Thermodyn. 42, 1158–1162. doi:10.1016/j.jct.2010.04.015
Bishnoi, S., and Rochelle, G. T. (2000). Absorption of carbon dioxide into aqueous piperazine: reaction kinetics, mass transfer and solubility. Chem. Eng. Sci. 55, 5531–5543. doi:10.1016/S0009-2509(00)00182-2
Bishnoi, S., and Rochelle, G. T. (2002a). Absorption of carbon dioxide in aqueous piperazine/methyldiethanolamine. AIChE J. 48, 2788–2799. doi:10.1002/aic.690481208
Bishnoi, S., and Rochelle, G. T. (2002b). Thermodynamics of piperazine/methyldiethanolamine/water/carbon dioxide. Ind. Eng. Chem. Res. 41, 604–612. doi:10.1021/ie0103106
Borhani, N., and Wang, M. (2019). Role of solvents in CO2 capture processes: the review of selection and design methods. Renew. Sustain. Energy Rev. 114, 109299. doi:10.1016/j.rser.2019.109299
Bravo, J. L., Rocha, J. A., and Fair, J. R. (1992). A comprehensive model for the performance of columns containing structured packings. Inst. Chem. Eng. Symposium Ser. 128, A439.
Bravo, J. L., Rocha, J. A., and Fair’, J. R. (1993). Distillation columns containing structured packings: a comprehensive model for their performance. 1. Hydraulic models. Ind. Eng. Chem. Res. 32, 641–651. doi:10.1021/ie00016a010
Brúder, P., Grimstvedt, A., Mejdell, T., and Svendsen, H. F. (2011). CO2 capture into aqueous solutions of piperazine activated 2-amino-2-methyl-1-propanol. Chem. Eng. Sci. 66, 6193–6198. doi:10.1016/j.ces.2011.08.051
Campanari, S., Chiesa, P., and Manzolini, G. (2010). CO2 capture from combined cycles integrated with Molten Carbonate Fuel Cells. Int. J. Greenh. Gas Control 4, 441–451. doi:10.1016/j.ijggc.2009.11.007
CASTOR (2008). EU-Project CO2, from Capture to Storage (CASTOR): integrated research project under the 6th frame work programme of the European commision, contract nr. ses6-ct-2004–502586, project duration from 01.02.2004 to 31.01.2008. Available at: http://www.co2castor.com.
CESAR (2011). CO2 Enhanced Separation and Recovery (CESAR).Integrated research project partially funded by the European commission under the 7th frame work program Grant agreement number 213569, project duration from 01.02.2008 to 31.01.2011. Available at: www.co2cesar.euS.
Charles, M. (2023). Cost indices. Available at: https://toweringskills.com/financial-analysis/cost-indices/(Accessed September 20, 2023).
CWAPE (2010). Communication concernant les modalités de calcul des coefficients d’émission de CO2 des filières de production d’électricité verte à partir de biomasse Namur. Available at: https://energie.wallonie.be/servlet/Repository/modalites-de-calcul-des-coefficients-d-emission-de-co2-de-sfilieres-de-production-d-electricite-verte-a-partir-de-biomas.pdf?ID=54714.
Dave, N., Do, T., Palfreyman, D., and Feron, P. H. M. (2011). Impact of liquid absorption process development on the costs of post-combustion capture in Australian coal-fired power stations. Chem. Eng. Res. Des. 89, 1625–1638. doi:10.1016/j.cherd.2010.09.010
Ding, X., Chen, H., Li, J., and Zhou, T. (2023). Comparative techno-economic analysis of CO2 capture processes using blended amines. Carbon Capture Sci. Technol. 9, 100136. doi:10.1016/j.ccst.2023.100136
Dutta, B. K. (2007). Principles of mass transfer and separation processes. New Delhi, India: PHI Learning. Available at: https://books.google.be/books?id=a6uMtgoxjyIC.
Frangopoulos, C. A. (2012). A method to determine the power to heat ratio, the cogenerated electricity and the primary energy savings of cogeneration systems after the European Directive. Energy 45, 52–61. doi:10.1016/j.energy.2011.12.044
Freeman, S. A., and Rochelle, G. T. (2012). Thermal degradation of aqueous piperazine for CO2 capture. 1. Effect of process conditions and comparison of thermal stability of CO2 capture amines. Ind. Eng. Chem. Res. 51, 7719–7725. doi:10.1021/ie201916x
Fuss, S., Jones, C. D., Kraxner, F., Peters, G. P., Smith, P., Tavoni, M., et al. (2016). Research priorities for negative emissions. Environ. Res. Lett. 11, 115007. doi:10.1088/1748-9326/11/11/115007
Hartono, A., Saeed, M., Ciftja, A. F., and Svendsen, H. F. (2013). Binary and ternary VLE of the 2-amino-2-methyl-1-propanol (AMP)/piperazine (Pz)/water system. Chem. Eng. Sci. 91, 151–161. doi:10.1016/j.ces.2013.01.015
Hermann, J. (2014). Process modeling of novel amine carbon capture solvents: conversion of experimental data into thermophysical and kinetic relations. Trondheim, Norway: Institutt for energi-og prosessteknikk.
Herzog, H., Meldon, J., and Hatton, A. (2009). “Advanced post-combustion CO2 capture,” in Chapter within coal without carbon, an investment plan for federal action, prepared for the clean air task force under a grant from the doris duke charitable foundation. Available at: http://www.catf.us/publications/reports/Coal_Without_Carbon.pdf.
Huang, Q. (2015). Thermal degradation of amines for CO2 capture. Lexington, Kentucky: University of Kentucky. Available at: https://uknowledge.uky.edu/chemistry_etds/51.
IEA (2021). World energy balances: overview. Paris: IEA. Available at: https://www.iea.org/reports/world-energy-balances-overview.
IEAGHG (2019). IEAGHG technical report - further assessment of emerging CO2 capture technologies for the power sector and their potential to reduce costs. Available at: www.ieaghg.org.
IPCC (2023). Climate change 2021 – the physical science basis: working group I contribution to the sixth assessment report of the intergovernmental panel on climate change. Cambridge: Cambridge University Press. doi:10.1017/9781009157896
Jilvero, H., Mathisen, A., Eldrup, N.-H., Normann, F., Johnsson, F., Müller, G. I., et al. (2014). Techno-economic analysis of carbon capture at an aluminum production plant – comparison of post-combustion capture using MEA and ammonia. Energy Procedia 63, 6590–6601. doi:10.1016/j.egypro.2014.11.695
Kanoglu, M., and Dincer, I. (2009). Performance assessment of cogeneration plants. Energy Convers. Manag. 50, 76–81. doi:10.1016/j.enconman.2008.08.029
Khan, U., Ogbaga, C. C., Abiodun, O.-A. O., Adeleke, A. A., Ikubanni, P. P., Okoye, P. U., et al. (2023). Assessing absorption-based CO2 capture: research progress and techno-economic assessment overview. Carbon Capture Sci. Technol. 8, 100125. doi:10.1016/j.ccst.2023.100125
Lassagne, O., Iliuta, M. C., Gosselin, L., and Désilets, M. (2016). Techno-economic assessment of CO2 capture from aluminum smelter emissions using PZ activated AMP solutions. Can. J. Chem. Eng. 94, 761–770. doi:10.1002/cjce.22437
Lee, S.-S., Mun, S.-M., Choi, W.-J., Min, B.-M., Cho, S.-W., and Oh, K.-J. (2012). Absorption characteristics of new solvent based on a blend of AMP and 1,8-diamino-p-menthane for CO2 absorption. J. Environ. Sci. 24, 897–902. doi:10.1016/S1001-0742(11)60788-2
Léonard, G. (2009). Modeling of a pilot plant for the CO2-reactive absorption in amine solvent for power plant flue gases.
Léonard, G., Crosset, C., Toye, D., and Heyen, G. (2015). Influence of process operating conditions on solvent thermal and oxidative degradation in post-combustion CO2 capture. Comput. Chem. Eng. 83, 121–130. doi:10.1016/j.compchemeng.2015.05.003
Li, H., Li, L., Nguyen, T., Rochelle, G. T., and Chen, J. (2013). Characterization of piperazine/2-aminomethylpropanol for carbon dioxide capture. Energy Procedia 37, 340–352. doi:10.1016/j.egypro.2013.05.120
Mandal, B. P., and Bandyopadhyay, S. S. (2006). Absorption of carbon dioxide into aqueous blends of 2-amino-2-methyl-1-propanol and monoethanolamine. Chem. Eng. Sci. 61, 5440–5447. doi:10.1016/j.ces.2006.04.002
Mangalapally, H. P., and Hasse, H. (2011). Pilot plant study of two new solvents for post combustion carbon dioxide capture by reactive absorption and comparison to monoethanolamine. Chem. Eng. Sci. 66, 5512–5522. doi:10.1016/j.ces.2011.06.054
Manzolini, G., Sanchez Fernandez, E., Rezvani, S., Macchi, E., Goetheer, E. L. V., and Vlugt, T. J. H. (2015). Economic assessment of novel amine based CO2 capture technologies integrated in power plants based on European Benchmarking Task Force methodology. Appl. Energy 138, 546–558. doi:10.1016/j.apenergy.2014.04.066
Notz, R., Tönnies, I., Mangalapally, H. P., Hoch, S., and Hasse, H. (2011). A short-cut method for assessing absorbents for post-combustion carbon dioxide capture. Int. J. Greenh. Gas Control 5, 413–421. doi:10.1016/j.ijggc.2010.03.008
Nwaoha, C., Beaulieu, M., Tontiwachwuthikul, P., and Gibson, M. D. (2018). Techno-economic analysis of CO2 capture from a 1.2 million MTPA cement plant using AMP-PZ-MEA blend. Int. J. Greenh. Gas Control 78, 400–412. doi:10.1016/j.ijggc.2018.07.015
Pinsent, B. R. W., Pearson, L., and Roughton, F. J. W. (1956). The kinetics of combination of carbon dioxide with hydroxide ions. Trans. Faraday Soc. 52, 1512–1520. doi:10.1039/TF9565201512
Porthos (2023). Pothos - CO2 transport and storage. Available at: https://www.porthosco2.nl/en/project/(Accessed March 15, 2024).
Rochelle, G. T. (2012). Thermal degradation of amines for CO2 capture. Curr. Opin. Chem. Eng. 1, 183–190. doi:10.1016/j.coche.2012.02.004
Rubin, E. S., Mantripragada, H., Marks, A., Versteeg, P., and Kitchin, J. (2012). The outlook for improved carbon capture technology. Prog. Energy Combust. Sci. 38, 630–671. doi:10.1016/j.pecs.2012.03.003
Saha, A. K., Bandyopadhyay, S. S., and Biswas, A. K. (1995). Kinetics of absorption of CO2 into aqueous solutions of 2-amino-2-methyl-1-propanol. Chem. Eng. Sci. 50, 3587–3598. doi:10.1016/0009-2509(95)00187-A
Saha, A. K., Biswas, A. K., and Bandyopadhyay, S. S. (1999). Absorption of CO2 in a sterically hindered amine: modeling absorption in a mechanically agitated contactor. Sep. Purif. Technol. 15, 101–112. doi:10.1016/S1383-5866(98)00090-2
Sanchez Fernandez, E., Goetheer, E. L. V., Manzolini, G., Macchi, E., Rezvani, S., and Vlugt, T. J. H. (2014). Thermodynamic assessment of amine based CO2 capture technologies in power plants based on European Benchmarking Task Force methodology. Fuel 129, 318–329. doi:10.1016/j.fuel.2014.03.042
Sartor, K., Quoilin, S., and Dewallef, P. (2014). Simulation and optimization of a CHP biomass plant and district heating network. Appl. Energy 130, 474–483. doi:10.1016/j.apenergy.2014.01.097
Sartori, G., and Savage, D. W. (1983). Sterically hindered amines for carbon dioxide removal from gases. Industrial Eng. Chem. Fundam. 22, 239–249. doi:10.1021/i100010a016
Stichlmair, J., Bravo, J. L., and Fair, J. R. (1989). General model for prediction of pressure drop and capacity of countercurrent gas/liquid packed columns. Gas Sep. Purif. 3, 19–28. doi:10.1016/0950-4214(89)80016-7
Tontiwachwuthikul, P., Meisen, A., and Lim, C. J. (1992). CO2 absorption by NaOH, monoethanolamine and 2-amino-2-methyl-1-propanol solutions in a packed column. Chem. Eng. Sci. 47, 381–390. doi:10.1016/0009-2509(92)80028-B
Turton, R., Bailie, R. C., and Whiting, W. B. (2012). Analysis, synthesis, and design of chemical processes. Hoboken, NJ: Prentice Hall. Available at: https://books.google.be/books?id=f6sbYJuFSycC.
Van der Spek, M., Arendsen, R., Ramirez, A., and Faaij, A. (2016). Model development and process simulation of postcombustion carbon capture technology with aqueous AMP/PZ solvent. Int. J. Greenh. Gas Control 47, 176–199. doi:10.1016/j.ijggc.2016.01.021
van der Spek, M., Sanchez Fernandez, E., Eldrup, N. H., Skagestad, R., Ramirez, A., and Faaij, A. (2017). Unravelling uncertainty and variability in early stage techno-economic assessments of carbon capture technologies. Int. J. Greenh. Gas Control 56, 221–236. doi:10.1016/j.ijggc.2016.11.021
Varun Bhat, I. K., and Prakash, R. (2009). LCA of renewable energy for electricity generation systems—a review. Renew. Sustain. Energy Rev. 13, 1067–1073. doi:10.1016/j.rser.2008.08.004
Wang, M., Lawal, A., Stephenson, P., Sidders, J., and Ramshaw, C. (2011). Post-combustion CO2 capture with chemical absorption: a state-of-the-art review. Chem. Eng. Res. Des. 89, 1609–1624. doi:10.1016/j.cherd.2010.11.005
Wang, Y., Pan, Z., Zhang, W., Huang, S., Yu, G., Soltanian, M. R., et al. (2023). Higher efficiency and lower environmental impact of membrane separation for carbon dioxide capture in coal power plants. Environ. Chem. Lett. 21, 1951–1958. doi:10.1007/s10311-023-01596-0
Wilson, L. C., and Wilding, W. V. (1994). Experimental results for DIPPR 1990-91 projects on phase equilibria and pure component properties, DIPPR Data Series No. 2.
Xue, B., Yu, Y., Chen, J., Luo, X., and Wang, M. (2017). A comparative study of MEA and DEA for post-combustion CO2 capture with different process configurations. Int. J. Coal Sci. Technol. 4, 15–24. doi:10.1007/s40789-016-0149-7
Keywords: post-combustion CO2 capture, 2-amino-2-methyl-1-propanol, piperazine, process simulation, techno-economic analysis, BECCS
Citation: Salman M, Beguin B, Nyssen T and Léonard G (2024) Techno-economic analysis of AMP/PZ solvent for CO2 capture in a biomass CHP plant: towards net negative emissions. Front. Energy Res. 12:1325212. doi: 10.3389/fenrg.2024.1325212
Received: 20 October 2023; Accepted: 26 April 2024;
Published: 07 June 2024.
Edited by:
Swapnil Dharaskar, Pandit Deendayal Energy University, IndiaReviewed by:
Timothy A. Barckholtz, ExxonMobil Technology and Engineering, United StatesYongqing Xu, Huazhong University of Science and Technology, China
Paola Ammendola, National Research Council (CNR), Italy
Copyright © 2024 Salman, Beguin, Nyssen and Léonard. This is an open-access article distributed under the terms of the Creative Commons Attribution License (CC BY). The use, distribution or reproduction in other forums is permitted, provided the original author(s) and the copyright owner(s) are credited and that the original publication in this journal is cited, in accordance with accepted academic practice. No use, distribution or reproduction is permitted which does not comply with these terms.
*Correspondence: Muhammad Salman, bS5zYWxtYW5AdWxpZWdlLmJl