 Shinong Wang
 Hongwei Wu
 Yuan Ge1,2
- 1Key Laboratory of Advanced Perception and Intelligent Control of High-end Equipment, Ministry of Education, Wuhu, China
- 2College of Electrical Engineering, Anhui Polytechnic University, Wuhu, China
- 3Electrical Engineering Department, Faculty of Engineering, Menoufia University, Shebin El-Kom, Egypt
Photovoltaic (PV) modules must be monitored and evaluated in real-time during long-term operations to maintain a high performance, and series resistance is a critical component of this process. However, existing series resistance extraction methods may have either low accuracy or a very complex solution process. Worth mentioning, the size of this series resistance depends on environmental conditions, and the extraction results under different environments cannot be mutually referenced and compared. In this study, an analytical method for series resistance was derived, and a correction method for I–V curves that differs from the IEC 60891 standard was proposed, based on the derivative of the I–V characteristic curve of PV modules. The proposed analytical method was compared with three other methods for PV modules with three varied materials, and the influence of the ideality factor on parameter accuracy was also assessed. The obtained results showed that the proposed method can achieve high accuracy through an analytical expression. In addition, the I–V curves of a PV module operating for more than 6 years were corrected to fit the expected environmental conditions via the proposed correction method. Upon the calculated average value of the series resistance, the results indicated that the PV module has slightly aged, which verifies the effectiveness of the recommended method.
1 Introduction
Owing to the environmental pollution and the increased use of non-renewable nature fossil energy, countries worldwide are accelerating the structural shift of traditional energy to renewable energy (Haque et al., 2020; Malik et al., 2021). Recent regional conflicts have led to the substitution of fossil fuels with renewable energy sources to improve national energy security. In 2021, renewable energy accounted for 28.3% of global electricity (Ren21, 2022). The photovoltaics market has maintained its record-breaking growth streak, with new capacity installations totaling 175 GW in 2021 (Ren21, 2022). China installed approximately 54.9 GW of photovoltaic (PV) capacity in 2021, ranking first globally for nine consecutive years (National Energy Administration, 2022). The service life of PV systems provided by PV module manufacturers is 20–25 years. However, with normal operation and proper maintenance, a 30-year or longer life cycle of PV modules is achievable (Branker et al., 2011). Owing to the cumulative global photovoltaics capacity approaching 1,000 GW, effective long-term maintenance and monitoring of large-scale PV modules or arrays have become urgent issues. Therefore, the health status of PV modules in operation must be determined, and relevant faults should be promptly eliminated to maximize the modules’ return on investment and reduce their manufacturing costs (Livera et al., 2019). However, due to the fact that the working status of PV systems depends on weather conditions such as temperature and humidity, the status evaluation of PV modules is a challenging task (Qaiyum et al., 2023).
In recent years, several scholars have extensively studied health evaluations and fault diagnoses of PV modules and proposed several important methods and theories (Garoudja et al., 2017; Yi and Etemadi, 2017; Zhu et al., 2018; Chen et al., 2019a; Chaibi et al., 2019; Jufri et al., 2019; Li et al., 2019; Sun et al., 2019; Lyu et al., 2020). Series resistance is considered one of the most important electrical parameters of PV modules, which represents the lumped equivalent resistance of the connection resistance between a metallic electrode and semiconductor, the internal resistance of semiconductor material, and the bulk resistance of metallic interconnections (Polverini et al., 2012). With the aging of PV modules, the mechanical influence of daily thermal cycling in the outdoor environment inevitably leads to a gradual increase in series resistance (King et al., 2000). Other contributing factors include the degradation of electric cables, the increase of contact resistance at different connections, and solder corrosion or disconnection (Li et al., 2019). Series resistance reduces the output voltage and power of a PV module, representing the main cause of voltage decreases at the maximum power point (MPP) (Ali et al., 2020). Therefore, measuring series resistance is effective in evaluating the performance degradation of PV modules (Kalliojärvi-Viljakainen et al., 2022). As a parameter closely related to the electrical behavior of PV modules, the extraction of the series resistance value directly affects output power predictions, performance monitoring, efficiency evaluation, and MPP tracking of PV modules (Singh et al., 2018).
Several series resistance extraction methods have been developed to date (Pysch et al., 2007; Bissels et al., 2014; Singh et al., 2018). These methods can be used in different scenarios depending on application requirements. A new and simpler parameter extraction method has been proposed based on the geometric properties of a single-diode PV model (Toledo and Blanes, 2014). This approach is as effective as the general five-point method, but simpler. The exact analytical expression of each parameter of solar cells was previously derived using the Lambert-W function (Jain and Kapoor, 2004). A novel approach for extracting the electrical parameters of a single-diode equivalent circuit was also proposed using only basic data from a datasheet (MPP voltage, MPP current, open-circuit voltage, and short-circuit current) (Mares et al., 2015). A comparison of the measured and calculated I–V curves revealed that the determination coefficient fell within the range of 0.976–0.998. A new integration method has also been proposed to extract the parameters of a single-diode equivalent circuit with series resistance from the forward I–V characteristics (Ortiz-Conde and García-Sánchez, 2018). The effectiveness of this method has been verified using both simulated and measured data. An analytical approach for the extraction of all model parameters for the silicon solar cell was developed based on the variation in the slopes of the current–voltage characteristics of solar PV cells in short-circuit (SC) and open-circuit (OC) conditions (Khan et al., 2010). Two equations containing series and shunt resistance are derived and solved using mathematical software to obtain the values of the two resistances (Shinong et al., 2020). The trust-region algorithm in the MATLAB optimization toolbox was used to estimate the series resistance value (Piliougine et al., 2020). The fitting algorithm utilizes all the measured I-V curve data, thus achieving high data accuracy. Based on the initial value from an analytical expression, a numerical method was used to optimize series resistance according to the determination coefficient (Wang et al., 2021). However, the output I–V characteristic curves of PV modules strongly depend on environmental variables. Therefore, series resistance values obtained using existing extraction methods under different temperatures and solar irradiances will vary. This makes the series resistances unable to be mutually referenced and compared in different environmental conditions, thereby rendering health evaluations of PV modules are challenging.
Measured I–V characteristic curves contain valuable information about the working state of PV modules; hence, these curves are increasingly used for performance evaluations and fault diagnoses of PV modules (Chen et al., 2019b; Li et al., 2021; Zhang et al., 2022). Various hardware devices, such as microinverters, series inverters, intelligent circuit breakers, and intelligent combiner boxes, can independently measure the output I–V characteristic curves of PV modules. After attaining an I–V characteristic curve for a PV module, the corresponding derivative was acquired via simple mathematical operations. An algorithm based on the derivative of the I–V characteristic curve can also be implemented. Based on the above-mentioned studies, we propose a new method to determine the series resistance of PV modules as well as a correction method for the I–V curve differing from that of IEC 60891. Using the recommended correction method, the I–V characteristic curves under different operating conditions were corrected to a specified operating condition, and the proposed analytical method was then used to obtain the value of the series resistance. Therefore, compared to existing methods, all series resistances obtained by the proposed method are from the same operating conditions and can be directly compared to evaluate the health of PV modules. At the same time, the I-V characteristic curves of PV modules are one of the essential elements that PV power plant monitoring systems must collect, so the proposed method is easy to implement. Moreover, the simulation and experimental validation have shown that the proposed method has excellent parameter accuracy, thus it has good application prospects.
In this paper, a background introduction to the single-diode equivalent model of the PV module and the extraction of series resistance are presented in Section 2. The proposed series resistance extraction and I–V curve correction methods are detailed in Section 3. Then, simulation and testing results are provided and analyzed in Section 4. Section 5 concludes this paper.
2 Background knowledge
PV cells generate photocurrent (Iph) under sunlight. Owing to their diode characteristics, PV cells also produce a dark current (Id) that is opposite to the direction of Iph. When a load is applied, a voltage (Vid) is generated between the contact electrodes of the PV cell and the corresponding current (Iid) is generated. The ideal equivalent model of a PV cell is shown in Figure 1.
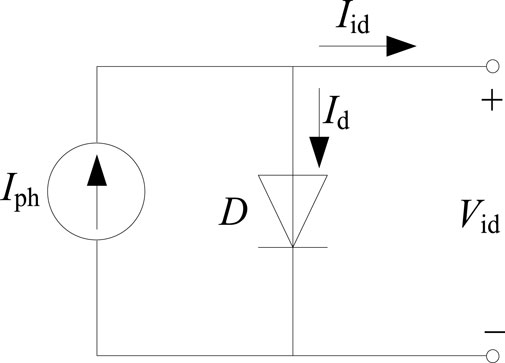
Figure 1. Ideal equivalent model of a photovoltaic (PV) cell.
Owing to the diode effect, the voltage at both ends of a single PV cell is 0.5–0.7 V, which has no practical value (Wang et al., 2018). Therefore, the PV module is composed of Ns PV cells in series, and its ideal I–V characteristic expression is as shown in Eq. 1:
where Io is the reverse saturation current of the diode, q is the electron charge (1.6 × 10⁻¹⁹ C), n is the ideality factor used to correct the Shockley equation, k is the Boltzmann constant (1.38 × 10⁻²³ J/K), and T is the PV module temperature in Kelvin.
Taking the derivative of Eqs 1, 2 can be obtained as follows:
In practice, the I–V characteristics of an actual PV cell usually differ somewhat from the ideal characteristics. A small portion of the energy generated by the PV cell is consumed within itself, and the effect is equivalent to two types of parasitic resistances: series resistance Rs and shunt resistance Rsh. Therefore, the single-diode equivalent model of the PV cell was obtained based on the ideal equivalent circuit in Figure 1 as combined with the two types of parasitic resistances; this model is shown in Figure 2 (Kim and Choi, 2010):
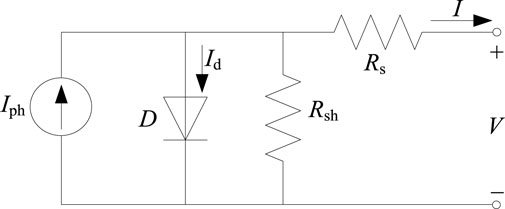
Figure 2. Single-diode equivalent model of the PV cell.
As shown in Figure 2, the actual I–V characteristic equation of the PV module is provided through Eq. 3:
Taking the derivative of Eqs 3, 4 can be obtained as follows:
When the PV module is at the OC and SC, Eq. 4 can be simplified and transformed. More specifically, Rs and Rsh can be solved according to the derivatives of the I–V curves at the OC and SC points, respectively, as shown in Eqs 5, 6 as follows:
The values obtained using Eqs 5, 6 are considered directly as the initial values of Rs and Rsh in many studies (Dyk and Meyer, 2004; Ma et al., 2014; Lim et al., 2015; Abbassi et al., 2018; Orioli, 2020; Li et al., 2021; Wang et al., 2021). The Rs extraction method proposed in this study is closely related to Eq. 5. The two methods are compared and analyzed in Section 4.
The dependence of Rs on the temperature and solar irradiance has also been a research hotspot in recent years. As Rs is an internal parameter of PV modules, analyses of this dependence have mostly been conducted from an experimental perspective. However, because Rs is not a physical quantity that can be directly measured, it must be obtained through indirect measurements using algorithms and other physical quantities. After Rs was extracted in a previous study according to the IEC 60891 normative standard, the results showed that for the c-Si, CIS, and CdTe modules, the dependence of Rs on temperature and solar irradiance was not obvious; however, for a-Si modules, the value of Rs decreased significantly with increasing temperature and solar irradiance (Polverini et al., 2012). Nine analytical methods were used to extract Rs, and using a-Si, HIT, and mc-Si technologies, Rs decreased with increasing temperature and solar irradiance (Singh et al., 2018). However, when utilizing HIT and a-Si technologies, the results of the different methods may fluctuate substantially. A new method based on the combination of genetic and simulated annealing algorithms was used to extract the parameters (Bendaoud et al., 2019). For a monocrystalline PV module, when the temperature changed from 25°C to 50°C, the Rs value showed an increase of 22%. For multiple polycrystalline Si solar cells, the results obtained via careful experimentation showed that Rs is affected by temperature and solar irradiance (Fébba et al., 2018). However, with an increase in temperature, Rs decreases exponentially, and with an increase in solar irradiance, Rs increases linearly. Therefore, the conclusions of different studies on the dependence of Rs on temperature and solar irradiance are inconsistent or even contradictory. However, the value of Rs is related to temperature and solar irradiance. Thus, before performing a health evaluation of PV modules, the series resistance must be corrected to a specified operating condition.
3 Proposed methodology
3.1 Proposed analytical method
The most common formula for calculating Io is given by Eq. 7, as proposed by De Soto et al. (De Soto et al., 2006).
where Tr is the reference temperature (25°C) of a PV module, Io,r is the value of Io under the reference PV module temperature, and Eg, is the bandgap energy of a material.
Eg, is not provided by PV module manufacturers, and its solution is relatively complex. Based on Io,r, the temperature coefficients μI and μV of current and voltage are introduced to characterize the dependence of Io on temperature, so Eq. 8 can be obtained as follows (Villalva et al., 2009):
where Iph,r and Vov,r are the photocurrent and OC voltage under standard test conditions (where solar irradiance S is 1000 W/m2, and T is 25°C) provided by the manufacturer, respectively.
In Eq. 8, the value of q/k was approximately 11,594. The value of n is generally between one and two, whereas that of T is generally between 293.15 K and 353.15 K. The values of Vov,r and Ns are generally on an order of magnitude ranging from 10 to 100. Therefore, the first term in the denominator on the right-hand side of Eq. 8 is much larger than that of 1. Thus, Eq. 8 can be simplified to Eq. 9 as follows:
In substituting the reverse saturation current equation of Eq. 9 into Eq. 2 and Eq. 10 can be obtained through reorganizing the variables as follows:
When the PV module is at the SC point, Vid is zero, and Eq. 11 shows the following:
In addition, Eq. 12 can be obtained from Figures 1, 2 as follows:
Therefore, Eq. 4 can be rewritten as Eq. 13:
For PV modules, Rs must be significantly smaller than Rsh. Therefore, when the module is at the SC point, through combining Eqs 11, 13, Eq. 14 can be obtained as follows:
In Eq. 14, for the single-diode equivalent circuit of the PV module, the derivative of the I–V curve at the SC point is related only to Rsh. Specifically, Rsh was solved using the derivative of the PV module I–V curve at the SC point, and no substantial parameter errors were produced.
For the polycrystalline silicon PV module Kyocera KC200GT, Figure 3 shows the I–V characteristic curves and slopes of the SC points under different T and S values. As shown in Figure 3, the slopes of the SC points were almost parallel. This implies that the derivatives of the I–V characteristic curve at the SC points are independent of changes in T and S, which verifies the correctness of Eq. 14. Therefore, for a given type of PV module, when T and S changed, the I–V characteristic curves were almost parallel near the SC points.
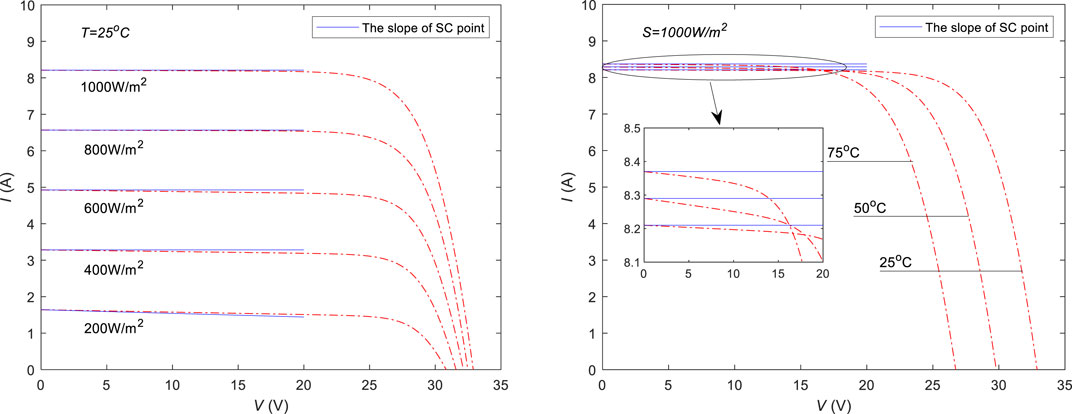
Figure 3. I–V characteristic curves and the corresponding slopes of short-circuit (SC) points for PV module KC200GT under different T and S values.
When the PV module is at the OC point, Vid is equal to the OC voltage Voc. Furthermore, Voc can be determined using Eq. 15 (Shinong et al., 2020):
where Sr is the reference solar irradiance, and its value is 1000 W/m2.
By substituting the Voc equation of Eq. 15 into Eq. 10, through reorganization, Eq. 16 can be obtained as follows:
Subsequently, dIid/dVid in Eq. 13 is replaced with Eq. 16, and the derivative of I to V at the OC is obtained as follows:
Rsh is much greater than 1; Eq. 17 can thus be simplified to:
If the first term in the denominator on the right side of Eq. 18 is significantly larger than 1, Eq. 18 can be further simplified to Eq. 5. However, in numerous cases, this assumption is not tenable; therefore, Rs calculated using Eq. 5 produces significant errors.
By sorting and transforming Eq. 18, the Rs solution formula proposed in this study can be obtained as follows:
Comparing Eqs 19, 5, Eq. 19 has one more term than Eq. 5, and the value of this term is closely related to the values of T and S.
3.2 Proposed I–V curve correction method
When the I–V characteristic curves are used to evaluate the health status of PV modules, owing to the randomness of the field environment, the measured I–V characteristic curves must be corrected to the expected environmental conditions. The most used temperature and solar irradiance correction procedure is the IEC 60891 standard (IEC 60891, 2009). IEC 60891 contains three procedures for correcting the measured I–V characteristic curves. The first and second correction procedures must determine the correction parameters through experiments in advance. The third correction procedure does not require correction parameters but requires at least three measured I–V characteristic curves.
In Eq. 13, the expression of dI/dV does not contain S. Meanwhile, here we supposed that Io, n, Rs, and Rsh are independent of S, which means that dI/dV does not change if S changes. In addition, we considered that PV modules work under a solar irradiance of 200–1,000 W/m2 (Achouby et al., 2018), and that the maximum interval of Vid is [Isc,200Rs, Voc,1000] (Isc,200 is the SC current when S is 200 W/m2, and Voc,1000 is the OC voltage when S is 1,000 W/m2). If S takes a different value, the corresponding interval of Vid must be within [Isc,200Rs, Voc,1000]. If two I–V characteristic curves under S values of 200 and 1000 W/m2 are obtained in advance, the dI/dV value corresponding to the interval [Isc,200Rs, Voc,1000] can be easily calculated. Subsequently, if S takes other values, dI/dV can be determined according to the interval correspondence of Vid. Specifically, when S changes, the I–V characteristic curve can be determined through translating dI/dV. However, the right-hand expression in Eq. 13 contains T; if T changes, the corresponding dI/dV changes accordingly. Therefore, when T changes, the corresponding I–V characteristic curve cannot be obtained through translating dI/dV; the only way to obtain it is through linear interpolation or extrapolation of the I–V characteristic curves, similar to IEC 60891.
The I–V characteristic curve correction method proposed in this study is illustrated in Figure 4. In Figure 4, (S1, T1), (S2, T1), and (S3, T2) show the three I–V characteristic curves obtained in advance. The optimal values for S1 and S2 were 200 and 1000 W/m2, respectively. The linear interpolation of the I–V curve requires three points on a straight line. Therefore, in the first step, the value of S4 should be determined according to (S3, T2) and the corrected point (Sa, Ta), as shown in Eq. 20:
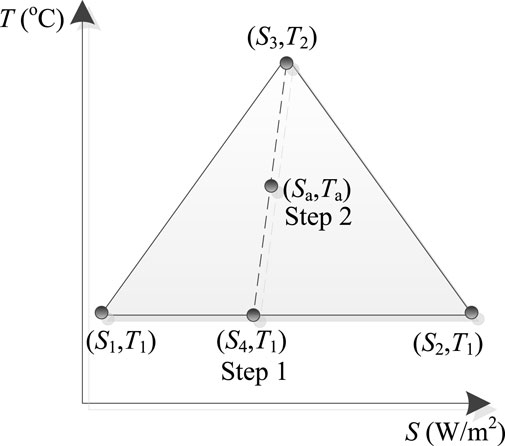
Figure 4. I–V characteristic curve correction method based on the three obtained characteristic curves.
In the first step of the correction method, dI/dV corresponding to the interval [Isc,200Rs, Voc,1000] was obtained from the I–V characteristic curves of (S1, T1) and (S2, T1). For point (S4, T1), the interval [Isc,s4Rs, Voc,s4] (Isc,s4 and Voc,s4 are the SC current and OC voltage, respectively, when S is equal to S4) of Vid must be within [Isc,200Rs, Voc,1000]. We determined the dI/dV for (S4, T1) based on the interval [Isc,s4Rs, Voc,s4]. Isc,s4 was calculated using Eq. 21 (Shinong et al., 2020).
In the author’s previous work, by combining SC current and difference equation, a recursive algorithm is used to get the I-V characteristic curve of PV modules (Wang et al., 2021). Hence the I–V characteristic curve of (S4, T1) can be acquired using the recursive algorithm incorporating dI/dV.
In Step 2 of the correction method, the I–V characteristic curve (Va, Ia) of (Sa, Ta) can be obtained based on linear interpolation, as shown in Eqs 22, 23 as follows:
where (Vm, Im) and (Vn, In) are the I–V characteristics of (S3, T2) and (S4, T1), respectively. α is determined by Eq. 24:
Therefore, the complete flowchart of the proposed methodology is shown in Figure 5.
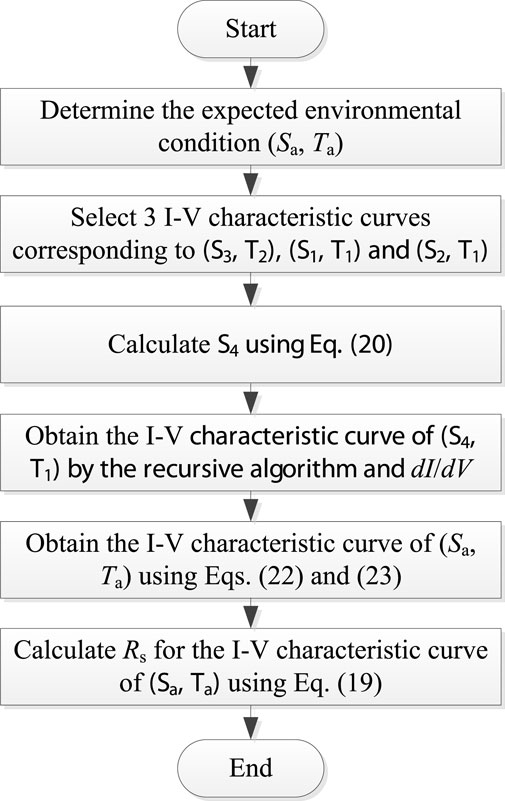
Figure 5. Flowchart of the proposed methodology.
4 Results and discussion
4.1 Simulation validation
To verify the feasibility of the series resistance extraction method proposed in this study, the corresponding simulation was first conducted. A 110 kW PV power generation demonstration project was installed on top of the teaching building of the Anhui Polytechnic University. The PV module used in this demonstration was polycrystalline silicon JAP6 60-250 (JA Solar Corporation). Therefore, JAP6 60-250 was used in simulation. Two other PV modules made of varied materials were also selected: thin-film ST40 and monocrystalline silicon SP70 (Shell Corporation). The main electrical parameters of these PV modules under standard test conditions (STC) are presented in Table 1. The I–V characteristic curves of the PV modules used in this study were obtained from the datasheets provided by the manufacturers, which effectively avoided measurement error and noise in the extraction method.
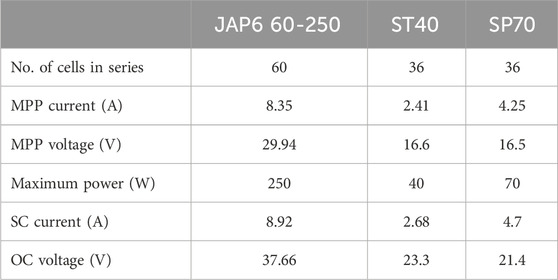
Table 1. Electrical parameters of the three photovoltaic (PV) modules under standard test conditions (STC).
The RS expression in Eq. 19 contains the ideality factor n, which is a PV module parameter. The influence of n on RS was also evaluated in the simulation. The author previously used a numerical method to solve n for I–V characteristic curve of PV modules (Wang et al., 2021). Then the values of n for each I-V characteristic curve of three simulated PV modules are listed in Table 2. When n takes different optimized values, based on the results of Table 2, Eq. 19 is called the proposed method 1. When n adopts different fixed constants in accordance with different PV technologies, Eq. 19 is called the proposed method 2. Eq. 5, which solves the RS according to the derivative of the I–V curve at the OC, is called the Derivative Method. In addition, in the author’s previous work, based on the initial value from an analytical expression, a numerical method was used to optimize RS according to the determination coefficient (Wang method) (Wang et al., 2021). Piliougine et al. used the trust-region algorithm (TR method) in the MATLAB optimization toolbox to estimate RS (Piliougine et al., 2020). The Wang method and TR method used large amounts of information to solve Rs, and the reliability of the results was high. Therefore, these two methods were used for comparison in the simulations.
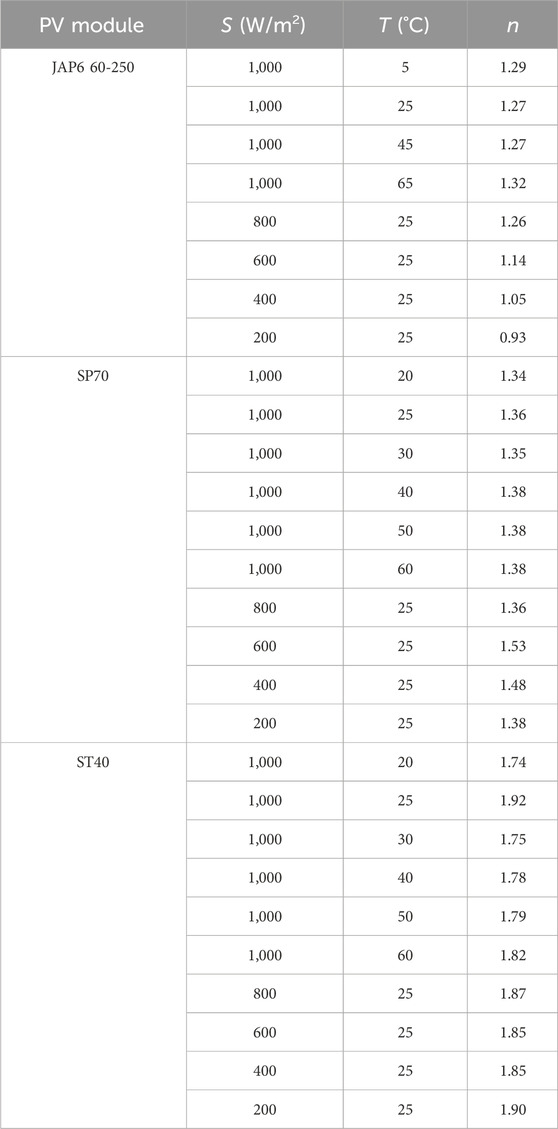
Table 2. n values of three PV modules under different I–V characteristic curves.
Rs extraction results for JAP6 60-250 are shown in Figure 6. For the proposed method 1, the values of n were obtained from Table 2. In the proposed method 2, the value of n is 1.3 because JAP6 60-250 is manufactured using polycrystalline silicon (Carrero et al., 2007).
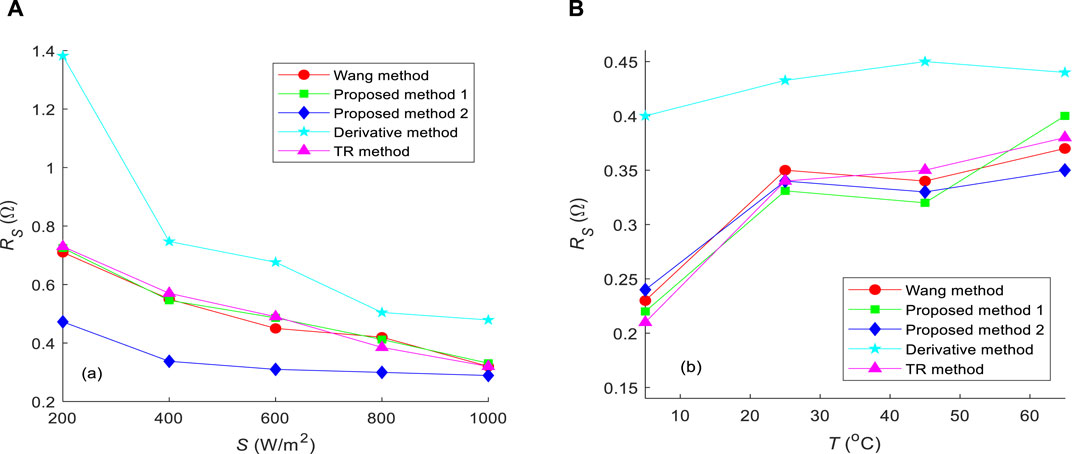
Figure 6. Extracted Rs values for JAP6 60-250 using five different methods under (A) T = 25°C with variable S and (B) S = 1000 W/m2 with variable T.
Rs extraction results for SP70 are shown in Figure 7. In the proposed method 2, the value of n is 1.2 because SP70 uses monocrystalline silicon (Carrero et al., 2007).
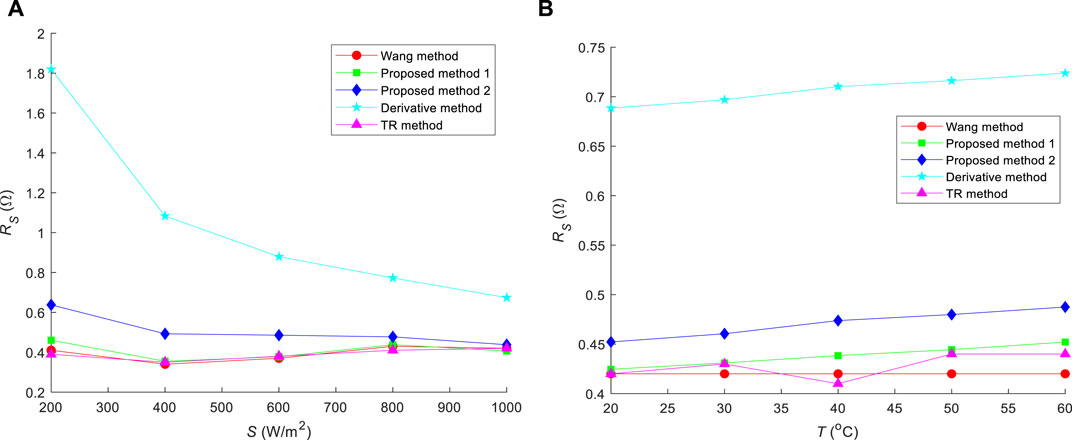
Figure 7. Extracted Rs values for SP70 using five different methods under (A) T = 25°C with variable S and (B) S = 1000 W/m2 with variable T.
Rs extraction results for ST40 are shown in Figure 8. In the proposed method 2, the value of n is 1.8 because ST40 is a thin-film PV system (Carrero et al., 2007).
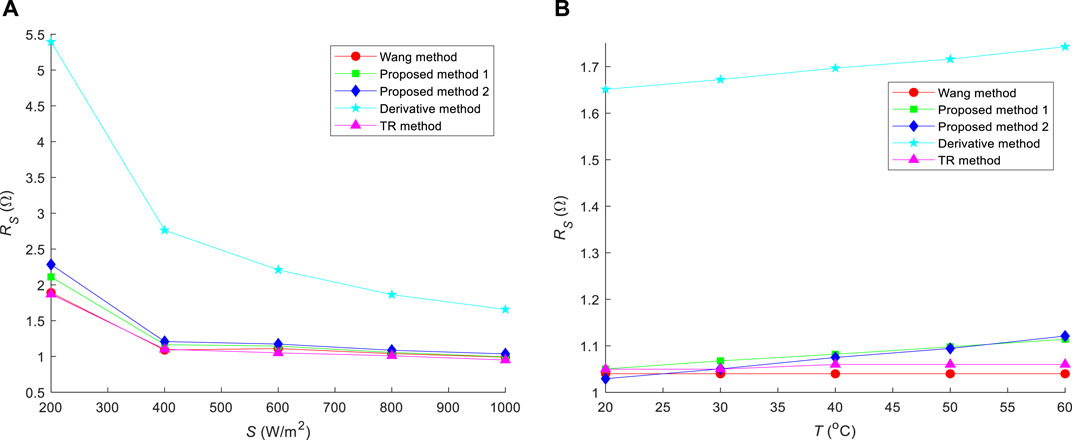
Figure 8. Extracted Rs values for ST40 using five different methods under (A) T = 25°C with variable S and (B) S = 1,000 W/m2 with variable T.
As shown in Figures 6–8, although the proposed method 1 is an analytical method, its accuracy is very high and is close to that of the Wang method and TR method. In all cases, the solved Rs values coincided with or approached those solved using the Wang and TR methods. In Figures 6, 8, the proposed method 2 exhibits a robust performance. However, it performs poorly in Figure 7. This is not surprising because there is a significant difference between n values used by the proposed methods 1 and 2. In all graphs, the Rs calculated by the Derivative Method deviated significantly from the Rs calculated by the other methods. This also indicates that Rs cannot be solved directly using the derivative of the I–V characteristic curve at the OC point. In addition, Rs in Figure 8 is significantly greater than that in its counterparts, as shown in Figures 6, 7. A possible reason for this finding is that the fill factor of ST40 is only 64.1%, which is significantly lower than those of JAP6 60-250 and SP70. In addition, these simulation results show that the Rs values of the same PV module are not the same when T or S changes, so these values cannot be directly used for the evaluation of PV modules.
In terms of the operability of the method, the Wang method requires a complete I-V characteristic curve and corresponding computer program to complete. The TR method is based on the complete I-V characteristic curve and is implemented through the MATLAB optimization toolbox. So the processes completed by these two methods are relatively complex. Although the Derivative method can be implemented based solely on Eq. 5, the simulation results of the three PV modules show that the obtained results by the method are significantly deviated from those of other methods. Although the methods proposed in this study also belong to analytical methods, the results obtained can be close to those of the Wang and TR methods. And in practical applications, it is possible to choose between the proposed methods 1 and 2 based on the algorithm complexity and solution accuracy. Furthermore, the derivation of the proposed method is based on the calculation formula for reverse saturation current in Eq. 8. In fact, the reverse saturation current generated by different calculation formulas may vary. However, from the simulation results, the assumption of reverse saturation current in this study is acceptable.
4.2 Experimental validation
For PV power generation demonstration project of the Anhui Polytechnic University, more than 6 years have passed since this PV power generation system began operation in 2016. All data in this system were recorded on a server in real time. For a PV module, 100 I–V characteristic curves from July to August 2021 were selected, and Rs was calculated using the proposed method 1. The results are presented in Figure 9.
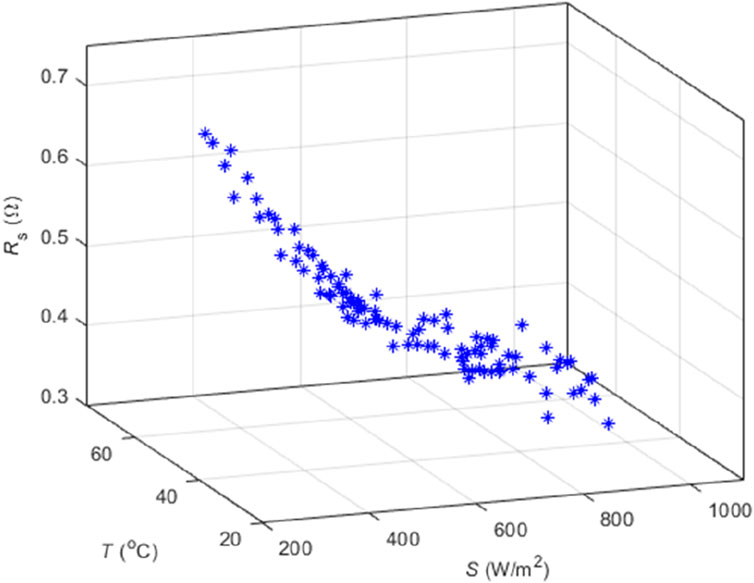
Figure 9. Extracted Rs values with the proposed method 1 for JAP6 60-250 under different T and S values.
As shown in Figure 9, when S is approximately 200 W/m2, the maximum value of Rs can reach 0.742 Ω. With an increase in S, Rs decreased, similar to an exponential decay. When S was approximately 1,000 W/m2, the minimum value of Rs was 0.347 Ω. When T changed, the dependence between Rs and T was not evident. Additionally, because Rs is closely related to the aging level of the PV module, the general aging state of the PV module can be determined using Rs. However, as shown in Figure 9, the Rs of the I–V curves varied under different S and T values. Therefore, the proposed correction method was used to correct these curves to the STC.
In Figure 10A, the value of T1 was 45°C, and the dI/dV corresponding to the interval [Isc,200Rs, Voc,1000] was obtained according to the saved I–V characteristic curves. Then, another I–V characteristic curve under (S3 = 947 W/m2, T2 = 68°C) was selected. Therefore, the value of S4 was 975 W/m2, based on Eq. 20. Hence, the I–V characteristic curve under (S4 = 975 W/m2, T1 = 45°C) can be obtained through the recursive algorithm and the dI/dV corresponding to the interval [Isc,975Rs, Voc,975]. Finally, according to the I–V characteristic curves at (947 W/m2, 68°C) and (975 W/m2, 45°C), the I–V characteristic curve of (Sa = 1,000 W/m2, Ta = 25°C) can be obtained using Eqs. 22 and 23. The corresponding Rs value was calculated as 0.352 Ω using the proposed method 1.
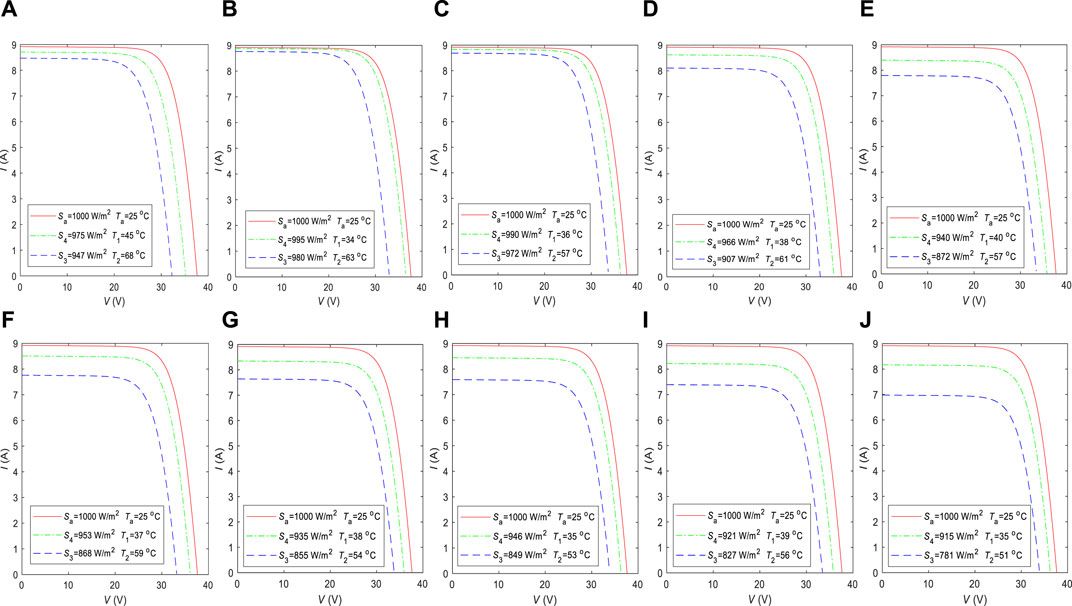
Figure 10. Ten corrected I–V characteristic curves of JAP6 60–250 using the proposed curve correction method under (A) S4 = 975 W/m2 and T1 = 45 °C, (B) S4 = 995 W/m2 and T1 = 34 °C, (C) S4 = 990 W/m2 and T1 = 36 °C, (D) S4 = 966 W/m2 and T1 = 38 °C, (E) S4 = 940 W/m2 and T1 = 40 °C, (F) S4 = 953 W/m2 and T1 = 37 °C, (G) S4 = 935 W/m2 and T1 = 38 °C, (H) S4 = 946 W/m2 and T1 = 35 °C, (I) S4 = 921 W/m2 and T1 = 39 °C, (J) S4 = 915 W/m2 and T1 = 35 °C.
The other nine corrected I–V characteristic curves were given in Figures 10B–J. Then the proposed method 1 was applied to solve Rs for the corrected I-V characteristic curves, as shown in Table 3. Finally, these ten values of Rs values were averaged to 0.349 Ω. However, according to the I–V characteristic curve under STC given in the datasheet, the Rs value is 0.331 Ω, which indicates that this PV module has been slightly aged.

Table 3. Rs values of 10-corrected I–V characteristic curves and corresponding average values.
5 Conclusion
In order to effectively evaluate the health of PV modules, an accurate analytical method for the series resistance was proposed. This method is based on the derivative of the I–V characteristic curve of the PV modules, and a correction method for the I–V curve differing from the IEC 60891 standard was provided. The correction method adjusted the I–V characteristic curves of PV modules according to a specified operating condition; then, the value of the series resistance was obtained through a simple analytical expression. Considering the problem of different sizes of series resistance in different environments, the current proposed method has improved the evaluation of the PV modules status over the conventional method. The effectiveness of the proposed method was verified through simulations and experiments, and the results indicated that the parameter accuracy of the proposed algorithm was close to that of some superior performance algorithms. The results also demonstrated that the method of solving the series resistance using the derivative of the I–V characteristic curve at the OC point was unsuitable.
However, for the proposed analytical method, n and the derivative of the I–V characteristic curve greatly affected the accuracy of the series resistance. Therefore, if the proposed method 1 was required, it was necessary to first use a suitable metaheuristic algorithm to obtain an accurate n before calculating the series resistance. And when the I–V characteristic curve contained excessive noise or bad point data, appropriate filtering or data smoothing algorithms were used for preprocessing to obtain the correct derivative. When S was very small, the impact of noise on the I–V characteristic curve was very significant, and accurate derivatives were not easily obtained. In this case, the series resistance values obtained by the proposed method need to be treated with caution. In addition, the proposed method can be combined with other fault diagnosis methods to achieve comprehensive evaluation of the operating status of PV modules.
Data availability statement
The original contributions presented in the study are included in the article/Supplementary Material, further inquiries can be directed to the corresponding author.
Author contributions
SW: Conceptualization, Writing–original draft. HW: Investigation, Methodology, Writing–original draft. YG: Formal Analysis, Project administration, Writing–review and editing. SL: Validation, Writing–review and editing. RAA: Validation, Writing–review and editing.
Funding
The author(s) declare financial support was received for the research, authorship, and/or publication of this article. This work was financially supported by the Key University Science Research Project of the Anhui Province (grant no. KJ 2021A0508), National Foundation Pre-Research Project of Anhui Polytechnic University (grant no. Xjky2020019), Collaborative Innovation Project of Anhui Universities (grant no. GXXT-2020-070), and the National Natural Science Foundation of China (grant no. U21A20146).
Conflict of interest
The authors declare that the research was conducted in the absence of any commercial or financial relationships that could be construed as a potential conflict of interest.
Publisher’s note
All claims expressed in this article are solely those of the authors and do not necessarily represent those of their affiliated organizations, or those of the publisher, the editors and the reviewers. Any product that may be evaluated in this article, or claim that may be made by its manufacturer, is not guaranteed or endorsed by the publisher.
References
Abbassi, R., Abbassi, A., Jemli, M., and Chebbi, S. (2018). Identification of unknown parameters of solar cell models: a comprehensive overview of available approaches. Renew. Sustain. Energy Rev. 90, 453–474. doi:10.1016/j.rser.2018.03.011
Achouby, H. E., Zaimi, M., Ibral, A., and Assaid, E. M. (2018). New analytical approach for modelling effects of temperature and irradiance on physical parameters of photovoltaic solar module. Energy Convers. Manag. 177, 258–271. doi:10.1016/j.enconman.2018.09.054
Ali, A., Almutairi, K., Padmanaban, S., Tirth, V., Algarni, S., Irshad, K., et al. (2020). Investigation of MPPT techniques under uniform and non-uniform solar irradiation condition-a retrospection. IEEE Access 8, 127368–127392. doi:10.1109/access.2020.3007710
Bendaoud, R., Amiry, H., Benhmida, M., Zohal, B., Yadir, S., Bounouar, S., et al. (2019). New method for extracting physical parameters of PV generators combining an implemented genetic algorithm and the simulated annealing algorithm. Sol. Energy 194, 239–247. doi:10.1016/j.solener.2019.10.040
Bissels, G. M. M. W., Schermer, J. J., Asselbergs, M. A. H., Haverkamp, E. J., Mulder, P., Bauhuis, G. J., et al. (2014). Theoretical review of series resistance determination methods for solar cells. Sol. Energy Mater. Sol. Cells 130, 605–614. doi:10.1016/j.solmat.2014.08.003
Branker, K., Pathak, M. J. M., and Pearce, J. M. (2011). A review of solar photovoltaic levelized cost of electricity. Renew. Sustain. Energy Rev. 9, 4470–4482. doi:10.1016/j.rser.2011.07.104
Carrero, C., Amador, J., and Arnaltes, S. (2007). A single procedure for helping PV designers to select silicon PV module and evaluate the loss resistances. Renew. Energy 15, 2579–2589. doi:10.1016/j.renene.2007.01.001
Chaibi, Y., Malvoni, M., Chouder, A., Boussetta, M., and Salhi, M. (2019). Simple and efficient approach to detect and diagnose electrical faults and partial shading in photovoltaic systems. Energy Convers. Manag. 196, 330–343. doi:10.1016/j.enconman.2019.05.086
Chen, Z., Chen, Y., Wu, L., Cheng, S., and Lin, P. (2019a). Deep residual network based fault detection and diagnosis of photovoltaic arrays using current-voltage curves and ambient conditions. Energy Convers. Manag. 198, 111793. doi:10.1016/j.enconman.2019.111793
Chen, Z., Chen, Y., Wu, L., Cheng, S., Lin, P., and You, L. (2019b). Accurate modeling of photovoltaic modules using a 1-D deep residual network based on I-V characteristics. Energy Convers. Manag. 186, 168–187. doi:10.1016/j.enconman.2019.02.032
De Soto, W., Klein, S. A., and Beckman, W. A. (2006). Improvement and validation of a model for photovoltaic array performance. Sol. Energy 80, 78–88. doi:10.1016/j.solener.2005.06.010
Dyk, E. E. V., and Meyer, E. L. (2004). Analysis of the effect of parasitic resistances on the performance of photovoltaic modules. Renew. Energy 29, 333–344. doi:10.1016/s0960-1481(03)00250-7
Fébba, D. M., Rubinger, R. M., Oliveira, A. F., and Bortoni, E. C. (2018). Impacts of temperature and irradiance on polycrystalline silicon solar cells parameters. Sol. Energy 174, 628–639. doi:10.1016/j.solener.2018.09.051
Garoudja, E., Chouder, A., Kara, K., and Silvestre, S. (2017). An enhanced machine learning based approach for failures detection and diagnosis of PV systems. Energy Convers. Manag. 151, 496–513. doi:10.1016/j.enconman.2017.09.019
Haque, A., Alshareef, A., Khan, A. I., Alam, M. M., Kurukuru, V. S. B., and Irshad, K. (2020). Data description technique-based islanding classification for single-phase grid-connected photovoltaic system. Sensors 20, 3320. doi:10.3390/s20113320
IEC 60891 (2009) Photovoltaic devices - procedures for temperature and irradiance corrections to measured I-V characteristics. Geneva, Switzerland: IEC.
Jain, A., and Kapoor, A. (2004). Exact analytical solutions of the parameters of real solar cells using Lambert W-function. Sol. Energy Mater. Sol. Cells 81, 269–277. doi:10.1016/j.solmat.2003.11.018
Jufri, F. H., Oh, S., and Jung, J. (2019). Development of photovoltaic abnormal condition detection system using combined regression and Support Vector Machine. Energy 176, 457–467. doi:10.1016/j.energy.2019.04.016
Kalliojärvi-Viljakainen, H., Lappalainen, K., and Valkealahti, S. (2022). A novel procedure for identifying the parameters of the single-diode model and the operating conditions of a photovoltaic module from measured current–voltage curves. Energy Rep. 8, 4633–4640. doi:10.1016/j.egyr.2022.03.141
Khan, F., Singh, S. N., and Husain, M. (2010). Determination of diode parameters of a silicon solar cell from variation of slopes of the I–V curve at open circuit and short circuit conditions with the intensity of illumination. Semicond. Sci. Technol. 25, 015002. doi:10.1088/0268-1242/25/1/015002
Kim, W., and Choi, W. (2010). A novel parameter extraction method for the one-diode solar cell model. Sol. Energy 84, 1008–1019. doi:10.1016/j.solener.2010.03.012
King, D. L., Quintana, M. A., Kratochvil, J. A., Ellibee, D. E., and Hansen, B. R. (2000). Photovoltaic module performance and durability following long-term field exposure. Prog. Photovoltaics 2, 241–256. doi:10.1002/(sici)1099-159x(200003/04)8:2<241::aid-pip290>3.0.co;2-d
Li, B., Migan-Dubois, A., Delpha, C., and Diallo, D. (2021). Evaluation and improvement of IEC 60891 correction methods for I-V curves of defective photovoltaic panels. Sol. Energy 216, 225–237. doi:10.1016/j.solener.2021.01.010
Li, Y., Ding, K., Zhang, J., Chen, F., Chen, X., and Wu, J. (2019). A fault diagnosis method for photovoltaic arrays based on fault parameters identification. Renew. energy 143, 52–63. doi:10.1016/j.renene.2019.04.147
Lim, L. H. I., Ye, Z., Ye, J., Yang, D., and Du, H. (2015). A linear method to extract diode model parameters of solar panels from a single I-V curve. Renew. Energy 76, 135–142. doi:10.1016/j.renene.2014.11.018
Livera, A., Theristis, M., Makrides, G., and Georghiou, G. E. (2019). Recent advances in failure diagnosis techniques based on performance data analysis for grid-connected photovoltaic systems. Renew. Energy 133, 126–143. doi:10.1016/j.renene.2018.09.101
Lyu, Y., Fairbrother, A., Gong, M., Kim, J. H., Gu, X., Kempe, M., et al. (2020). Impact of environmental variables on the degradation of photovoltaic components and perspectives for the reliability assessment methodology. Sol. Energy 199, 425–436. doi:10.1016/j.solener.2020.02.020
Ma, T., Yang, H., and Lu, L. (2014). Development of a model to simulate the performance characteristics of crystalline silicon photovoltaic modules strings arrays. Sol. Energy 100, 31–41. doi:10.1016/j.solener.2013.12.003
Malik, M. Z., Tirth, V., Ali, A., Farooq, A., Algahtani, A., Verma, R., et al. (2021). Efficient topology for DC-DC boost converter based on charge pump capacitor for renewable energy system. Int. J. Photoenergy 2021, 1–13. doi:10.1155/2021/6675720
Mares, O., Paulescu, M., and Badescu, V. (2015). A simple but accurate procedure for solving the five-parameter model. Energy Convers. Manag. 105, 139–148. doi:10.1016/j.enconman.2015.07.046
National Energy Administration (2022). 2021 electricity and other energy statistics (preliminary). Available at: https://www.chinaenergyportal.org.
Orioli, A. (2020). An accurate one-diode model suited to represent the current-voltage characteristics of crystalline and thin-film photovoltaic modules. Renew. Energy 145, 725–743. doi:10.1016/j.renene.2019.06.074
Ortiz-Conde, A., and García-Sánchez, F. J. (2018). A new approach to the extraction of single exponential diode model parameters. Solid State Electron. 144, 33–38. doi:10.1016/j.sse.2018.02.013
Piliougine, M., Spagnuolo, G., and Sidrach-de-Cardona, M. (2020). Series resistance temperature sensitivity in degraded mono-crystalline silicon modules. Renew. Energy 162, 677–684. doi:10.1016/j.renene.2020.08.026
Polverini, D., Tzamalis, G., and Mullejans, H. (2012). A validation study of photovoltaic module series resistance determination under various operating conditions according to IEC 60891. Prog. Photovoltaics 6, 650–660. doi:10.1002/pip.1200
Pysch, D., Mette, A., and Glunz, S. W. (2007). A review and comparison of different methods to determine the series resistance of solar cells. Sol. Energy Mater. Sol. Cells 91, 1698–1706. doi:10.1016/j.solmat.2007.05.026
Qaiyum, S., Margala, M., Kshirsagar, P. R., Chakrabarti, P., and Irshad, K. (2023). Energy performance analysis of photovoltaic integrated with microgrid data analysis using deep learning feature selection and classification techniques. Sustainability 15, 11081. doi:10.3390/su151411081
Ren21 (2022). Renewables 2022 global status report. Available at: https://www.ren21.net.
Shinong, W., Qianlong, M., Jie, X., Yuan, G., and Shilin, L. (2020). An improved mathematical model of photovoltaic cells based on datasheet information. Sol. Energy 199, 437–446. doi:10.1016/j.solener.2020.02.046
Singh, R., Sharma, M., Rawat, R., and Banerjee, C. (2018). An assessment of series resistance estimation techniques for different silicon based SPV modules. Renew. Sustain. Energy Rev. 98, 199–216. doi:10.1016/j.rser.2018.09.020
Sun, X., Chavali, R. V. K., and Alam, M. A. (2019). Real-time monitoring and diagnosis of photovoltaic system degradation only using maximum power point-the suns-Vmp method. Prog. Photovoltaics 1, 55–66. doi:10.1002/pip.3043
Toledo, F. J., and Blanes, J. M. (2014). Geometric properties of the single-diode photovoltaic model and a new very simple method for parameters extraction. Renew. Energy 72, 125–133. doi:10.1016/j.renene.2014.06.032
Villalva, M. G., Gazoli, J. R., and Filho, E. R. (2009). Comprehensive approach to modeling and simulation of photovoltaic arrays. IEEE Trans. Power Electron. 5, 1198–1208. doi:10.1109/tpel.2009.2013862
Wang, S., Chen, Q., and Gao, W. (2018). An improved analytical solution for MPP parameters of photovoltaic cells. Sol. Energy 174, 848–854. doi:10.1016/j.solener.2018.09.070
Wang, S., Luo, H., Ge, Y., and Liu, S. (2021). A new approach for modeling photovoltaic modules based on difference equation. Renew. Energy 168, 85–96. doi:10.1016/j.renene.2020.12.023
Yi, Z., and Etemadi, A. H. (2017). Line-to-line fault detection for photovoltaic arrays based on multiresolution signal decomposition and two-stage support vector machine. IEEE Trans. Industrial Electron. 11, 8546–8556. doi:10.1109/tie.2017.2703681
Zhang, Y., Hao, P., Lu, H., Ma, J., and Yang, M. (2022). Modelling and estimating performance for PV module under varying operating conditions independent of reference condition. Appl. Energy 310, 118527. doi:10.1016/j.apenergy.2022.118527
Keywords: photovoltaic module, series resistance, parameter extraction, current-voltage curve, current-voltage curve correction
Citation: Wang S, Wu H, Ge Y, Liu S and Ahmed Amer R (2024) A series resistance extraction method for health evaluation of photovoltaic modules. Front. Energy Res. 12:1319813. doi: 10.3389/fenrg.2024.1319813
Received: 11 October 2023; Accepted: 17 May 2024;
Published: 07 June 2024.
Edited by:
Sudhakar Babu Thanikanti, Chaitanya Bharathi Institute of Technology, IndiaReviewed by:
Rakeshkumar Mahto, California State University, Fullerton, United StatesKashif Irshad, King Fahd University of Petroleum and Minerals, Saudi Arabia
Copyright © 2024 Wang, Wu, Ge, Liu and Ahmed Amer. This is an open-access article distributed under the terms of the Creative Commons Attribution License (CC BY). The use, distribution or reproduction in other forums is permitted, provided the original author(s) and the copyright owner(s) are credited and that the original publication in this journal is cited, in accordance with accepted academic practice. No use, distribution or reproduction is permitted which does not comply with these terms.
*Correspondence: Shinong Wang, d3NuQGFocHUuZWR1LmNu