 Shujun Jiang1
 Wei Guan
- 1Department of Automobiles and Transportation, Wuxi Institute of Technology, Wuxi, China
- 2Department of Mechanical Engineering, Guangxi University, Nanning, China
- 3Technical Research Institute, Guangxi Yuchai Machinery Co., Ltd., Nanning, China
Nowadays, refrigerated food storage and transport vehicles are very common. However, with regard to the engine of vehicles, a significant amount of heat is discharged into the environment in the form of exhaust gas and jacket water. If the cooling system is used to convert this waste heat into cooling capacity, the thermal efficiency of the engine will be improved to a certain extent. Therefore, this paper uses two waste heat recovery jet refrigeration systems to recover heat from the exhaust gas and jacket water of the refrigerated vehicle. One is a conventional jet refrigeration system that uses only engine exhaust as the heat source, and the other is a system that adds a preheater upstream of the generator based on the conventional system, using engine jacket water to preheat the working fluid. This paper presents the results of comparing the impact of R141b/R123, R141b/R245fa, R142b/R134a, and R142b/R152a working fluids on system performance, and considers the effects of operating temperature and secondary flow pressure drop in the ejector receiving chamber on the system performance. The research results indicate that of the four selected working fluids, the R141b/R245fa (0.4/0.6) blend has the best overall performance. After the addition of a preheater, the system using R142b/R134a (0.6/0.4) hybrid working fluid achieves the maximum cooling capacity of 16.0994 kW and the maximum thermal efficiency of 5.45%, and the exergy loss in the generator is 1 kW lower than without the preheater.
1 Introduction
With the rapid improvement of people’s living conditions, the requirements for the quality of life continue to increase, which puts forward strict requirements for low-temperature preservation of food and long-distance frozen transportation (Liang et al., 2023a). Thanks to the continuous popularization of automobiles, the continuous improvement of low-temperature facilities and urban construction infrastructure, and the expansion of road networks in recent decades, refrigerated trucks of various specifications have entered people’s lives, realizing long- and short-distance low-temperature food refrigeration and preservation (Farzaneh-Gord et al., 2020). As we all know, only about 30%–40% of the energy released by fuel combustion in automobile engines can be converted into effective power output. Most of the remaining energy is discharged to the environment in the form of heat through jacket water and exhaust gas. Therefore, the consumption of fuel can be directly reduced if this part of the heat can be effectively used and converted into cold energy or electricity for use in the car in some way. This is beneficial to the reduction in waste of resources. More and more scholars apply the ejector refrigeration cycle to the waste heat refrigeration of automobiles, because of its small size, simple and compact structure, light weight, less moving parts and vibration. Even cars are running in complex road conditions, the ejector refrigeration system can operate relatively smooth (Chen, et al., 2014). Therefore, this paper considers the use of jet refrigeration for waste heat recovery of refrigerated vehicles, and the obtained cooling capacity is used to meet the refrigeration requirements of refrigerated vehicle compartments, and the performance of the system is theoretically analyzed. At present, most of the research on ejector refrigeration cycle is based on subcritical cycle. On this basis, this work is basically aimed at improving the performance of the system, and the main objective is to seek excellent refrigerants, improve the ejector, and study the combined cycle.
The refrigerant selection of the ejector refrigeration cycle is still dominated by pure working fluids, and binary or ternary mixed working fluids are rarely used, and new refrigerants with excellent performance and environmental friendliness are being actively sought to replace traditional refrigerants. Chen et al. (2016) proposed a new model to predict the performance of ejector refrigeration, and comprehensively evaluated R290, R717, R152a, R134a, R600a, R142b, R124, R600, R141b, R123 from the aspects of coefficient of performance (COP), safety, economic benefits and environmental friendliness under critical conditions. As for the sorting of COP, R290 > R717 > R152a > R134a > R600a > R142b > R124 > R600 > R141b > R123, the COP of R290 can reach up to 1.3, and the comprehensive evaluation shows that two relatively excellent refrigerants are R290 and R134a. Chen et al. (2014) and others simulated and analyzed the performance of four wet fluids, four dry fluids and one isentropic fluid (R134a, R152a, R290, R430A; R245fa, R600, R600a, R1234ze; R436B) in ejector refrigeration systems, and made the primary flow overheated. The results show that the COP of the four dry fluids is the highest, ranging from 0.33 to 0.38, followed by the four wet fluids, and the COP of the isentropic working fluid R436B is the lowest, only 0.18. Mwesigye and Dworkin. (2018) considered R1233zd(E), HFO1336mzz(Z), R1234ze(Z), R600, RE245fa2, and RE245fa2 as alternative refrigerants for R141b and R245fa, and studied the system’s performance under critical and subcritical conditions. It is found that R600, R1234ze(Z) and R1233zd(E) have better performance, their COPs are in the range of 0.35-0.60, 0.20-0.45, 0.14-0.30, respectively, while the system using HFO1336mzz(Z) has the worst performance.
The ejector is a particularly important component in the ejector refrigeration system, which has an important influence on the performance of the entire system (Shi et al., 2024). proposed a two-stage auto-cascade refrigeration cycle with two ejectors and found that the addition of two ejectors increased the COP and cooling capacity by 29.43% compared to the conventional two-stage auto-cascade refrigeration cycle, resulting in a significant improvement in performance. Mwesigye et al. (2020) explored the effect of different area ratios of ejectors on the performance of ejector refrigeration systems using R1233zd. They found that under optimal conditions, the COP of the system increases with the increase of the area ratio, and the ejector performance increases with decreasing generation temperature or increasing area ratio. Additionally, the largest exergy losses occur in the ejector as it increases as the temperature decreases and the area ratio increases (Liang et al., 2023b). proposed a novel transcritical CO2 cogeneration system and comprehensively analysed the performance of the system from a thermodynamic and economic point of view. The system was found to provide 502.8 kW of cooling to a cold store with a net power of 97.32 kW and to perform better than a system without an ejector. Since the environmental conditions and cooling capacity of the ejector are limited by the fixed geometry of the nozzle, Dennis et al. (2015) proposed a method to design the variable throat diameter and variable nozzle outlet diameter of the ejector, which aims to enable solar-driven ejection type refrigeration system with better operating performance. The position of the nozzle is also an important parameter affecting the efficiency of the ejector. Zhang et al. (2017) used R600a as the refrigerant to fix the geometry of the ejector, and discussed the effect of the nozzle position on the ejection rate and pressure lift through computational fluid dynamics technology, as well as summarized methods for optimizing injector design.
In addition to considering ejector refrigeration systems for cooling alone, many studies have also considered combining ejector refrigeration with other systems, such as the Rankine cycle, to obtain multiple outputs simultaneously. Yu and Du. (2010) theoretically analyzed and optimized the thermodynamic performance and economy of the jet power generation refrigeration cycle, and compared the thermodynamic properties of the system using six pure working fluids (R141b, R245fa, R600, R600a, R601, R601a) and mixed working fluids (R245fa/R601a) at different mixing ratios. They found that the system and performance are the best when the mixing ratio of R245fa/R601a is 0.4/0.6. In terms of economy, however, the system economy is the best only when R245fa is pure working fluid. Dai et al. (2009) proposed a novel cogeneration cycle, where a turbine is connected behind an ejector refrigeration system generator, thereby realizing the combination of ejector refrigeration and Rankine cycle to simultaneously output electricity and cooling capacity. In addition, the exergy analysis showed that the exergy losses in the boiler and ejector are larger. Zhang et al. (2023) proposed a novel combined power-cooling cycle using a hybrid liquid-gas-gas injector to improve system efficiency, and developed an integrated fluid flow model for the injector, which reduced the minimum cooling temperature by 20.5%, and the cooling capacity was significantly better than that of the one operating at a much larger temperature differential. Yang et al. (2015) conducted a research on the same cycle, but used a non-azeotropic mixture of isobutane/pentane as the refrigerant to compare the performance of the power generation refrigeration system with different components. Results showed that the exergy failure of each component varies with the change of the mixing ratio of the components, and the generation temperature has the greatest impact on the system performance while the evaporation temperature has the least impact. There is another combination of jet type and Rankine cycle. Wang et al. (2009) extracted part of the steam from the turbine as the primary flow to inject the secondary flow from the evaporator, and the mixed flow at the outlet of the ejector was combined with the turbine. The exhaust gas is mixed, and thermodynamic analysis found that most of the exergy losses comes from the generator, ejector, and turbine, therefore, structural optimization of these components should be focused.
With regards to the performance of the ejector refrigeration system, the use of a refrigerant with a low critical temperature can also be considered to improve the performance through a transcritical cycle, in addition to the combined cycle. Compared with the subcritical cycle, the biggest feature of the transcritical cycle is that it has temperature glide, which makes the working fluid absorb heat at variable temperature in the heat exchanger instead of constant temperature absorption, so as to better match the temperature of the heat source with less irreversibility and higher COP. At present, there are few studies on the ejector refrigeration transcritical cycle. Yu and Du. (2010) theoretically analyzed the influence of the main operating parameters on the performance of a transcritical ejector refrigeration cycle using R143a, and compared it with the traditional subcritical ejector refrigeration cycles using R134a. They pointed out that for systems operating in a transcritical state, special considerations are required in their manufacture due to their high working pressures. In order to find a refrigerant more suitable for ejection transcritical ejection refrigeration cycle, Wang et al. (2015) compared the performance of CO2, R1270, R32, R143a, R125 and R115 in ejector refrigeration cycle, and the results revealed that among the refrigerants, R1270 is the most suitable refrigerant for the transcritical cycle. In addition, the COP of the transcritical cycle is higher than that of the subcritical cycle. In addition, Bao et al. (2017) proposed a transcritical jet power generation refrigeration cycle, and considered the influence of seven working fluids with low critical temperature (R744, R32, R125, R115, R1234yf, R1234ze, R134a) and operating parameters on system performance. Results showed that R1234ze has the highest thermal and exergy efficiencies.
Based on the above content, two jet refrigeration cycle systems are designed in this paper: one is a system using engine exhaust as the heat source, and the other is a system using both jacket water and engine exhaust as the heat source. Furthermore, a comparative analysis was conducted on the impact of four different working fluid mixtures, namely, R141b/R123, R141b/R245fa, R142b/R134a, and R142b/R152a, on the performance of the two systems. This provides new insights and methods for the optimization design of ejector refrigeration systems. The main research contents of this paper are as follows:
(1) The thermodynamic models of conventional ejector refrigeration system and preheater ejector refrigeration system for waste heat recovery of refrigerated vehicles are established by Matlab, and the models are verified.
(2) Using the operating parameters (including the generation temperature, condensation temperature, and evaporation temperature), the type of mixed working medium, the mass fraction ratio of the mixed working medium, and the pressure drop of the secondary flow in the receiving chamber of the ejector as variables to explore its performance on the designed system Influence law of evaluation indicators (cooling capacity, COP, exergy destruction, exergy efficiency).
(3) According to the model calculation results, it is judged whether the cooling capacity of the two systems under different conditions can meet the cooling capacity of the refrigerated truck compartment, and the conventional injection refrigeration system for waste heat recovery of refrigerated vehicles and the preheater injection refrigeration system are evaluated respectively. The optimal working fluid of the refrigeration system and its optimal mass fraction ratio.
2 System description
Taking engine exhaust gas or jacket water as the heat source, the ejector refrigeration system for waste heat recovery of refrigerated trucks converts the heat into cold energy to provide cooling for the compartment. As shown in Figure 1, and its main components are generator, ejector, condenser, evaporator, circulating pump and throttle valve (Pan et al., 2020). Figure 2 shows the pressure-enthalpy diagram and temperature-entropy diagram of the ejector refrigeration system. The refrigerant liquid at the outlet of the condenser (point 3) is divided into two parts: one part of the refrigerant liquid is pressurized by the circulating pump (point 5) and absorb the heat from the exhaust gas of the refrigerated truck to become a high-temperature and high-pressure refrigerant steam in the generator (point 8); the other part of the refrigerant liquid is throttled by the throttling valve (point 4) and absorb the heat of the refrigerant to become a low-temperature and low-pressure refrigerant vapor in the evaporator (point 1) to achieve the cooling effect. The high-temperature and high-pressure refrigerant vapor is expanded in the ejector to form a low-pressure area, and then ejects the low-temperature and low-pressure refrigerant vapor from the evaporator to form a mixed flow which flows out of the ejector after being compressed (point 2). The mixed flow is condensed into refrigerant liquid in the condenser to enter the next cycle (Pan et al., 2020).
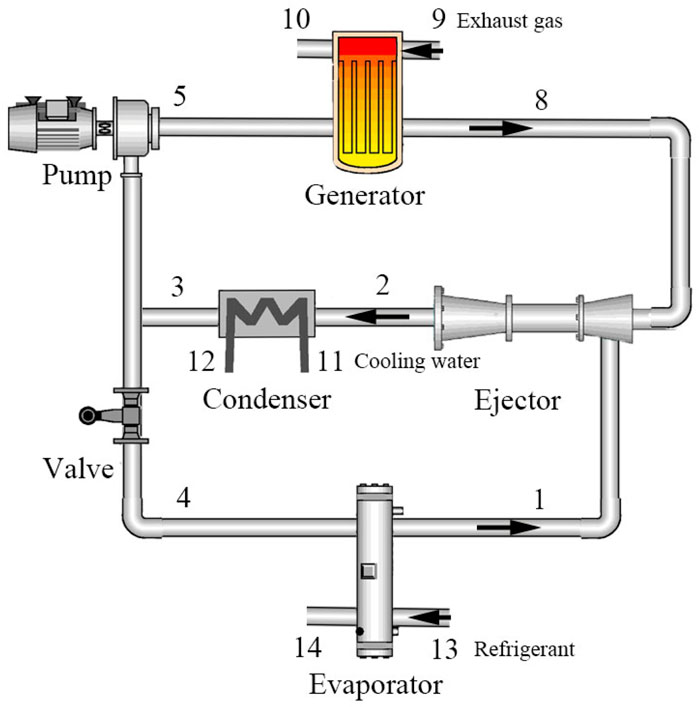
Figure 1. Layout diagram of ejector refrigeration system for waste heat recovery of refrigerated truck.
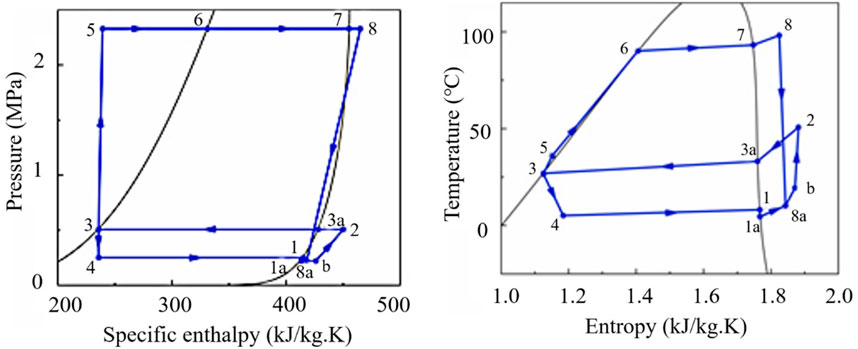
Figure 2. Pressure-enthalpy diagram and temperature-entropy diagram of ejector refrigeration system for waste heat recovery of refrigerated truck.
3 Model design and analysis method
In order to facilitate the simulation of the system, the following assumptions are made for the operation of the entire system (Dai et al., 2009):
The refrigerant is in the state of saturated liquid at the outlet of the condenser, in the state of saturated vapor at the outlet of the evaporator, and in the state of superheat at the outlet of the generator.
The system runs stably, without the pressure drop of the pipeline or the heat loss of each component to the environment.
The refrigerant is throttled without enthalpy change at the throttle valve.
3.1 Ejector thermodynamic model
The ejector is the core component of the ejector refrigeration system (Chen et al., 2017). The mixing model of the ejector can be divided into two types, one is the equal-pressure mixing theoretical model, and the other is the equal-area mixing theoretical model (Li et al., 2014). The isobaric mixing model means that the primary and secondary flows start to mix at a constant pressure before the equal-area section of the mixing chamber, and the equal-area mixing model means that the primary and secondary flows start at different pressures within the equal-area section of the mixing chamber mixed (Liang et al., 2020). A large number of studies on ejectors have found that the performance calculated by the isobaric mixing model is better than that of the equal-area mixing model (Li et al., 2014). Therefore, the one-dimensional isobaric mixing model is used for the simulation of the ejector in this paper. The schematic structure of the ejector is shown in Figure 3.
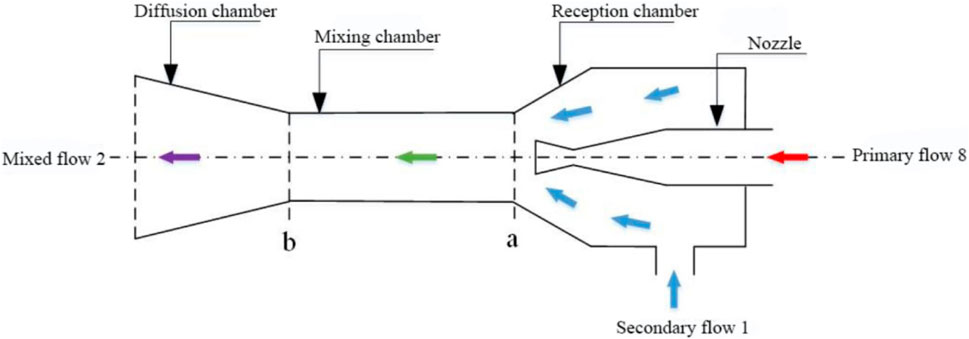
Figure 3. Ejector structure diagram.
Due to the complicated flow state and heat transfer mechanism of the fluid inside the ejector, some assumptions should be made to simplify the calculation process of the ejector, as follows:
(1) The inner wall of the ejector is adiabatic, that is, the heat loss is ignored;
(2) The flow process of the fluid inside the ejector is a one-dimensional stable flow process (Dai et al., 2009);
(3) The velocities of the primary flow, the secondary flow at the ejector inlet, and the mixed flow at the ejector outlet are ignored (Chen et al., 2014);
(4) The mixing process in the ejector is an isobaric mixing process and conforms to the conservation of energy, mass and momentum (Yan et al., 2015).
(5) The energy loss in the ejector is replaced by nozzle efficiency
(6) The pressure drop of the secondary flow in the receiving chamber of the ejector is a certain value (Li et al., 2014).
As a very important parameter to measure the performance of the ejector, the ejection rate is defined as the ratio of the mass flow of the secondary flow to the mass flow of the primary flow, which indicates the carrying capacity of the primary flow to the secondary flow. Considering the energy loss of the ejector in the model, the expression of the ejection rate can be obtained from Eq. 1 on the basis of the conservation of momentum (Chen, et al., 2014):
The nozzle efficiency
where vb and vbi represent the actual velocity and ideal velocity of the shock front mixing flow, respectively.
The flow process of primary flow can be calculated from Eqs 5–10:
The flow process of secondary flow (isentropic process) can be calculated from Eqs 11–14:
The mixing process can be calculated from Eqs 15–17:
The diffusion process can be calculated from Eqs 18–20:
3.2 Thermodynamic analysis and model validation
3.2.1 Thermodynamics first law analysis
Since the thermodynamic process of the ejector refrigeration system and the ejector refrigeration system with preheater are very similar, only the ejector refrigeration system is taken as an example to introduce its thermodynamic modeling process.
According to the law of conservation of energy, the calculation formulas (Eqs 21–23) can be determined for other components in the waste heat recovery jet refrigeration system of the refrigerated vehicle:
For the generator:
For the evaporator:
For the pump:
For a refrigeration system, the coefficient of performance is the most important performance index, which is defined by Eq. 24 (Yu and Yu, 2021):
3.2.2 Thermodynamics second law analysis
Based on the second law of thermodynamics, the exergy formula for each state point in the system is shown in Eq. 25 (Pan et al., 2020):
where, h0 and s0 represent the enthalpy and entropy of the medium at ambient temperature and ambient pressure, respectively.
According to the exergy of each state point, the exergy loss of each component of the system can be calculated by Eqs 26–31:
For the evaporator:
For the ejector:
For the condenser:
For the circulation pump:
For the evaporator:
For the throttle valve:
Exergy efficiency is another important evaluation parameter, and its expression is (Pan et al., 2020):
where Eref and Ein are calculated as shown in Eqs 33, 34:
3.2.3 Model validation
In this paper, the one-dimensional isobaric mixing ejector model (Li et al., 2014) is adopted, where the secondary flow pressure drop is considered. The ejector model used in this paper is verified using the calculation results in Yang. Based on the ejector model used in this paper, the initial conditions given by Yang are used for simulation, and compared with the relevant parameters of the state point inside the ejector calculated in the original text, as shown in Supplementary Appendix A1. The results show that the simulation results are basically consistent with the results of the literature, and the error is within the allowable error range, which proves that the accuracy of the ejector model used in this paper is sufficient.
In addition, in order to further verify the accuracy of the model, the experimental data in Huang (Yan et al., 2015) is used to compare with the theoretical data calculated by the model used in this paper under the same conditions, as shown in Supplementary Appendix A2.
3.3 The choice of mixed working fluid
At present, most of the researches on jet refrigeration use pure working fluid as refrigerant, and relatively few uses mixed working fluid. Since the heat exchange process is an isothermal and isobaric process, the pure working fluid cannot be well matched with the variable temperature heat source, resulting in a large amount of exergy loss in the heat exchanger. The boiling point of the non-azeotropic mixture changes with the change of the mixture components, and there is a temperature glide, and its heat transfer process is a temperature-changing phase change process, which can better achieve the temperature matching between the refrigerant and the heat transfer medium. Therefore, the non-azeotropic mixtures can effectively improve the performance of the jet refrigeration cycle. In addition, due to the complex and changeable operating conditions of automobiles, the exhaust temperature is not a fixed value. In order to better utilize the exhaust heat, this paper chooses to use the binary non-azeotropic mixture as the refrigerant of the waste heat recovery injection refrigeration system for refrigerated vehicles.
For the selection of mixed working fluids, there is no specific selection principle for the time being. However, the components that make up the mixed working fluid should meet the basic requirements of the ejector refrigeration system for refrigerants, including safety, environmental friendliness, chemical stability, thermal stability, economy and heat transfer. On the basis of meeting the above requirements, the selection of each component should be ensured that the boiling point difference of each component is appropriate to avoid the separation of components caused by the excessive difference in boiling point. The mixed working fluid only need to ensure that its critical characteristics, and standard boiling point can make the system run normally.
Therefore, based on the previous research on the refrigerants in the ejection refrigeration cycle, and taking into account the above factors, R141b/R123, R141b/R245fa, R142b/R134a, R142b/R152a were selected as the refrigerant of the waste heat recovery ejection refrigeration systems in the proposed two refrigerated vehicle. The characteristic parameters of each component of the mixed working medium and the characteristics of the mixed material are shown in Supplementary Appendix B1, B2.
3.4 Initial parameter settings
An engine with a rated power of 265 kW was selected for analysis. The exhaust temperature was 305.6°C, the exhaust flow was 572 kg/h, and the exhaust components are N2: 74.52%, H2O: 6.03%, CO2: 8.19%, O2: 11.26%.
For systems using mixed working fluids, the heat exchange process is not isothermal, but there is a certain temperature glide. Therefore, for the convenience of calculation, this paper defines the generation temperature as T6, the condensation temperature as T3a, and the evaporation temperature as T4. In addition, water is selected as the heat exchange medium in the condenser and evaporator.
The proposed waste heat recovery jet refrigeration system for the refrigerated vehicle is intended to provide cooling capacity for a Class A refrigerated vehicle with a size of 4900 mm × 2020 mm × 1860 mm and a surface area of 45.5384 m2 according to the cooling capacity calculation formula of the refrigerated vehicle proposed by (Gao et al., 2016):
Among them,

Table 1. Cooling capacity required for different refrigeration temperatures.
In order to successfully carry out the simulation of the refrigerated vehicle waste heat recovery jet refrigeration system, it is necessary to set some known conditions, which are summarized in Table 2.
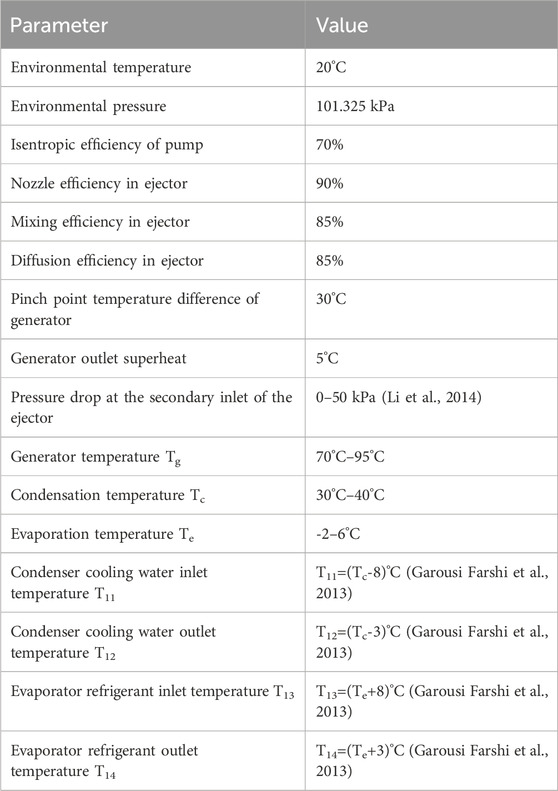
Table 2. Assumptions required for system simulation.
4 Performance analysis of jet refrigeration system driven by of refrigerated vehicles exhaust
The system analyzed in this chapter only uses the exhaust gas of the engine as the heat source, where the refrigerant exchanges heat with the exhaust gas in the generator. In order to explore the influence of different mass fractions of mixed working fluids on system performance, the working fluid type and mass fraction are used as variables, and other operating parameters are fixed, as follows: the generation temperature is set to 90°C, and the condensation temperature is set to is 30 °C, the evaporation temperature is set to 5°C, the superheat degree of the generator is set to 5°C, and the secondary flow pressure drop of the ejector receiving chamber is set to 5 kPa.
4.1 Influence of working fluid mixing ratio on system performance
Figure 4 shows the effects of different mass fractions of mixed working fluids on the performance of an ejector refrigeration system using only the exhaust gas of a refrigerated truck as the heat source of the generator. It can be seen from Figure 4A that the ejection rates of the four groups of mixed working fluids all first increase and then decrease. This is because in an ejector, the liquid mass is sprayed through a nozzle into a low pressure area and as the density of the liquid mass increases, the flow rate of the liquid also increases, thereby increasing the spray rate (Wang et al., 2019).
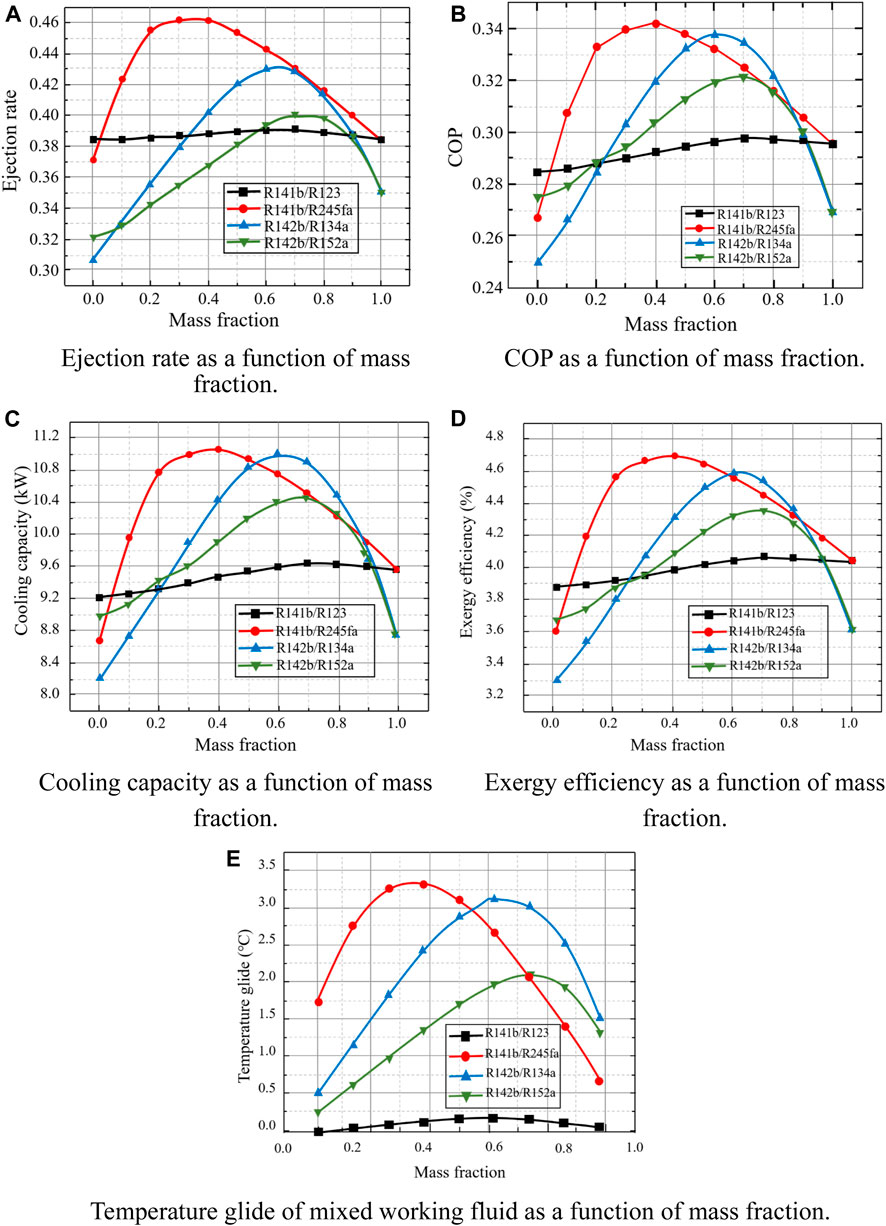
Figure 4. Effects of different mass fractions of mixed working fluids on the performance of an ejector refrigeration system. (A) Ejection rate as a function of mass fraction. (B) COP as a function of mass fraction. (C) Cooling capacity as a function of mass fraction. (D) Exergy efficiency as a function of mass fration. (E) Temperature glide of mixed working fluid as a function of mass fraction.
However, as the mixing ratio of the mixed work mass continues to increase, the viscosity of the mixture also increases. This increase in viscosity results in an increase in the resistance to flow of the mixture in the nozzle, resulting in a decrease in the injection rate. Among them, the ejection rate of R141b/R245fa and R142b/R134a changed most drastically with the mass fraction, while the ejection rate of R141b/R123 changed the most gently. Overall, the system using R141b/R245fa has the best ejection rate, almost all of which are higher than those using R141b/R123, and reaches a maximum value of 0.466 at a mass fraction of 0.3/0.7. The minimum ejection rate occurs when pure working fluid R134a is used, which is 0.3064. It can be seen from Eq. 1 that when the ejector model is fixed, the ejection rate mainly depends on the enthalpy value of each state point in each ejector, and this enthalpy value mainly depends on the type and nature of the working fluid.
Figure 4B shows the variation law of the coefficient of performance COP with the mass fraction. Consistent with the changing trends of ejection rate and cooling capacity, the four groups of working fluids all first increase and then decrease with the mass fraction. This is because, as can be seen from Eq. (24), the COP mainly has a positive correlation with the cooling capacity or the ejection rate. The COP of the system using R141b/R245fa and R142b/R134a is higher than the other two. When the mixture is R141b/R245fa, its maximum COP is 0.3418, which appears at the mass fraction of 0.4/0.6; among them, when the mixture is R142b/R134a, its maximum COP is 0.3379, which occurs at the mass fraction of 0.6/0.4; it is consistent with the position where the maximum Cooling capacity occurs.
Figure 4C shows the variation of system cooling capacity with refrigerant type and mass fraction. On the whole, in the four groups of mixed working fluids, the cooling capacity first increases and then decreases with the mass fraction, where the Cooling capacity of the system using R141b/R245fa, R142b/R134a, and R142b/R152a is much higher than that of using R141b/R123 in a wide range of mass fractions. The maximum cooling capacity appears when using R141b/R245fa (0.4/0.6), which is 11.0626 kW, but it is very different from the maximum cooling capacity (0.6/0.4, 11.0165 kW) obtained by using R142b/R134a. When only considering the mixed working fluid, in the range of mass fraction 0.1-0.5, the cooling capacity obtained by using R141b/R245fa is higher than other mixed working fluids, and in the range of 0.5-0.9, R142b/R134a is slightly dominant. Comparing Table 1, it is found that the cooling capacity of these four groups of mixed working fluids is much greater than the cooling capacity required by the refrigerated truck compartment at this evaporating temperature, regardless of the mass fraction ratio (Tashtoush et al., 2019). In addition, in order to obtain higher cooling capacity, it is recommended to select two refrigerants, R141b/R245fa or R142b/R134a.
Figure 4D shows the variation law of the exergy efficiency of the system. The variation law is similar to the first three, and the maximum exergy efficiency is 4.7% when R141b/R245fa (0.4/0.6) is used. The minimum exergy power of each group of working fluids appears in the state of pure working fluids, and the minimum exergy power when using R134a is only 3.37%.
In general, the change trends of these four evaluation parameters are basically the same, and the range of their maximum values is basically the same. The performance of the mixed working fluid is better than that of the pure working fluid, and each group of working fluids has the best performance at a certain mass fraction, which indicates that the use of mixed working fluids can improve the performance of the ejector refrigeration system. In terms of overall performance, among the four groups of mixed working fluids, that is, regardless of pure working fluids, R141b/R245fa is the best, R142b/R134a is slightly second, R142b/R152a is poor, R141b/R123 is the worst, where the optimal mixed working fluid and its ratio are R141b/R245fa and 0.4/0.6. The reasons for the above performance changes can be found by exploring the temperature glide of the mixed working fluid at different mass fractions.
Figure 4E shows the temperature glide of the four groups of mixed working fluids in the generator as a function of mass fraction. The variation law of the temperature glide is consistent with the variation law of the above four evaluation parameters, which indicates that the performance of the ejector refrigeration system using the mixed working fluid is related to the temperature glide. The greater the temperature slip, the higher the temperature matching degree with the variable temperature heat source, the greater the absorbed heat, the higher the average temperature, the greater the obtained primary flow and the secondary flow that can be ejected (Wang et al., 2020) is also larger, which results in better system performance.
Figure 5 shows the variation law of exergy loss of the six main components in the waste heat recovery jet refrigeration system with the mass fraction of the mixed working medium. No matter what kind of mixed working fluid is used, or what kind of mass fraction is used, the exergy loss of the generator is much higher than that of the other five components, and is basically around 7 kW; the exergy loss of the ejector is the second largest, basically around 3.5 kW; the third largest is the exergy loss of the condenser, which is probably in the range of 0.7-1. The exergy loss of the other three components is very small, but the exergy loss of the circulating pump using R142b/R134a and R142b/R152a is larger than that of using R141b/R123 and R141b/R245fa. No matter which part of the working fluid, the exergy loss does not change much with the mass fraction.
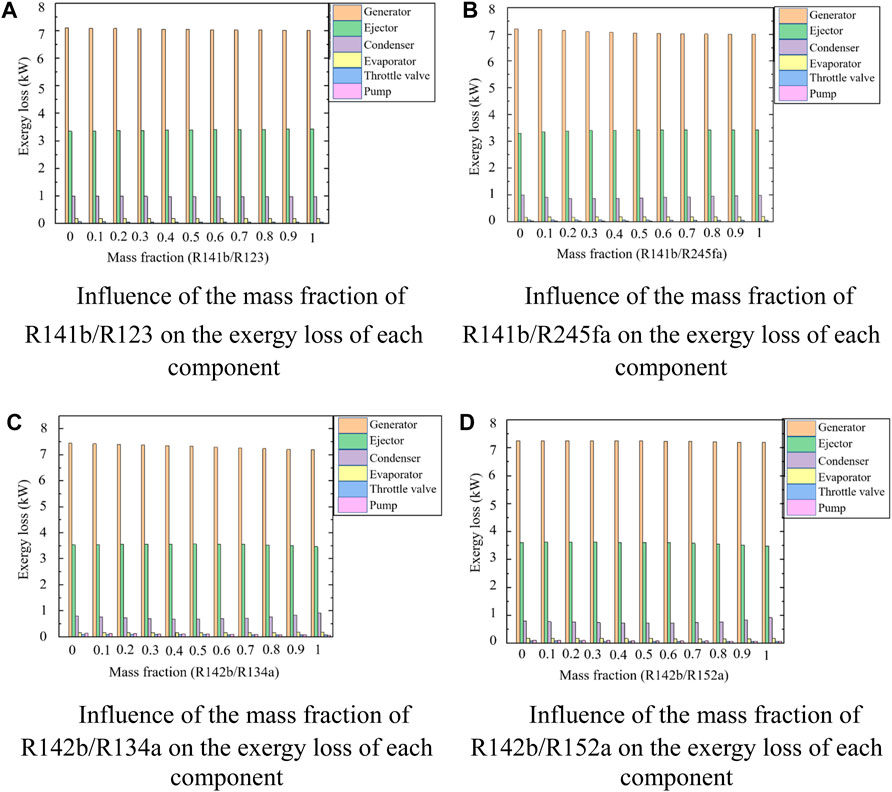
Figure 5. Variation of exergy loss of components with mass fraction using four sets of mixed working fluids. (A) Influence of the mass fraction of R141b/R123 on the exergy loss of each component. (B) Influence of the mass fraction of R141b/R245fa on the exergy loss of each component. (C) Influence of the mass fraction of R142b/R134a on the exergy loss of each component. (D) Influence of the mass fraction of R142b/R152a on the exergy loss of each component.
4.2 Effect of operating temperature on system performance
Operating temperature has a significant impact on system performance. In order to explore the influence of operating temperature on system performance, based on the data results in the previous section, with the optimal COP as the selection criterion, the optimal mixing ratios of the four groups of mixed working fluids are selected as the working fluids in this section (Yapıcı, 2008). The four groups of working fluids are: R141b/R123 (0.7/0.3), R141b/R245fa (0.4/0.6), R142b/R134a (0.6/0.4) and R142b/R152a (0.7/0.3). The standard operating conditions are set as: generation temperature is 90°C, condensation temperature is 30°C, evaporation temperature is 5°C, generator superheat degree is 5°C, and the secondary flow pressure drop in the ejector receiving chamber is set to 5 kPa. When exploring the effect of a certain operating temperature on performance, the remaining operating conditions are consistent with the standard operating conditions.
4.2.1 Influence of generation temperature on system performance
Figure 6 shows the variation of the performance of the waste heat recovery jet refrigeration system with the generation temperature. Four evaluation parameters all appear to increase with the increase of the generation temperature.
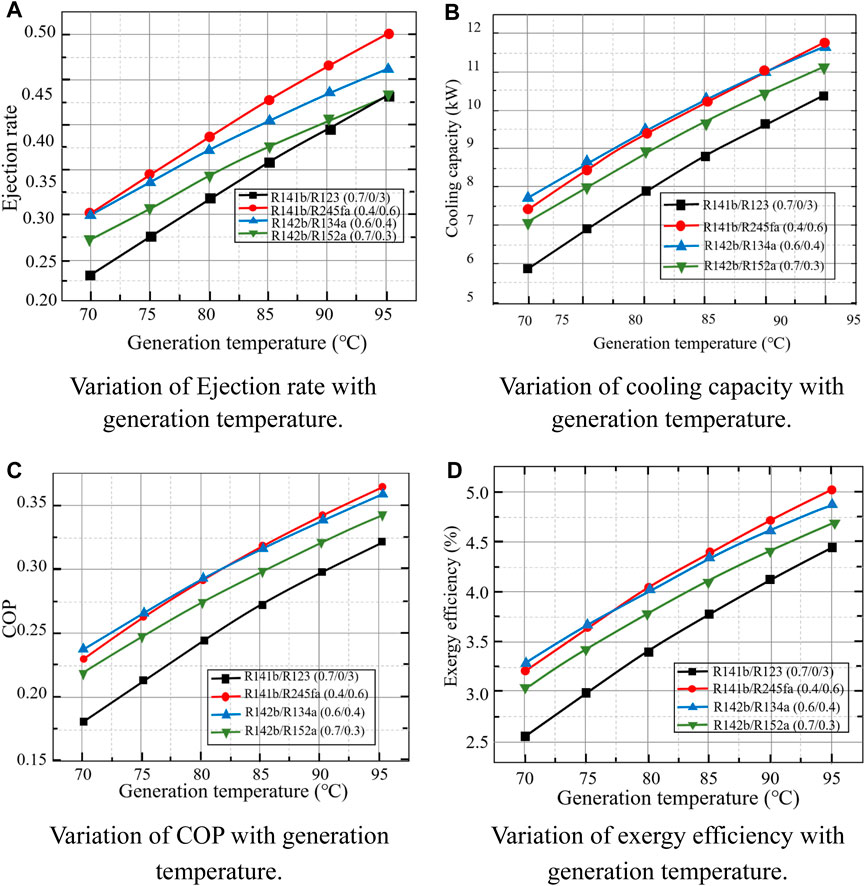
Figure 6. The variation of the performance of the waste heat recovery jet refrigeration system with the generation temperature. (A) Variation of Ejection rate with generation temperature. (B) Variation of cooling capacity with generation temperature. (C) Variation of COP with generation temperature. (D) Variation of exergy efficiency with generation temperature.
In Figure 6A, the ejector ejection rates of the R141b/R245fa (0.4/0.6) and R142b/R134a (0.6/0.4) systems are higher than those of the other two groups over the entire generation temperature range, where their ejection rate are close at the generation temperature of 70°C, and then the increase of the ejection rate of the R141b/R245fa (0.4/0.6) system is higher than that of the R142b/R134a (0.6/0.4) system with the increase of the generation temperature. The ejector ejection rates of the four groups of mixed working fluid systems all increase with the increase of the generation temperature, because the outlet temperature of the generator increases to enhance the enthalpy value of the corresponding state point increases when the generation temperature increases. When other conditions remain unchanged, the higher the enthalpy value of the exit point of the generator, that is, the higher the enthalpy value of the primary flow entering the ejector, the higher the ejection rate will be.
Changes in cooling capacity and COP are shown in Figures 6B, C. Comparing the two figures, it can be found that the variation law of cooling capacity and COP with the generation temperature is very similar. It can be seen that under the same generation temperature, R141b/R245fa (0.4/0.6) and R142b/R134a (0.6/0.4) are still the optimal mixed working fluid, and their cooling capacity and COP are not much different, which is consistent with the results in the previous section. For these two groups of working fluids, at about 85°C, the cooling capacity and COP of the two working fluid systems are equal, that is, an intersection occurs. Before this, the working fluid R142b/R134a (0.6/0.4) had a slight advantage, and then the cooling capacity and COP of the R141b/R245fa (0.4/0.6) system are slightly higher. This is because, as the generation temperature increases, the flow rate of the primary fluid decreases. It can be seen from Figure 6A that the ejection rate always increases with the increase of the temperature, where the ejection rate of the system using R141b/R245fa (0.4/0.6) is higher than the that of the other system. The R142b/R134a (0.6/0.4) system has a higher primary flow rate before the intersection, so it performs slightly better. With the increase of the generation temperature, the increase of the ejection rate of the R141b/R245fa (0.4/0.6) system is higher than that of the R142b/R134a (0.6/0.4) system, and the rate of increase in ejection rate is greater than the rate of decrease in primary flow, so the cooling capacity and COP increase with the temperature increase, and the performance of R141b/R245fa (0.4/0.6) is better than that of R142b/R134a (0.6/0.4) after the intersection.
Figure 6D shows that the variation law of exergy efficiency with the generation temperature is consistent with the variation of cooling capacity and COP. This is because when the heat source temperature and heat source flow remain unchanged, the exergy efficiency mainly depends on the revenue exergy of the refrigerant in the evaporator, which is a proportional relationship. In summary, the performance of the working fluids R141b/R245fa (0.4/0.6) and R142b/R134a (0.6/0.4) are both excellent, and can be selected according to the needs of the temperature and specific conditions.
4.2.2 Effect of condensation temperature on system performance
Figure 7 describes the performance of conventional ejector refrigeration for waste heat recovery of refrigerated trucks as a function of the condensation temperature of the condenser. It can be clearly seen that no matter which set of working fluid is used, the ejector ejection rate, evaporator cooling capacity, COP and exergy efficiency all decrease significantly with increasing condensation temperature (Anand et al., 2013). This is because an increase in the condensing temperature leads to a decrease in the temperature difference in the condenser and an increase in the energy consumption of the pump. A decrease in the temperature difference results in a decrease in the efficiency and COP of the refrigeration cycle. At the same time, an increase in the condensing temperature causes a decrease in the evaporation rate of the liquid mass in the injector. Evaporation of the liquid mass in the ejector is a key step in heat absorption refrigeration, and a decrease in the evaporation rate results in a decrease in the injection rate. From the perspective of system performance COP, when the condensation temperature is between 22°C and 36°C, the COP varies from about 0.15 to 0.7, up to 0.67 (R141b/R245fa: 0.4/0.6, Tc = 22°C). In the previous section, when the temperature increased from 70°C to 95°C, the lowest COP is 0.18 and the highest is only 0.36. From the perspective of cooling capacity, the cooling capacity is 5.5–21.8 kW in the range of changing condensation temperature. When the condensation temperature is 22°C, among the four groups of working fluids, the minimum cooling capacity is 18.8 kW (R141b/R123: 0.7/0.3), which is also much higher than the target cooling capacity required by the refrigerated truck compartment. It can also be seen from Figure 7D that the exergy efficiency is in the range of about 3%–9%, which is generally high. In terms of R141b/R245fa (0.4/0.6) working fluid, when the condensation temperature increases from 22°C to 36°C, the COP drops from 0.67 to 0.2, a drop of nearly 70%; the cooling capacity dropped from 21.7 to 6.6 kW, with a drop of nearly 69.6%; the exergy efficiency dropped from 9.2% to 2.8%, with a drop of about 69.6%. To sum up, it can be found that the condensation temperature has a great influence on the system, so the appropriate condensation temperature can be adjusted as needed.
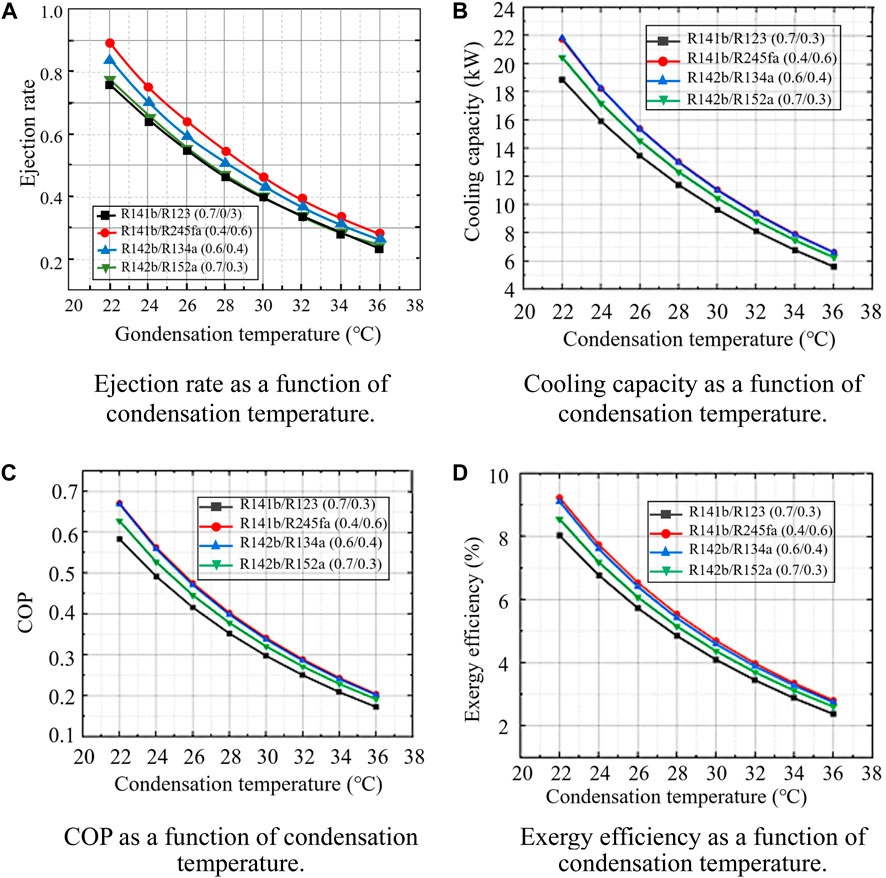
Figure 7. Effect of condensing temperature on refrigerated truck performance. (A) Ejection rate as a function of condensation temperature. (B) Cooling capacity as a function of condensation temperature. (C) COP as a function of condensation temperature. (D) Exergy efficiency as a function of condensation temperature.
4.2.3 Effect of evaporation temperature on system performance
Figure 8 depicts system performance as a function of evaporating temperature. Under the condition that the generation temperature and condensation temperature remain unchanged, the ejection rate and cooling capacity COP of the system all increase with the increase of the evaporating temperature (Anand et al., 2013). An increase in the evaporating temperature leads to an increase in the temperature difference in the evaporator and a decrease in the energy consumption of the pump. Efficiency and COP are related to the temperature difference between the two ends of the evaporator, and an increase in the temperature difference leads to an increase in the efficiency of the refrigeration cycle. An increase in the evaporation temperature results in an increase in the evaporation rate of the liquid mass in the ejector. Evaporation of the liquid mass in the ejector is a key step in achieving refrigeration by heat absorption, and an increase in the evaporation rate leads to an increase in the injection rate. It can be seen from Figures 8B, C that the change characteristics of cooling capacity and COP are very similar. In addition, for the two groups of working fluids, R141b/R245fa (0.4/0.6) and R142b/R134a (0.6/0.4), the change curves of cooling capacity and COP have a high degree of coincidence, and they are better than the other two working fluids in the entire evaporation temperature range. It can be seen that the performance of these two working fluids is excellent and similar. As the evaporating temperature increases, the slope of the curve becomes larger, that is, for each unit of evaporating temperature increase, the cooling capacity and COP increase. This is because the heat exchange in the evaporator is more sufficient as the temperature rise occurs. When the evaporation temperature is as low as −2°C, among the four groups of working fluids, the lowest cooling capacity is 5.8 kW, the highest is 6.9 kW, the lowest COP is 0.18, and the highest is 0.21. It can be seen that the performance of the system is very low at this time, and the cooling capacity that can be obtained is difficult to meet the cooling capacity of the cabin corresponding to the evaporating temperature. Figure 8D shows that the exergy efficiency of the system first increases rapidly and then decreases slightly with the increase of evaporation temperature. The reason is that, it can be seen in Eq. 32 that the exergy of the evaporator is proportional to the cooling capacity and inversely proportional to the evaporating temperature, and the cooling capacity increases with the rise of the evaporating temperature, so there will be a change in the exergy efficiency that first increases and then decreases.
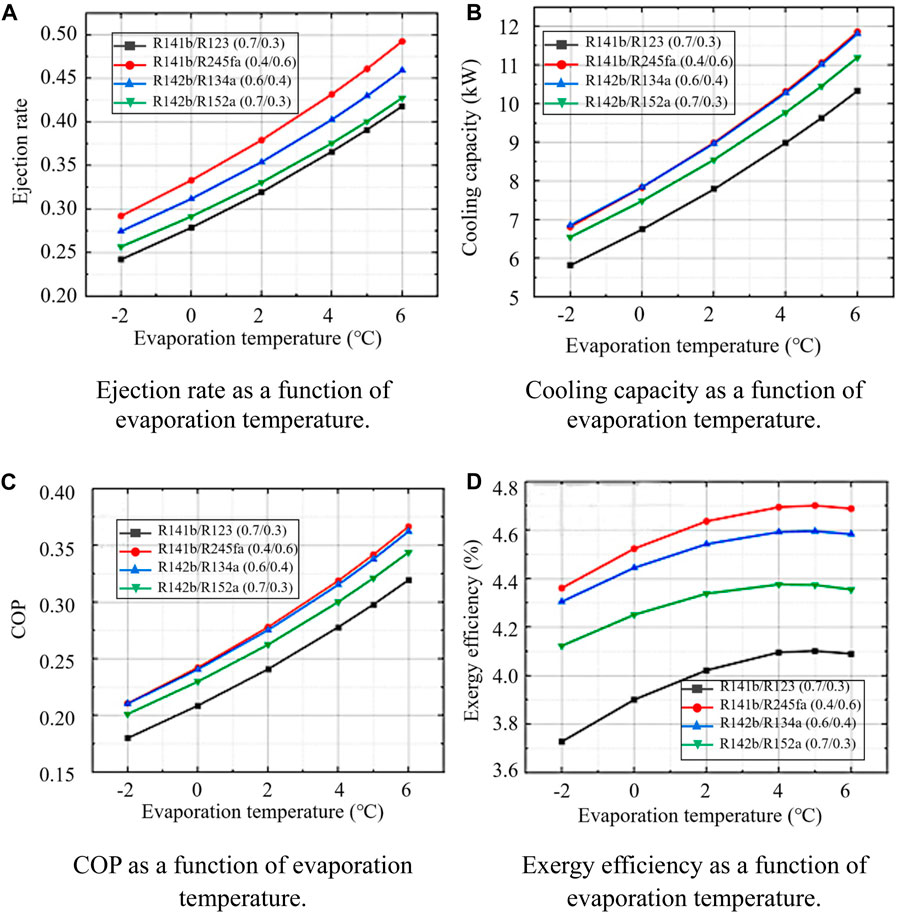
Figure 8. Effect of evaporation temperature on refrigerated truck performance. (A) Ejection rate as a function of evaporation temperature. (B) Cooling capacity as afunction of evaporation temperature. (C) COP as a function of evaporation temperature. (D) Exergy efficiency as a function of evaporation temperature.
4.3 Effect of secondary flow pressure drop on system performance
To improve the accuracy of the model, the ejector model used in this study does not ignore the pressure drop of the secondary flow. Therefore, in this section, the effect of the secondary flow pressure drop (5–25 kPa) on the ejector performance as well as the system performance is explored. Figure 9 shows the ejector ejection rate, system cooling capacity, COP and exergy efficiency with the change of pressure drop. The change rules of the four evaluation parameters of each group of mixed working fluids are basically the same, where the four evaluation parameters of two groups of mixed working fluids pf R142b/R134a (0.6/0.4) and R142b/R152a (0.7/0.3) all increase first and then decrease with the increase of pressure drop. In contrast, the four evaluation parameters of the systems using working fluids of R141b/R123 (0.7/0.3) and R141b/R245fa (0.4/0.6) decrease significantly with increasing pressure drop.
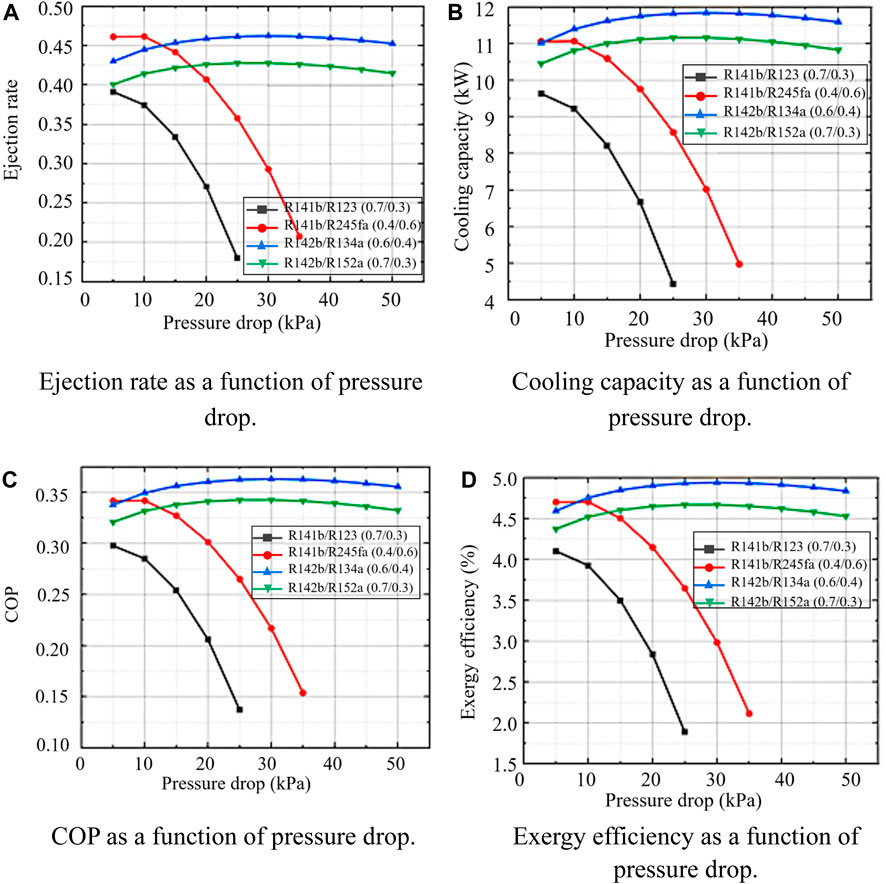
Figure 9. Effect of pressure drop on refrigerated truck performance. (A) Ejection rate as a function of pressure drop. (B) Cooling capacity as a function of pressure drop. (C) COP as a function of pressure drop. (D) Exergy efficiency as a function of pressure drop.
For the working fluid R141b/R123 (0.7/0.3), when the pressure drop is higher than 25 kPa, the outlet of the evaporator is very low, and the stable operation of the system cannot be guaranteed, so only the performance change in the range of 5–25 kPa pressure drop is considered. For the working fluid R141b/R245fa (0.4/0.6), the system cannot run stably when the pressure drop is higher than 35 kPa. For these two groups of working fluids, it can be clearly seen that the ejection rate, COP, etc. all drop sharply with the increase of pressure drop. When the pressure drop is 5 kPa, there is a maximum value, and the ejection rate, cooling capacity, COP, and exergy efficiency are respectively 0.391, 0.298, 9.637 kW, 4.10% for R141b/R123 (0.7/0.3), and 0.461, 0.341, 11.063 kW, 4.70% for R141b/R245fa (0.4/0.6). When the pressure drop is 25 and 35 kPa, the performance is the worst, the ejection rate, cooling capacity, COP, and exergy efficiency are respectively 0.180, 0.137, 4.436 kW, 1.89% for R141b/R123 (0.7/0.3), and 0.208, 0.154, 4.982 kW, 2.12% for R141b/R245fa (0.4/0.6), which makes the system cooling capacity and COP too low to meet the needs of refrigerated trucks. This is because, as can be seen from Supplementary Appendix B1, for the mixtures R141b/R123 (0.7/0.3) and R141b/R245fa (0.4/0.6), the critical temperature and critical pressure are 199.2481°C, 4.1186 Mpa and 175.8148°C, 3.8516 Mpa, respectively. The critical pressure and critical temperature are both high, so even if the generation temperature reaches 90°C, the corresponding generation pressure is still low (about 770 kPa, R141b/R245fa (0.4/0.6)), which makes the pressure of mixture lower in for the subsequent injection process, condensation process and evaporation process, and keep about 50 kPa before the secondary flow enters the ejector. The lower the overall operating pressure of the system, the more pronounced the effect of pressure drop on performance. Therefore, the performance of these two groups of mixed working fluids decreases rapidly with the increase of pressure drop.
The system performance using working fluids R142b/R134a (0.6/0.4) and R142b/R152a (0.7/0.3) first increased and then decreased with the increase of pressure drop, and the overall change was little, and both reached the maximum value when the pressure drop was 30 kPa. Emission rate, cooling capacity, COP, and exergy efficiency are 0.462, 0.363, 11.843 kW, 4.94% for R142b/R134a (0.6/0.4), and 0.428, 0.343, 11.165 kW, 4.67% for R142b/R152a (0.7/0.3). The reason for the different trend of the performance of these two groups of working fluids is different from the sharp decline of the above-mentioned two groups of working fluids. The critical temperature of these two groups of working fluids is relatively low, around 120°C. Therefore, when the generation temperature is 90°C, the generation pressure is relatively high, about 2.3 MPa, the overall operating pressure of the system is relatively high. The influence of pressure drop on performance is lower than that of the other two groups of working fluids. The pressure drop of the secondary flow is the representation of the energy conversion of the secondary flow in the receiving chamber of the ejector, that is, the pressure energy is converted into kinetic energy. The influence of the secondary flow velocity and the pressure level of the ejector on the system performance is opposite, so the two groups of mixed working fluids have an optimal pressure drop.
5 Performance analysis of refrigerated truck exhaust and jacket water driven jet refrigeration system
The system analyzed in this chapter is based on the conventional ejector refrigeration system, and a preheater is added before the generator to recover the heat of the engine jacket water. The system diagram is shown in Figure 10. It is assumed that the inlet temperature of the jacket water at the preheater is 90°C and the flow rate is 2.1 kg/s (Yu, 2013). Similarly, in this chapter, the influence of the mass fraction ratio of the mixed working medium on the system performance is firstly analyzed, and then the changes of the performance parameters with the operating temperature and the pressure drop of the secondary flow are briefly analyzed.
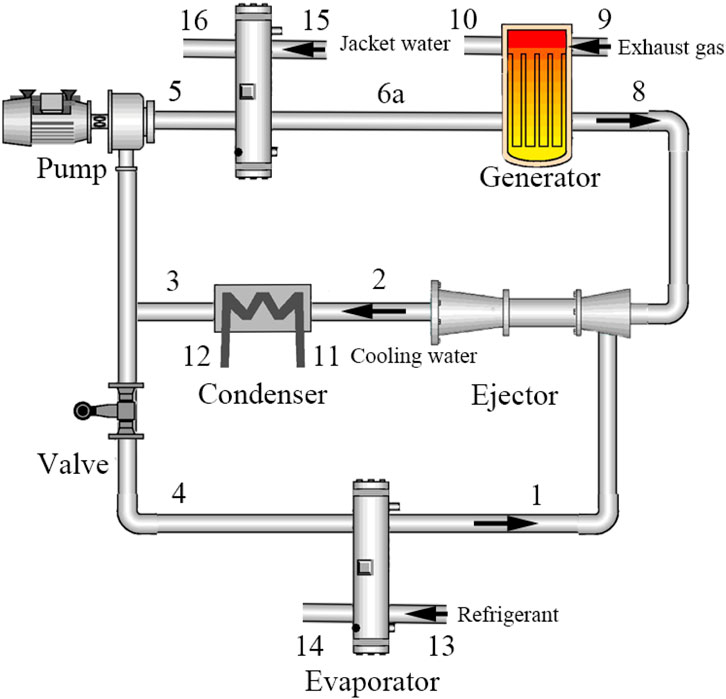
Figure 10. Diagram of ejector refrigeration system using preheater.
5.1 Influence of mixed working fluid mass fraction on system performance
Figures 11A, B show the change rule of the ejection rate and COP of the ejector refrigeration system driven by the jacket water and the exhaust gas of the refrigerated truck together with the mass fraction ratio of the mixed working medium. Regardless of whether the jacket water is used for preheating, the ejection rate and COP of the two systems are the same, that is, a preheater cannot change Ejection rate and COP of the system under the same other conditions. This is because adding a preheater only increases the total heat exchange between the working fluid and the heat source, thereby increasing the primary flow rate. The ejection rate is related to the ejector model and the parameters of each state point of the refrigerant. In the case of the same mixed working medium and mass fraction, adding a preheater does not change the state parameters of each state point, so the ejection rate remains unchanged. The ejection rate, the state parameters of each state point and the COP remain unchanged.
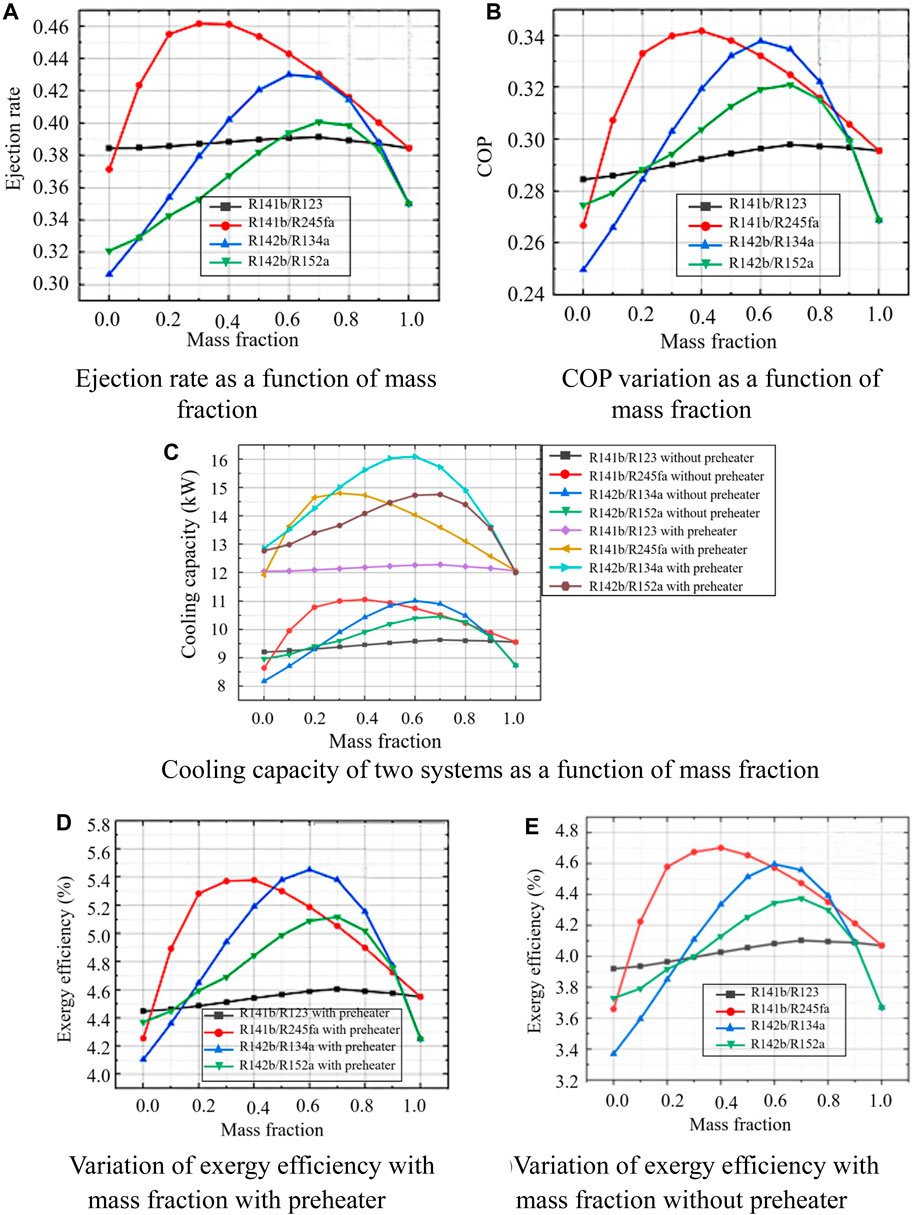
Figure 11. Effect of mass fraction of mixed working fluid on system performance with and without preheater. (A) Ejection rate as a function of mass fraction. (B) COP variation as a function of mass fraction. (C) Cooling capacity of two system as a function of mass fraction. (D) Variation of exergy efficiency with mass fraction with preheater. (E) Variation of exergy efficiency with mass fraction without preheater.
Figure 11C describes the variation of cooling capacity with mass fraction. For the convenience of comparative analysis, two sets of cooling capacity variation curve groups with and without preheater are shown in Figure 11C. Obviously, after adding the preheater, the overall cooling capacity of the system with four groups of mixed working fluids is much higher than that without the preheater, but the change trend is the same as that before the preheater is not used. After using the preheater, the maximum cooling capacity of the system appears at R142b/R134a (0.6/0.4), which is 16.0994 kW. When the preheater is not used, the cooling capacity here is 11.0165 kW, with an increase of about 46.14%. For the working fluid R141b/R245fa, the maximum cooling capacity occurs at the mass fraction ratio of 0.4/0.6 when the preheater is not used. After using the preheater, the maximum cooling capacity appears at 14.8066 kW, which is an increase of about 34.53% compared to the cooling capacity (11.0058 kW) when the preheater is not used at this mass fraction. The working fluid R142b/R152a has a maximum cooling capacity of 14.7606 kW (0.7/0.3), with an increase of about 41.13% compared to when the preheater (10.4590) is not used. For the working fluid R141b/R123, the overall cooling capacity does not change much with the mass fraction, and the overall cooling capacity is around 12 kW. The increase in cooling capacity is due to the existence of the preheater, which increases the total heat exchange between the primary stream and the heat source, thereby increasing the primary stream flow. When the ejection rate remains unchanged, the flow rate of the secondary flow also increases, so that the heat exchange with the refrigerant in the evaporator increases, that is, the cooling capacity increases. In addition, it can be seen that the increase rate of cooling capacity is very high by using the preheater.
It can be seen from Figures 11D, E that after the preheater is used, the exergy efficiency of each mixed working fluid is improved, but the overall change still shows a trend of first rising and then falling with the increase of the mass fraction (Sleiti et al., 2021). There is a mass-to-fraction ratio that makes exergy the most efficient. The highest exergy efficiency of the system occurs with R142b/R134a (0.6/0.4), which is 5.45%. The reason for the improvement of exergy efficiency is that when the preheater is not used, although the temperature difference of the heat exchange narrow point in the generator is preset to be 30°C, the temperature of state point 10 must be higher than 120 °C to avoid the influence of the acid dew point of the exhaust gas, the outlet of the exhaust heat source, the state point, which makes the actual heat exchange narrow point temperature difference in the generator higher than 30°C, the irreversible loss of heat exchange increases, and the exergy efficiency is low. After using the preheater, the heat required for the primary flow is first supplied by the jacket water, and then supplied by the exhaust gas. Compared with before, the heat absorbed from the exhaust gas is less at this time. Even with the acid dew point limitation, this makes the actual pinch point temperature difference in the generator lower than without the use of a preheater, thus reducing irreversibility. While there are exergy losses in the preheater, it is not as deeply affected as the reduced irreversibility in the generator. Therefore, the exergy efficiency of the whole system is improved.
Figure 12 depicts the change of the exergy loss of the system’s main components with varied the mass fraction ratio of the mixed working medium using the preheater. Combining the four diagrams Figure 12A–D, it can be found that the largest exergy loss still occurs in the generator and the ejector, followed by the condenser and the preheater, and the exergy loss in the two is not much different. Comparing with the results in Figure 5, it can be concluded that the exergy loss of the generator is about 6–6.5 kW after using the preheater, which is about 1 kW lower than that of without preheater. This is because the temperature of the refrigerant entering the generator increases, the temperature difference with the heat source decreases, and the irreversibility of heat transfer decreases after being preheated by the preheater.
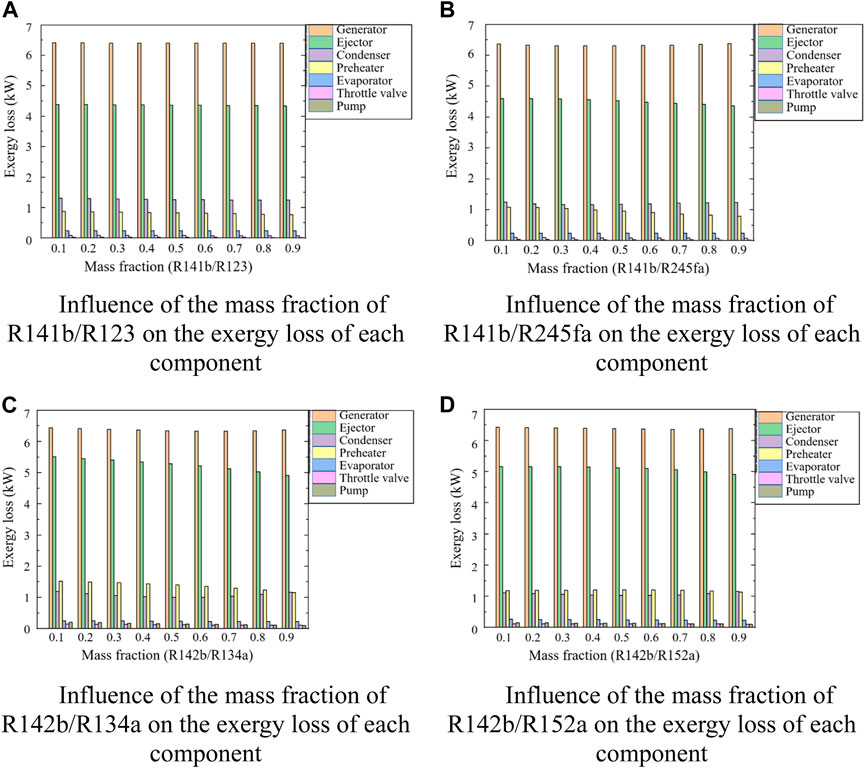
Figure 12. (A–D) show the variation of exergy loss of parts with mass fraction when four sets of mixed working fluids are used.
5.2 The effect of operating conditions on system performance
In the previous section, by combining the cooling capacity and exergy efficiency of the system, R142b/R134a (0.6/0.4) can be obtained as the optimal working fluid. This section examines the effect of operating conditions on the performance of a jet refrigeration system driven by both exhaust gas and jacket water, including generation temperature, condensation temperature, evaporating temperature, and secondary stream pressure drop. This section only uses R142b/R134a (0.6/0.4) as the working fluid to briefly discuss the above content.
5.2.1 Influence of generation temperature on system performance
Figure 13A depicts the trend of system performance as a function of generation temperature. Both the ejector ejection rate and the system COP increase with the increase of the generation temperature. This is because under the defined generation temperature, the corresponding generating pressure and the overall operating pressure of the system will increase when the generating temperature is increased, which improves the ejection rate and COP. The cooling capacity also increases with the increase of the temperature, where the cooling capacity changes very little when the temperature is between 75°C and 80°C and the cooling capacity has a maximum cooling capacity of 17 kW at 95°C. In contrast, the exergy efficiency first decreased and then increased with increased in the generation temperature. This may be because the degree of irreversibility caused by the preheater is greater than that by the generator when the generation temperature is lower than 80°C, owing to the increase in temperature.
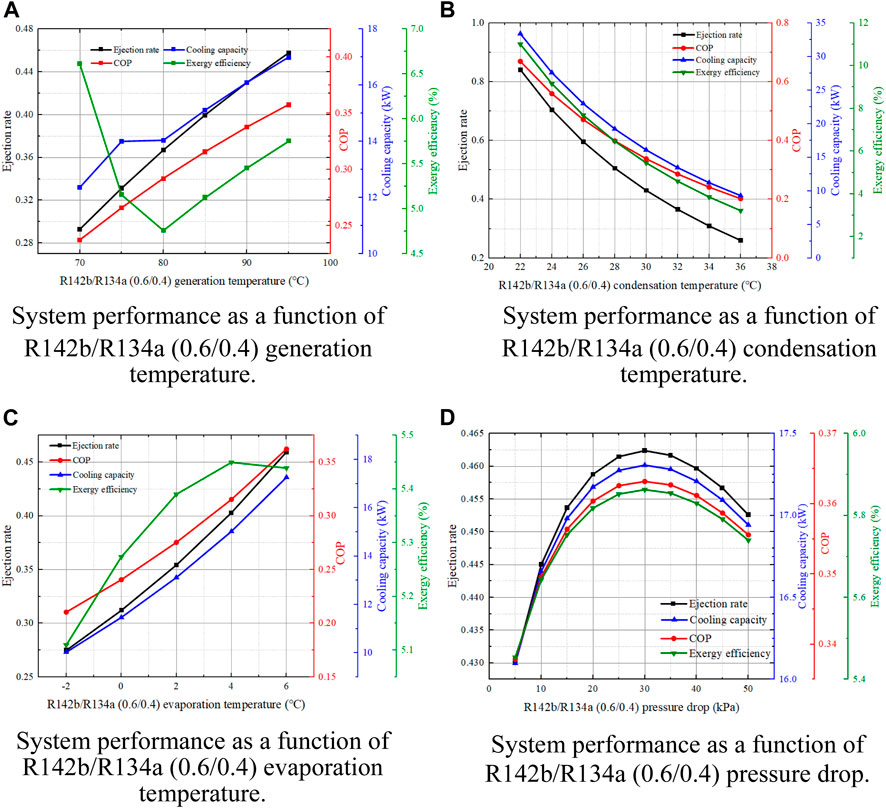
Figure 13. Effect of (A) generation temperature (B) condensation temperature (C) evaporation temperature and (D) pressure drop on System Performance with R142b/R134a (0.6/0.4) refrigerants.
5.2.2 Effect of condensation temperature on system performance
As shown in Figure 13B, the ejector ejection rate, COP, cooling capacity, and exergy efficiency all show a sharp decrease trend with the increase of condensation temperature. Under the condition that other conditions remain unchanged, when the condensation temperature is 22°C, the system has the best performance. At this time, the ejection rate, COP, cooling capacity and exergy efficiency are respectively: 0.85, 0.67, 33.39 kW, 11%, which is obviously an ideal condition. In practice, it is difficult to achieve such a low condensation temperature. However, in terms of the changing trend, the lower the condensation temperature, the better the performance of the system. Therefore, in order to improve the performance of the system, an appropriate and low condensation temperature should be selected as much as possible.
5.2.3 Effect of evaporation temperature on system performance
Figure 13C shows the change of the system performance with the evaporation temperature after using the preheater. Similarly, the change law of these four evaluation parameters is consistent with the change law when the preheater is not used. The ejection rate, COP and cooling capacity reached the optimal values at the evaporation temperature of 6°C, which were 0.46, 0.36 and 17.26 kW, respectively. However, the exergy efficiency shows a trend of increasing first and then decreasing, and the maximum exergy efficiency is 5.45% when the evaporation temperature is 5°C.
5.2.4 The effect of pressure drop on system performance
Figure 13D depict system performance as a function of secondary flow pressure drop. For the mixed working fluid we selected (R142b/R134a: 0.6/0.4), the ejection rate, COP, cooling capacity and exergy efficiency of the ejector all show a trend of increasing first and then decreasing with the increase of pressure drop. The optimal performance of the system occurs when the pressure drop is 30 kPa, and the ejection rate, COP, cooling capacity and exergy efficiency are 0.46, 0.36, 17.31 kW and 5.86%, respectively.
6 Conclusion
This paper presents the design of two jet refrigeration cycle systems: one is a conventional refrigeration system using engine exhaust as the heat source, and the other is an improved system with the addition of a preheater to recover heat from the jacket water. The study achieved energy savings and emission reductions, improved fuel utilization and provided cooling capacity for refrigerated vehicle compartments. The main research findings of this paper are as follows:
(1) Among the four refrigerants selected in the system, which include R141b/R123, R141b/R245fa, R142b/R134a, and R142b/R152a, the R141b/R245fa mixture with a mass fraction of 0.4/0.6 exhibits the best overall performance.
(2) Regardless of the working fluid chosen or its ratio, the sensible heat loss in the generator is the highest. In addition, using the preheater reduces the sensible heat loss in the generator by 1 kW compared to not using the preheater.
(3) The sensible exergy loss remains relatively unchanged with variations in the mass fraction of the working fluid, regardless of the hybrid working fluid chosen.
(4) The impact of the two selected working fluid blends, R141b/R123 (0.7/0.3) and R141b/R245fa (0.4/0.6), on system performance decreases significantly as the pressure drop increases. In addition, when the pressure drop reaches 25 kPa, the performance of the system using the R141b/R123 (0.7/0.3) mixture is the worst, while when the pressure drop reaches 35 kPa, the performance of the system using the R141b/R245fa (0.4/0.6) mixture is the worst.
(5) Regardless of which hybrid working fluid is used in the two systems, with the exception of the exergy efficiency, the system ejector ejection rate, coefficient of performance (COP), and cooling capacity all increase with the decrease of the decrease of the condensation temperature, the increase of the generator temperature, and the increase of the evaporator temperature.
(6) After adding the preheater, the system using R142b/R134a (0.6/0.4) hybrid refrigerant achieves a maximum cooling capacity of 16.0994 kW and a maximum exergy efficiency of 5.45%. This represents a 46.14% increase in cooling capacity compared to the case without the use of the preheater.
This study suggests the possibility of combining the ejector cycle with other cycles, such as the Rankine cycle, to achieve multiple outputs. Further research can explore how to optimize the performance of the combined cycle to improve energy efficiency and cooling capacity. This can include investigation of control strategies, thermodynamic cycle optimization and other aspects. These research directions can further promote the application of the ejector refrigeration cycle in the fields of waste heat recovery and refrigeration, improving system performance and energy use efficiency.
Data availability statement
The data analyzed in this study is subject to the following licenses/restrictions: The authors will supply the relevant data in response to reasonable requests. Requests to access these datasets should be directed to OTU2NjcxNzQzQHFxLmNvbQ==.
Author contributions
SJ: Writing–original draft, Methodology, Conceptualization. XP: Writing–original draft, Investigation, Data curation. SZ: Writing–review and editing, Software, Formal Analysis. YH: Writing–review and editing, Project administration, Formal Analysis. WQ: Supervision, Writing–review and editing. HS: Writing–review and editing, Software, Data curation. WG: Writing–review and editing, Validation, Supervision.
Funding
The author(s) declare financial support was received for the research, authorship, and/or publication of this article. This work was supported by the National Natural Science Foundation Project under Grant 22172038; Guangxi Key Research and Development Program under Grant AB21220059.
Conflict of interest
Authors SZ and HS were employed by Guangxi Yuchai Machinery Co., Ltd.
The remaining authors declare that the research was conducted in the absence of any commercial or financial relationships that could be construed as a potential conflict of interest.
Publisher’s note
All claims expressed in this article are solely those of the authors and do not necessarily represent those of their affiliated organizations, or those of the publisher, the editors and the reviewers. Any product that may be evaluated in this article, or claim that may be made by its manufacturer, is not guaranteed or endorsed by the publisher.
Supplementary material
The Supplementary Material for this article can be found online at: https://www.frontiersin.org/articles/10.3389/fenrg.2024.1300576/full#supplementary-material
References
Anand, S., Gupta, A., and Tyagi, S. K. (2013). Simulation studies of refrigeration cycles: a review. Renew. Sustain. Energy Rev. 17, 260–277. doi:10.1016/j.rser.2012.09.021
Bao, J., Lin, Y., and He, G. (2017). Working fluids comparison and thermodynamic analysis of a transcritical power and ejector refrigeration cycle (TPERC). Int. J. Refrig. 82, 262–272. doi:10.1016/j.ijrefrig.2017.05.025
Chen, J., Havtun, H., and Palm, B. (2014). Parametric analysis of ejector working characteristics in the refrigeration system. Appl. Therm. Eng. 69, 130–142. doi:10.1016/j.applthermaleng.2014.04.047
Chen, J., Havtun, H., and Palm, B. (2016). Screening of working fluids for the ejector refrigeration system. Int. J. Refrig. 47, 1–14. doi:10.1016/j.ijrefrig.2014.07.016
Chen, W., Shi, C., Zhang, S., Chen, H., Chong, D., and Yan, J. (2017). Theoretical analysis of ejector refrigeration system performance under overall modes. Appl. Energy 185, 2074–2084. doi:10.1016/j.apenergy.2016.01.103
Dai, Y., Wang, J., and Gao, L. (2009). Exergy analysis, parametric analysis and optimization for a novel combined power and ejector refrigeration cycle. Appl. Therm. Eng. 29, 1983–1990. doi:10.1016/j.applthermaleng.2008.09.016
Dennis, M., Cochrane, T., and Marina, A. (2015). A prescription for primary nozzle diameters for solar driven ejectors. Sol. Energy 115, 405–412. doi:10.1016/j.solener.2015.02.045
Farzaneh-Gord, M., Reza Rahbari, H., and Zangeneh, J. (2020). Effects of natural gas compositions on its Joule–Thomson coefficients and Joule–Thomson inversion curves. Cryogenics 111, 103169. doi:10.1016/j.cryogenics.2020.103169
Gao, P., Wang, L. W., Wang, R. Z., Zhang, X. F., Li, D. P., Liang, Z. W., et al. (2016). Experimental investigation of a MnCl2/CaCl2-NH3 two-stage solid sorption freezing system for a refrigerated truck. Energy 103, 16–26. doi:10.1016/j.energy.2016.02.145
Garousi Farshi, L., Mahmoudi, S. M. S., and Rosen, M. A. (2013). Exergoeconomic comparison of double effect and combined ejector-double effect absorption refrigeration systems. Appl. Energy 103, 700–711. doi:10.1016/j.apenergy.2012.11.022
Li, H., Cao, F., Bu, X., Wang, L., and Wang, X. (2014). Performance characteristics of R1234yf ejector-expansion refrigeration cycle. Appl. Energy 121, 96–103. doi:10.1016/j.apenergy.2014.01.079
Liang, Y., Sun, Z., Dong, M., Lu, J., and Yu, Z. (2020). Investigation of a refrigeration system based on combined supercritical CO2 power and transcritical CO2 refrigeration cycles by waste heat recovery of engine. Int. J. Refrig. 118, 470–482. doi:10.1016/j.ijrefrig.2020.04.031
Liang, Y., Ye, K., Zhu, Y., and Lu, J. (2023a). Thermodynamic analysis of two-stage and dual-temperature ejector refrigeration cycles driven by the waste heat of exhaust gas. Energy 278, 127862. doi:10.1016/j.energy.2023.127862
Liang, Y., Zhu, Y., Sun, Z., Ye, K., Wu, J., and Lu, J. (2023b). Feasibility assessment of a CO2 based power, cooling, and heating system driven by exhaust gas from ocean-going fishing vessel. J. Clean. Prod. 406, 137058. doi:10.1016/j.jclepro.2023.137058
Mwesigye, A., and Dworkin, S. B. (2018). Performance analysis and optimization of an ejector refrigeration system using alternative working fluids under critical and subcritical operation modes. Energy Convers. Manag. 176, 209–226. doi:10.1016/j.enconman.2018.09.021
Mwesigye, A., Kiamari, A., and Dworkin, S. B. (2020). Energetic optimization and exergetic performance investigation of an ejector refrigeration system using HCFO-1233zd(E) as a refrigerant. Int. J. Refrig. 112, 155–171. doi:10.1016/j.ijrefrig.2019.12.013
Pan, M., Bian, X., Zhu, Y., Liang, Y., Lu, F., and Xiao, G. (2020). Thermodynamic analysis of a combined supercritical CO2 and ejector expansion refrigeration cycle for engine waste heat recovery. Energy Convers. Manag. 224, 113373. doi:10.1016/j.enconman.2020.113373
Shen, A., Guan, K., Yang, X., Jin, S., and Yang, L. (2020). Theoretical analysis of a novel liquid-vapor separation condensation ejector refrigeration cycle with zeotropic mixtures. Energy Convers. Manag. 223, 113322. doi:10.1016/j.enconman.2020.113322
Shi, R., Bai, T., and Wan, J. (2024). Performance analysis of a dual-ejector enhanced two-stage auto-cascade refrigeration cycle for ultra-low temperature refrigeration. Appl. Therm. Eng. 240, 122152. doi:10.1016/j.applthermaleng.2023.122152
Sleiti, A. K., Al-Ammari, W. A., Vesely, L., and Kapat, J. S. (2021). Thermoeconomic and optimization analyses of direct oxy-combustion supercritical carbon dioxide power cycles with dry and wet cooling. Energy Convers. Manag. 245, 114607. doi:10.1016/j.enconman.2021.114607
Tashtoush, B. M., Al-Nimr, M. A., and Khasawneh, M. A. (2019). A comprehensive review of ejector design, performance, and applications. Appl. Energy 240, 138–172. doi:10.1016/j.apenergy.2019.01.185
Wang, F., Li, D. Y., and Zhou, Y. (2015). Theoretical research on the performance of the transcritical ejector refrigeration cycle with various refrigerants. Appl. Therm. Eng. 91, 363–369. doi:10.1016/j.applthermaleng.2015.08.036
Wang, J., Dai, Y., and Sun, Z. (2009). A theoretical study on a novel combined power and ejector refrigeration cycle. Int. J. Refrig. 32, 1186–1194. doi:10.1016/j.ijrefrig.2009.01.021
Wang, J.-X., Li, Y.-Z., Li, J.-X., Li, C., Zhang, Y., and Ning, X.-W. (2019). A gas-atomized spray cooling system integrated with an ejector loop: ejector modeling and thermal performance analysis. Energy Convers. Manag. 180, 106–118. doi:10.1016/j.enconman.2018.10.095
Wang, N., Zhang, S., Fei, Z., Zhang, W., Shao, L., and Sardari, F. (2020). Thermodynamic performance analysis a power and cooling generation system based on geothermal flash, organic Rankine cycles, and ejector refrigeration cycle; application of zeotropic mixtures. Sustain. Energy Technol. Assessments 40, 100749. doi:10.1016/j.seta.2020.100749
Yan, G., Chen, J., and Yu, J. (2015). Energy and exergy analysis of a new ejector enhanced auto-cascade refrigeration cycle. Energy Convers. Manag. 105, 509–517. doi:10.1016/j.enconman.2015.07.087
Yang, X., Zhao, L., Li, H., and Yu, Z. (2015). Theoretical analysis of a combined power and ejector refrigeration cycle using zeotropic mixture. Appl. Energy 160, 912–919. doi:10.1016/j.apenergy.2015.05.001
Yapıcı, R. (2008). Experimental investigation of performance of vapor ejector refrigeration system using refrigerant R123. Energy Convers. Manag. 49, 953–961. doi:10.1016/j.enconman.2007.10.006
Yu, G. (2013). Simulation and thermodynamic analysis of a bottoming Organic Rankine Cycle (ORC) of diesel engine (DE).
Yu, J., and Du, Z. (2010). Theoretical study of a transcritical ejector refrigeration cycle with refrigerant R143a. Renew. Energy 35, 2034–2039. doi:10.1016/j.renene.2010.02.004
Yu, M., and Yu, J. (2021). Thermodynamic analyses of a flash separation ejector refrigeration cycle with zeotropic mixture for cooling applications. Energy Convers. Manag. 229, 113755. doi:10.1016/j.enconman.2020.113755
Zhang, J., Zhang, Z., Zhou, S., Hui, H., Mei, N., and Yuan, H. (2023). Performance enhancement of the combined power-refrigeration cycle using a liquid-gas-gas ejector for ocean thermal energy conversion. Energy Convers. Manag. 296, 117688. doi:10.1016/j.enconman.2023.117688
Keywords: ejector refrigeration, preheater, waste heat recovery, refrigerator car, cooling capacity
Citation: Jiang S, Pan X, Zhang S, Huang Y, Que W, Sang H and Guan W (2024) Research on performance of jet refrigeration cycle driven by waste heat of refrigerated vehicle. Front. Energy Res. 12:1300576. doi: 10.3389/fenrg.2024.1300576
Received: 23 September 2023; Accepted: 21 February 2024;
Published: 26 March 2024.
Edited by:
Yulong Song, Xi’an Jiaotong University, ChinaReviewed by:
Hamid Reza Rahbari, Aalborg University, DenmarkSameer Sheshrao Gajghate, G H Raisoni College of Engineering and Management Pune INDIA, India
Copyright © 2024 Jiang, Pan, Zhang, Huang, Que, Sang and Guan. This is an open-access article distributed under the terms of the Creative Commons Attribution License (CC BY). The use, distribution or reproduction in other forums is permitted, provided the original author(s) and the copyright owner(s) are credited and that the original publication in this journal is cited, in accordance with accepted academic practice. No use, distribution or reproduction is permitted which does not comply with these terms.
*Correspondence: Wei Guan, Z3VhbndlaUBneHUuZWR1LmNu