 Ping Zhao1
 Chun Sing Lai
 Shen-En Peng
- 1Lishui Power Supply Company of State Grid Zhejiang Electric Power Co. Ltd., Zhejiang, China
- 2School of Automation, Guangdong University of Technology, Guangzhou, China
The effects of various energy conservation and carbon reduction (ECCR) strategies can differ significantly despite equal investment. Given limited amount of capital expenditure, managers and planners of industrial parks must carefully select from different ECCR strategies and implementation technologies to maximize investment returns. This study establishes mathematical models for four ECCR strategies: forestry carbon sequestration (FCS), carbon capture and utilization (CCU), waste heat recovery (WHR), and photovoltaic (PV). A universal ECCR planning optimization model is constructed to maximize annual economic benefits or carbon emission reduction. Using an industrial park in southern China as a case study, genetic algorithms are utilized to solve the model and validate its feasibility. The study analyzes three key parameters: capital expenditure caps, carbon trading price in the Emission Trading Scheme, and transportation distance of captured CO2 products for sensitivity. The results demonstrate considerable economic benefits of the CCU strategy when demand matches appropriately. However, in cases with limited capital expenditure, implementing small-scale FCS strategies in industrial parks is not advisable from both an economic and environmental perspective.
1 Introduction
China has the highest energy consumption and energy-related CO2 emissions in the world, reaching 26.1% and 30.7% respectively (Lin et al., 2022). In 2020, China’s industrial energy consumption accounted for over 66% of the total national consumption, and the cumulative greenhouse gas emissions from 2,500 national and provincial industrial parks will consume 11% of the global carbon budget by the end of their remaining lifecycle (Li et al., 2020; Jing et al., 2023). With high energy consumption and carbon emission, there is significant room for improvement in the energy efficiency of the industrial sector, a large amount of waste heat is dissipated into the environment due to inefficient use each year (Zhou et al., 2019; Li, 2020). Taking the steel industry as an example, the exhaust gas emitted from converters contains approximately 2.45 × 10¹¹ MJ of heat annually, with a recovery rate of less than 35% (Ren et al., 2022).
To fulfil the commitment of carbon neutrality, it is essential to address the energy consumption and carbon emissions challenges in the industrial sector promptly. This necessitates both government policy guidance from Chinese authorities and accelerated efforts by industrial parks and enterprises to prioritize energy conservation and carbon reduction (ECCR) (Rissman et al., 2020). Nan et al. (Zhou et al., 2019), Weishang et al. (Guo et al., 2023), and Zhijie et al. (Jia et al., 2022) have concluded that government policies such as Emission Trading Scheme, carbon tax, resource tax, quotas, and demand response can effectively promote social energy conservation and carbon reduction. Meanwhile, Raymond et al. (Côté and Liu, 2016) assert that industrial parks and enterprises can take actions in areas such as land use planning, energy, and transportation infrastructure to promote ECCR. According to the carbon peak action plan announced by the State Council of the PRC, industrial parks should take actions in energy transformation, facility energy-saving renovation, energy utilization efficiency improvement, resource recycling, and carbon sinks (GOV, 2021). This provides a clear direction for ECCR in the industrial sector.
Although ECCR in the industrial sector is a crucial part of China’s goal of achieving carbon neutrality, the existing more than 15,000 industrial parks contribute up to 30% to the national economy. The responsibility for economic development still lies with industrial parks (Qian et al., 2022; Yu et al., 2022). Therefore, to continue promoting sustainable and high-quality development, we need to develop effective implementation schemes for industrial park managers to effectively promote ECCR while maintaining sufficient economic growth momentum.
Energy conservation is not only crucial for reducing carbon emissions but also provides significant economic benefits. To achieve this, industrial parks can adopt various strategies such as device energy-saving modifications (Guo et al., 2020), implementing integrated energy systems (Guo et al., 2023), utilizing waste heat (Kim et al., 2018), and promoting the use of renewable energy (Feng et al., 2018; Wei et al., 2022; Jing et al., 2023). Additionally, it is important to note that while strategies like carbon capture and utilization (CCU), carbon capture and storage, and forestry carbon sequestration (FCS) may require additional energy consumption, they have excellent carbon reduction and sequestration capabilities (Bastin et al., 2019; Rissman et al., 2020; Chen et al., 2022). The deployment of carbon capture and storage and CCU can help mitigate the stranded costs associated with a substantial amount of infrastructure, yet these strategies are primarily utilized as pilot applications due to revenue and other considerations (Yang et al., 2022). FCS is an important means for achieving carbon neutrality in transportation and energy-intensive industries by offsetting emissions that are difficult to reduce (Davis et al., 2018). However, this strategy has a long-time horizon and there is relatively limited research on its contribution to carbon reduction and profitability in industrial parks. In the future, with the development of the Emission Trading Scheme and the maturity of technologies, carbon capture and storage, CCU, and FCS will have better prospects for application (Yang et al., 2022; Ge et al., 2023).
In the planning of ECCR schemes in industrial parks, it is essential to maximize the use of limited funds to enhance their efficacy. Optimize the variables such as the strategies selection and capacity determination for ECCR schemes are crucial. The existing literature primarily can be classified into two categories:
The first type primarily concentrates on particular scenarios and devises tailored emission reduction schemes, ultimately assessing the efficacy and implications of the proposed schemes. For example, Hongsheng et al. (Wang et al., 2013) have investigated three potential development pathways for Suzhou Industrial Park. The scheme that prioritizes clean energy replacement and other ECCR strategies will reduce carbon intensity by 38%, though reaching the set greenhouse gas emission reduction objectives remain challenging. Jing-Chun et al. (Feng et al., 2018) analysed the possibilities of reducing carbon emissions in Southern China Traditional Chinese Medicine Industrial Park by strategies like product production efficiency improvement, biomass energy and solar energy utilization, waste heat recovery (WHR), and FCS. They finally identified three feasible solutions for achieving carbon reduction, zero-carbon, and negative-carbon goals in the park. Jialin et al. (Ji et al., 2020) conducted a research project on ECCR in Yongcheng Economic and Technological Development Area, which included three scenarios: the baseline scenario, energy cascade utilization, and energy efficiency improvement. Both energy cascade utilization and energy efficiency improvement scheme could result in significant ECCR outcomes. Drawing on the principles of circular economy, Elizabeth et al. (Abraham et al., 2021) proposed a scheme to manufacture value-added products using only seawater, solar energy, air, and waste CO2 in eco-industrial parks, which not only conserves fossil fuels but also achieves carbon neutrality.
The second type primarily concentrates on partial energy-saving and emission reduction strategies, integrating multiple potential plans and contrasting their impacts in terms of energy efficiency, economic feasibility, and environmental sustainability across various scenarios. For example, Yang et al. (Guo et al., 2018) proposed a comprehensive scheme that encompasses five strategies for directly and indirectly reducing greenhouse gas emissions. Their scheme led to a reduction of over 9% in the greenhouse gas emissions of the 213 national-level industrial parks under study. Xintong et al. (Wei et al., 2022) have devised 10 scenarios, each with varying proportions of solar and hydrogen energy sources for power and heat supply in industrial parks. By integrating economic, environmental, and efficiency analyses, they formulated an optimal carbon reduction scheme that balances the needs of economy and environment.
The existing literature reflects the potential for energy-saving and carbon reduction in industrial parks, as well as the diversity of their solutions. However, some likely limitations were identified. The first method involves conducting research on a specific park and proposing targeted improvement schemes. This method has the advantage of providing in-depth understanding of the characteristics and issues of that particular park, enabling the development of practical solutions. However, since each park is unique, this method may not be applicable to other industrial parks. The second method involves proposing a series of feasible improvement schemes first, and then analysing their effectiveness in any park before selecting the best option. This method has the advantage of being universally applicable to different industrial parks. However, due to the lack of in-depth knowledge about a specific park, the proposed schemes may not be precise or effective enough. Furthermore, both methods give less attention to strategies such as carbon capture and storage, CCU, and FCS, resulting in incomplete outcomes.
It is essential to carefully consider various ECCR strategies and develop a universal analysis method to support the comprehensive evaluation of all feasible ECCR schemes in industrial parks. Consequently, this study developed a mathematical model for four ECCR strategies: FCS, CCU, WHR, and photovoltaic (PV). With limited funding available, the optimization objective was to maximize economic benefits or carbon emission reduction effects, leading to a universal optimization model for ECCR scheme planning for industrial parks. This universal optimization model can support the acquisition of optimal solutions for industrial park managers and planners in addressing ECCR concerns. In comparison with other related research, the study here maintains the following novelty:
1) Provided a new method for ECCR planning of industrial parks. The new method we propose resolves the contradiction between two existing methods and can develop targeted improvement schemes for any park.
2) Developed mathematical models for four universal ECCR strategies, enabling a comparison of their economic feasibility and carbon reduction effects with other strategies.
3) Based on the current state of China’s Emission Trading Scheme, a universal optimization model for ECCR planning for industrial parks was established. The proposed model can automatically consider environmental factors specific to industrial parks and generate adaptive optimal ECCR schemes.
The remainder of this paper is organized as follows: Section 2, we provide a detailed description of the problem that our study aims to address. Furthermore, Section 3 presents the formulation of the proposed optimization model of ECCR planning. In Section 4, the results of the numerical analysis are presented. Finally, the conclusion is given in Section 5.
2 Problem description
The objective of designing ECCR schemes in industrial parks is to optimize the decision-making variables within a limited funding, considering factors such as technology and resource needs to attain a desired solution. Under the same funding constraint, the ECCR project’s effectiveness is mainly determined by four decision-making variables: construction regions, ECCR strategies, realization technologies for various ECCR strategies, and the capacity of each strategy.
Currently, there are several strategies for achieving ECCR in industrial parks, including device energy-saving modifications, application of integrated energy systems, utilization of waste heat, clean energy replacement, and the application of CCU and FCS. But most of them are only with potential in specified industrial types, or even technic types and are difficult to be generalized. Considering their current development status, replication potential, and challenges for promotion, this paper focuses on four of these strategies: FCS, CCU, WHR, and PV. The selected four strategies are with the most generalizing capability for most industrial parks. The FCS and PV are irrelevant to industrial categories and only relates to the scale of provided geographical areas (PV can also utilize roof-top area). CCU is to capture carbon from factories’ exhaust ports, which many industrial types are with potential for exhaust ports exist universally. WHR is also the most popular technologies for energy saving and carbon emission reduction for heating is popular in various industries.
The ECCR project can be implemented in regions such as empty lots or factories within industrial parks. In empty lots, FCS or PV can be implemented, but due to the non-overlapping nature of FCS and PV on land use, only one method may be implemented in a single region. In factories, CCU, WHR, and PV can be implemented together since the scarce resources consumed by each method differ. Therefore, it is possible for two or three strategies to be implemented simultaneously.
There are many technologies available for various strategies. For instance, in the candidate technology set established in this study based on research, there are three candidate tree species for FCS implementation, namely, Pinus massoniana Lamb., Pinus elliottii Engelmann, and Cunninghamia lanceolata (Lamb.) Hook.; CCU candidate technologies include post-combustion CO2 capture using chemical absorption; WHR candidate technologies include absorption chillers, Organic Rankine Cycle power generation units, absorption heat pumps, and heat exchangers; PV candidate technologies include fixed solar panels. Different implementation techniques have significant differences in economic feasibility and carbon emission reduction effects, which are crucial variables to be considered during optimization.
The planning process for ECCR project in industrial parks actually involves the selection and optimization of decision-making variables. As illustrated in Figure 1, during this process, construction regions are selected from empty lots and factories within the park, followed by the determination of ECCR strategies for each region based on their respective conditions. Subsequently, the implementation technologies for various strategies are determined and the capacities are set. Finally, through calculations and comparisons, the optimal planning scheme for ECCR is obtained.
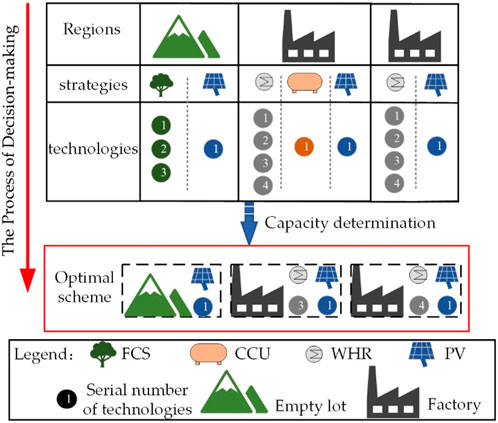
FIGURE 1. The schematic diagram of decision-making in ECCR scheme planning.
3 Modelling of ECCR planning
In this section, the ECCR planning optimization model will be introduced in detail, which is designed to serve as a general tool to help various kinds of parks formulate targeted improvement strategies. At the beginning of Section 3.1, the decision variables involved in the model will be defined and the global expression of the objective function will be given. In Section 3.2, the economic benefits and carbon reduction quantification calculation model of ECCR strategies will be constructed to realize the determination of the undefined parameters in the objective function. In Section 3.3, constraints will be introduced to delineate the feasible solution region of the optimization problem. The entire structure of the optimization model is shown in Figure 2.
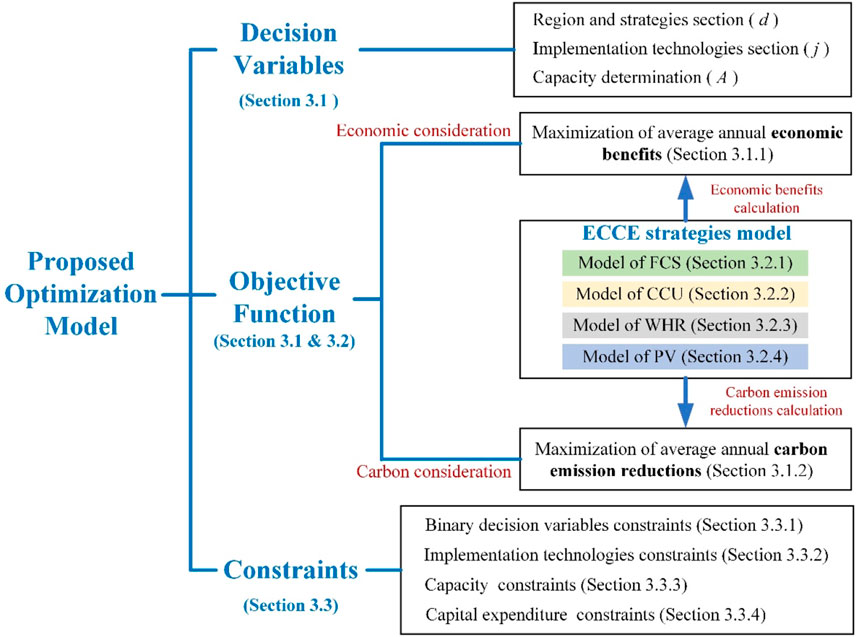
FIGURE 2. The entire structure of the optimization model.
3.1 Objective function
Different decision-makers have varying degrees of emphasis on the economic feasibility and carbon emission reduction effectiveness of the project. To address these two needs, this model has constructed two single objective functions, one for obtaining the optimal economic solution and another for obtaining the optimal carbon emission reduction solution. Section 3.1.1 and Section 3.1.2 will introduce these two objective functions in detail.
The proposed model includes three types of decision variables. The decision variable
3.1.1 Economic optimization
During the course of project’s development, each region is expected to bear a certain amount of capital expenditure. Additionally, upon the commencement of operations, a net profit will be accrued on an annual basis. Among the operational earnings of the four strategies discussed in this paper, in addition to the profits from Emission Trading Scheme trading as a result of carbon emission reduction, it also encompasses: timber revenue from FCS, CO2 product income from CCU, energy earnings from WHR, and electricity sale revenue from PV (Ge et al., 2023; Pieri et al., 2023). The CO2 product in this study is fundamentally distinct from Carbon Emission Rights, which are an abstract commodity within the Emission Trading Scheme. The former represents the tangible substance of CO2, while the latter signifies a theoretical commodity. CO2 product serves as a widely utilized product for creating value-added goods.
The optimal economic performance is achieved by maximizing the cumulative annual economic benefits of each region in the park. To determine the annual economic benefit of a region, one can calculate its value by subtracting its annualized capital expenditure from its annual net operating income. Therefore, the objective function can be expressed as Eq. 3.1, with a positive value indicating profitability and a negative value implying losses. When strategy v is not implemented in the u-region, we set
3.1.2 Carbon benefit optimization
After the project’s operation, four ECCR strategies will directly or indirectly reduce the carbon emissions of the park through methods such as carbon sequestration and decreasing consumption of non-renewable resources.
The optimization of carbon benefits for the project involves maximizing the cumulative annual reduction in carbon emissions for all regions after its operation. A positive value indicates that the project can reduce carbon emissions, while a negative value shows the opposite. The objective function can be expressed as:
3.2 ECCR strategies modelling
The objective Equations 3.1, 3.2 comprise three parameters: capital expenditure, net operating income, and carbon emission reduction. Therefore, this section will complete the modelling of various ECCR strategies to obtain these parameter values. Once the strategy, technology, and capacity variables for a region implementation have been determined, the parameter values will be uniquely determined. The following Sections 3.2.1–3.2.4 will introduce models for calculating annualized capital expenditure, annual net operating income, and annual carbon emissions reduction of FCS, CCU, WHR, and PV strategies in one region, respectively.
3.2.1 Modelling of FCS
The pilot Emission Trading Scheme in China encourages private enterprises to develop their own qualifying China Emission Reduction Projects, the certified emissions reductions of the projects can trade in Emission Trading Scheme. Afforestation project is one of the project types recognized by the National Development and Reform Commission. Certified emissions reductions must be measured using a strict methodology, and “Methodologies for A/R Project Activities in China (AR-CM-001-V01)” is a standardized methodology for measuring certified emissions reductions of afforestation projects, which has been registered by the National Development and Reform Commission. The methodology also established strict requirements for land eligibility.
Since the Methodology does not impose any constraint on the continuous area of afforestation, the minimum afforestation area of FCS can be considered as 0. It means that capacity
To calculate Equations 3.4, 3.5, further information about the project’s certified emissions reductions and timber volume harvested at the end of the accounting period is necessary. Based on the methodology, the project’s emission reduction can be calculated by subtracting the increase in greenhouse gas emissions caused by project implementation and baseline carbon sequestration from the change in carbon sequestration of the selected carbon pools within the project boundary. Specifically, Eq. 3.6 can be used to perform this calculation.
The calculation of the change in carbon sequestration necessitates the determination of the carbon pool. In this study, we consider both above-ground biomass and under-ground biomass as the carbon pools, while ignoring dead wood, litter, soil organic carbon, and wood product pools. Furthermore, the project’s change in carbon sequestration only considers the change in biomass carbon sequestration of forest trees. Consequently, at the inception of the project after t years, the change in carbon sequestration within the selected carbon bank within the project boundary can be expressed by Eq. 3.7, (Cao and Zhang, 2019).
Based on the methodology, it is generally impossible to anticipate forest fires within the project boundary during pre-project estimation. Therefore, greenhouse gas emissions resulting from forest fires can be disregarded. Moreover, this study assumes that the project does not involve extensive deforestation and slash burning, so
In Eq. 3.8, the value of
Furthermore,
The biomass
In the pre-project estimation stage, empirical formula is an important tool for evaluating the timber volume in Eq. 3.11. Under similar conditions with areas adjacent to the project site, there is a relatively stable correlation between factors such as volume, tree height and diameter at breast height of the same tree species and growth years. The data on timber volume under different stages of growth cycle can be represented as
According to published research findings, the typical values for variables a, b, and c in certain humid continental monsoon climate regions of southern China, as stated in Eq. 3.12, are as follows (Jia et al., 2010; Cao et al., 2020): for P. massoniana Lamb. are [0.56, −0.05, 4.03], for P. elliottii Engelmann they are [0.2023, −0.11, 3.991] and for C. lanceolata (Lamb.) Hook. The values are [0.1962, −0.08, 3.9012]. Based on the volume growth equation, the timber volume in Eq. 3.5 and Eq. 3.11 can be estimated.
3.2.2 Modelling of CCU
CO2 capture is mainly utilized in coal-fired power plants, cement plants, steel plants, and petrochemical plants. For enterprises such as cement plants and steel plants common in industrial parks, post-combustion CO2 capture is mainly applicable. This method does not necessitate any modifications to furnaces or other equipment, making it suitable for commercialization. The capture process mainly relies on chemical absorption, which has a high maturity level and is currently the most widely scaled application of the CO2 capture process. Consequently, the model only contemplates post-combustion CO2 capture using chemical absorption as a potential technology for CCU, which implies that
The energy consumption required by the CCU during carbon capture includes electricity, steam, and water. The amount of energy consumed can be described by a linear relationship with the quantity of CO2 captured. Once the energy consumption has been determined, it is combined with the carbon emission factor for energy to calculate the energy-related carbon emissions in Eq. 3.16 using Eq. 3.18, (Huang et al., 2021).
3.2.3 Modelling of WHR
WHR can be achieved through various methods, including heat pumps, heat exchangers, heat pipes, boilers, refrigeration cycles, power cycles, and thermal storage. The model considers four types of WHR equipment that are commonly employed: absorption chillers, Organic Rankine Cycle power generation unit, absorption heat pumps, and heat exchangers. This implies that the technology set is
Eq. 3.20 presents an equivalent estimation of the carbon reduction achieved through the implementation of the WHR strategy. The energy generated by WHR equipment is used to fulfil the electricity, heating, and cooling requirements within the park. This lowers the output of energy transformation equipment, like electric chillers and gas boilers, thereby conserving precious resources like grid power and natural gas. For example, if we assume that the efficiency of grid power supply is 1.0, the efficiency of electric chillers is 3.5, and the efficiency of gas boilers is 0.85. Then, for every
The calculation of the output power for WHR equipment included in Equations 3.20, 3.21 requires the use of the equipment’s technology model. The four types of WHR equipment involved in this study have mathematical relationships between their inputs and outputs, which can be described by Eq. 3.22, (Wang et al., 2018). The models for these devices are unified in form, while the main difference lies in their energy conversion efficiency.
3.2.4 Modelling of PV
Currently, the PV equipment in industrial parks are fixed solar panels. Therefore, the candidate technology for PV is limited to fixed solar panels, which is represented by
In Eq. 3.23, the area of a PV panel is proportional to its peak power. A typical value of A2P is 6.2, which means that a PV panel with a peak power of 1 kW covers an area of 6.2 m2. In Equations 3.24, 3.25,
3.3 Constraints
The proposed model is not only bound by the boundary constraints of the three types of decision variables, but also constrained by the limited capital expenditure of the project. Equations 3.27.–.3.30 introduce the constraints for binary variables, implementation technologies, capacity, and capital expenditure in a sequential manner.
3.3.1 Constraints for binary variables
FCS and PV projects can be implemented in industrial parks’ empty lots, but there are non-overlapping restrictions on land use for PV and FCS. This restriction can be reflected by decision-making variable constraint. When the u-region is an empty lot and simultaneously satisfies the requirements for implementing both FCS and PV, then the constraint can be expressed as:
3.3.2 Constraints for implementing technologies
The implementing technologies constraint ensures that the technologies selected for various strategies must be from the candidate set. Each technique is coded with a unique decimal number, for example, P. massoniana Lamb. is coded with 1, P. elliottii Engelmann is coded with 2, and C. lanceolata (Lamb.) Hook. is coded with 3. The constraint can be expressed as:
3.3.3 Constraints for capacity
The capacity constraint embodies the challenges faced by various ECCR strategies during implementation, such as available space, limited waste heat and CO2 resources from factories, and national regulations. Its value is restricted by boundary conditions. This constraint can be expressed by Eq. 3.29. The minimum capacity requirements for each strategy are outlined in Section 3.2, while the maximum capacities vary depending on the actual conditions of the projects.:
3.3.4 Constraints for capital expenditure
During the project construction stage, the investment budget is limited, which implies a cap on capital expenditure. Capital expenditure encompasses the costs of equipment investments for CCU, WHR, and PV. Considering that the earning of FCS typically become available only after the completion of the project, in addition to including the initial forestation, tending, and project’s development costs for FCS strategies in capital expenditure, the constraint also includes annual management costs incurred during the project period annually. This constraint can be expressed as:
4 Numerical study and analysis
4.1 Background
In numerical study, we took an industrial park in southern China with seven regions that meet the requirements for implementing the ECCR strategies as a simulation case. The land types, available ECCR strategies, serial numbers for land and ECCR strategies, and capacity caps for various strategies are presented in Table 1. Other parameters used in the simulation were referenced from recent papers, reflecting typical conditions in China, and their values are listed in detail in Table A1–A5 of the Supplementary Appendix SA1.
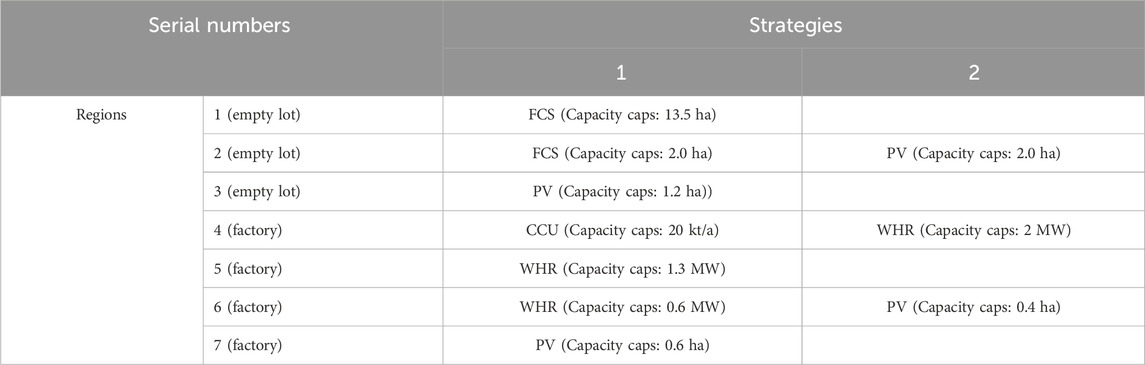
TABLE 1. Basic information on each region of the industrial park.
The proposed model is optimized using a genetic algorithm. A feasibility experiment is designed in this study to verify the effectiveness of the proposed model. Sensitivity experiments are also conducted to analyse the relationship between optimal solutions and different parameters. The feasibility experiment will be introduced in Section 4.2, which provides and analyses the optimal solutions when capital expenditure is limited to 20 million CNY. Section 4.3 introduces sensitivity experiments, focusing on objective function Obj_3.1, to study the impact of three key parameters: capital expenditure caps, Emission Trading Scheme carbon trading price, and transportation distance of captured CO2 products, on optimal solution. It helps further analysis the application prospects of various ECCR strategies.
For the convenience of presentation, the unique decimal number of each type of technology is used to indicate the selected technology in the solution. The unique decimal numbers assigned to each technology in the study are as follows: for FCS, P. massoniana Lamb. is coded with 1, P. elliottii Engelmann is coded with 2, and C. lanceolata (Lamb.) Hook. is coded with 3. For CCU, the post-combustion CO2 capture using chemical absorption is coded with 1; For WHR, absorption chillers, Organic Rankine Cycle generation units, absorption heat pumps, and heat exchangers are coded with 1, 2, 3, and 4 respectively. For PV, the fixed solar panels are coded with 1. For example, “{1}, 2000” in Table 1 represents that the WHR strategy in 4-Region has selected an implementation technology of absorption chillers with a capacity of 2000 kW.
4.2 Feasibility analysis
Table 2 presents the optimal solution of the proposed model for both objective function Obj_3.1 and Obj_3.2, considering a capital expenditure cap of 20 million CNY. The results indicate that the WHR strategy has significant advantages over other strategies in terms of economic and carbon emission benefits. In terms of economic benefits, CCU is only second to WHR, followed by PV. For carbon emission reduction effects, CCU is only second to WHR, followed by FCS. Therefore, when funds are limited, the algorithm will give priority to budget investments in WHR to maximize its capacity. The remaining budget will be invested in CCU.
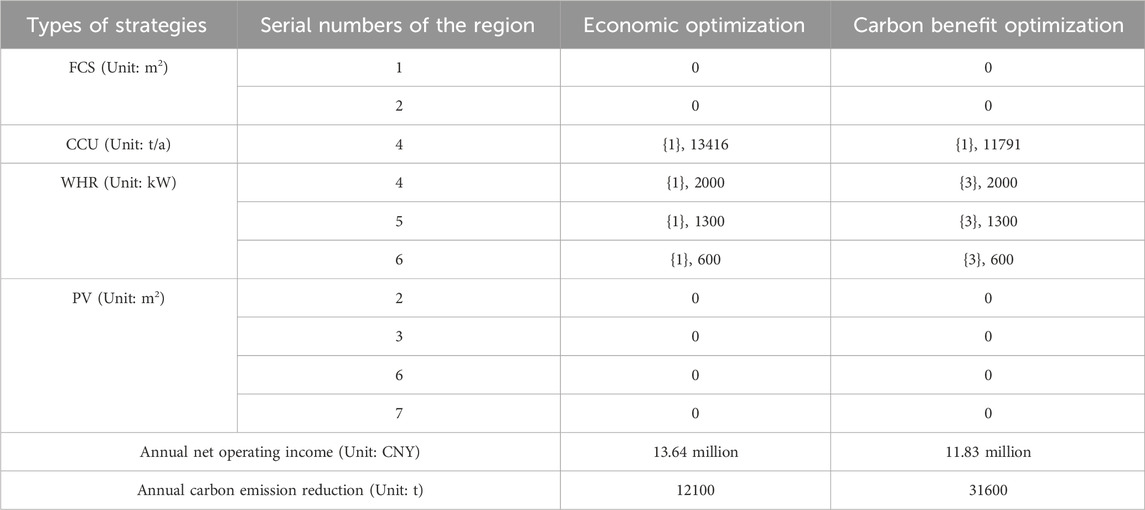
TABLE 2. The optimal solution of the proposed model.
Due to the significant differences in economic and carbon emission benefits resulting from implementing WHR using different technologies, the implementation technology for WHR has changed under different optimization objectives. When the optimization objective is economic benefit, the implementation technology for WHR is all absorption refrigeration machines. However, when the optimization objective is carbon emission benefit, it becomes absorption heat pumps. This is because while the economic benefit of absorption heat pumps may not be as good as that of absorption refrigeration machines, their carbon emission benefits have a clear advantage. As a result, the annual carbon emission reduction amount reaches 31,600 tons when the optimization objective is carbon emission benefit, which is 2.6 times higher than that when the optimization objective is economic benefit. Clearly, this carbon emission reduction effect comes at the cost of loss of economic benefit, with the economic benefit decreasing by about 13%, but the results still demonstrate a favourable economic feasibility.
Furthermore, the experiments effectively demonstrate that the proposed model can automatically generate optimal schemes for project construction under different parameters and optimization objectives. The results can support industrial parks in achieving both economic and environmental benefits while promoting ECCR work.
4.3 Sensitivity analysis
Given the constraints of limited funding budgets in Eq. 3.30, changes in capital expenditure will significantly impact the results. Additionally, factors such as Emission Trading Scheme carbon trading prices and distances for captured CO2 product transportation will affect the economic benefits of various strategies. A sensitivity analysis will be conducted on different capital expenditure caps, Emission Trading Scheme carbon trading prices, and captured CO2 product transportation distances to explore their impacts on optimization solutions and project’s economic benefits. The optimization objective is to maximize economic benefits. In Section 4.3.1, the capital expenditure cap is increased from 5 million CNY to 35 million CNY. In Sections 4.3.2, 4.3.3, the capital expenditure cap is set at 20 million CNY, with the Emission Trading Scheme carbon trading price raised from 59 CNY/t to 450 CNY/t, and the transportation distance for captured CO2 products increased from 80 to 200 km.
4.3.1 Capital expenditure caps change
Table 3 presents the optimal solutions with varying capital expenditure caps. When the capital expenditure cap is set to 5 million CNY, the budgets are prioritized towards investing in WHR, and the remaining funds are invested in CCU. However, due to the minimum capacity constraint of CCU being 1,000 t/a, the remaining funds are insufficient to meet this capacity requirement and thus, the remaining funds are invested in PV as a last resort. When the capital expenditure cap is set to 20 and 35 million CNY, the order of investments follows the same pattern as that of the economic benefits of the strategies. This means that the funds are first invested in WHR, followed by CCU, and only after both reach their maximum capacity will the funds be invested in PV.
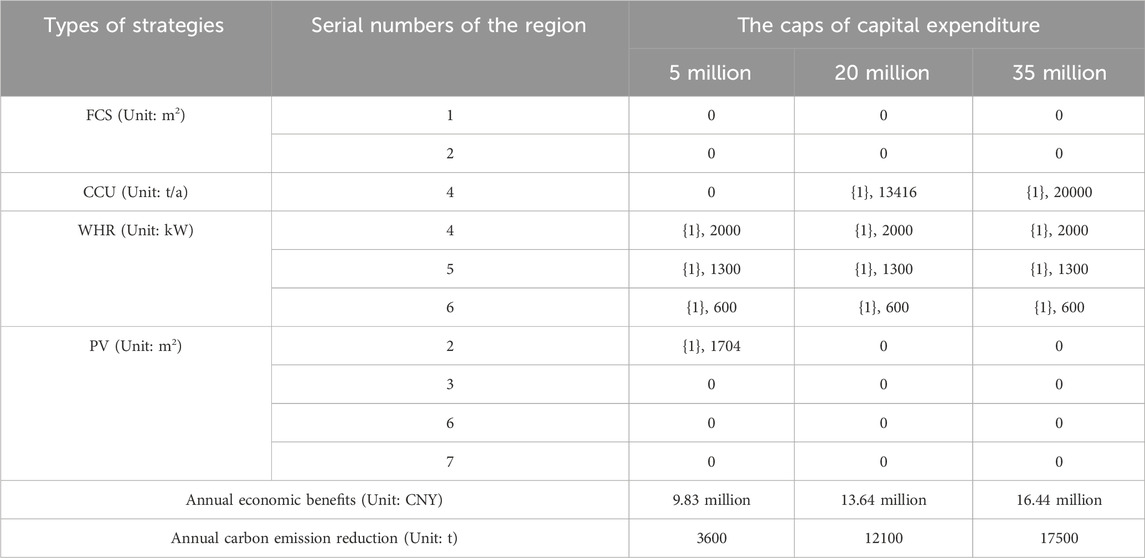
TABLE 3. The optimal solutions with varying capital expenditure caps.
When the optimization objective is to maximize economic benefits, the model will direct funds towards strategies with greater economic returns. As capital expenditure increases, funds can only be invested in lower-economic-benefit strategies, resulting in a decline in annual economic benefits for the project. The results show that WHR, CCU, and PV projects are all able to recoup their capital expenditure before their equipment reaches its service life.
4.3.2 Emission trading scheme carbon trading prices change
Currently, China’s Emission Trading Scheme is still in its infancy, with the overall price of carbon remaining low. However, as more industries and sectors are included in carbon emission management, it is expected that the price will gradually rise. As shown in Table 4, while the price rises, the model still prioritizes investing in WHR, with the only difference being the implementation technologies shift from absorption chillers to absorption heat pumps. This demonstrates that WHR has significantly better economic benefits and carbon reduction effects compared to other strategies. When the price reaches 450 CNY/t, the capacity of FCS and PV remains zero. This shows that even considering the project’s timber revenue, due to the high cost of writing project design documents and approval fees, small-scale FCS projects in industrial parks have not yet displayed any economic advantages at this stage. Additionally, as PV’s annual carbon reduction effect is the worst among the four types of strategies, rising carbon trading prices will cause it to gradually lose investment attraction. With limited capital expenditure, the priority for PV investment will gradually decrease as the carbon trading prices rise.
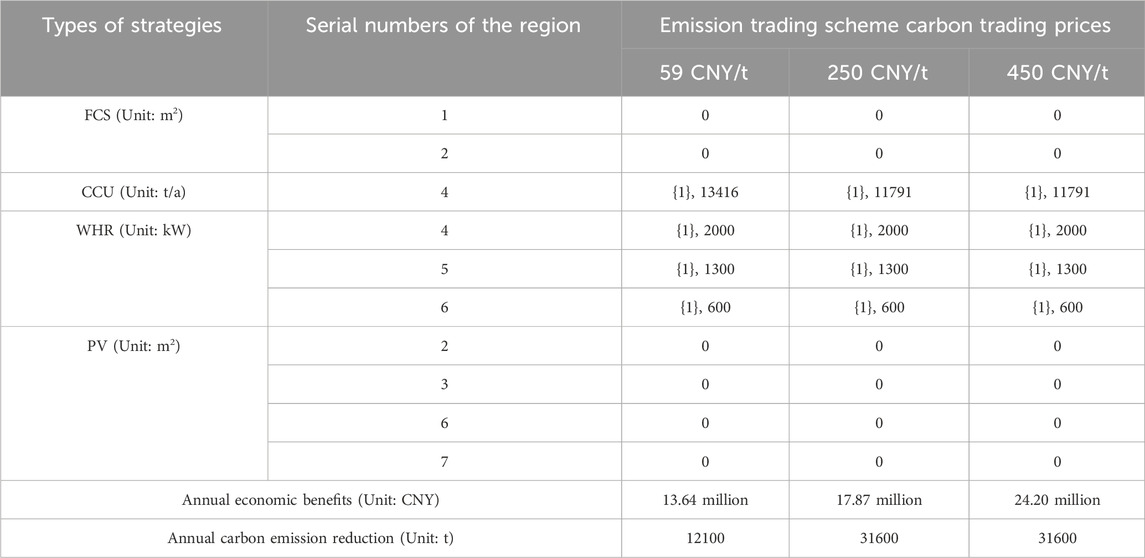
TABLE 4. The optimal solutions with varying emission trading scheme carbon trading prices.
With the rising price of carbon trading, the operational income from energy and product sales remains unchanged, but more economic incentives can be obtained through Emission Trading Scheme trading. As a result, the investment attractiveness of strategies and implementation technologies with outstanding carbon reduction capabilities will increase. When the carbon trading price exceeds 250 CNY/t, the optimal solution is the same as that under the optimization objective of maximizing the carbon emission effect in Table 2. At this point, selecting any objective function for optimization will result in the same solution and the optimal solution will achieve both economic and carbon emission benefits.
4.3.3 Transportation distance of captured CO2 products change
The solutions in Table 5 demonstrate that despite a transportation distance of 140 km, CCU remains more appealing for investment when compared to PV at the current carbon trading price and the sale price of captured CO2 products. However, once the transportation distance exceeds 200 km, PV becomes the superior option. Therefore, it is crucial to conduct comprehensive research and analysis on product transportation distance during pre-project estimation.
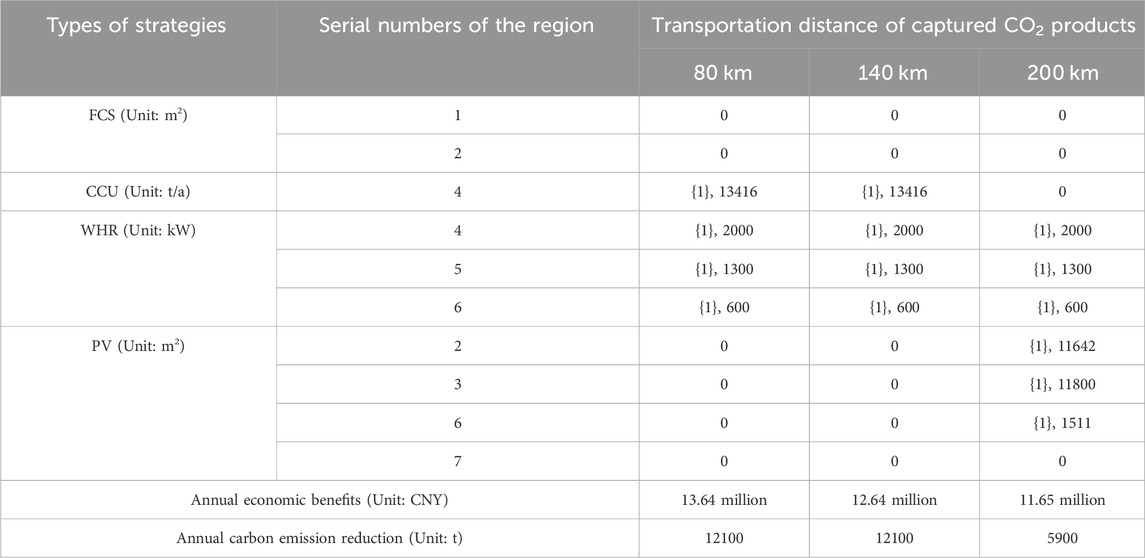
TABLE 5. The optimal solutions with varying transportation distance of captured CO2 products.
It is predicted that, given China’s large population size and economic development rate, the consumption of CO2 products is expected to increase significantly in the future. Furthermore, as the carbon trading price or the sale price of CO2 products rise, CCU will continue to demonstrate economic benefits even for longer transportation distances. The implementation of CCU strategy for achieving ECCR in industrial parks holds significant potential for widespread application.
5 Conclusion
This study has established a universal optimization model for energy conservation and carbon reduction (ECCR) scheme planning for industrial parks based on forestry carbon sequestration (FCS), carbon capture and utilization (CCU), waste heat recovery (WHR), and photovoltaic (PV), which are four ECCR strategies that are easy to replicate and promote. The feasibility of the model was validated, and three key parameters including capital expenditure caps, Emission Trading Scheme carbon trading price, and transportation distance of captured CO2 products were analysed for sensitivity in the numerical study section. The results demonstrate that:
1) The proposed model is capable of automatically considering the unique environmental factors specific to industrial parks. Under two different optimization objectives, the model can simultaneously complete the selection of construction regions, strategies, technical routes, and determining capacities while producing the optimal ECCR planning scheme.
2) In the case of stable demand for CO2 products, implementing a CCU strategy using post-combustion chemical absorption technology offers economic benefits that are second only to those of WHR. However, at present, China’s CO2 product market is experiencing oversupply. If the project fails to match with a stable demander, there is a risk of insufficient equipment operation rate, which could ultimately impact the actual income of the project.
3) The sensitivity analysis reveals that even when accounting for the timber revenue from FCS projects, the FCS strategy still fails to demonstrate economic advantages compared to other strategies at a carbon trading price of 450 CNY/t. Furthermore, with the same investment, the amount of carbon reduction achieved by FCS strategy is quite limited and only better than that of PV strategy. From both an economic and environmental perspective, it is not advisable to implement small-scale FCS strategies in industrial parks. On the other hand, WHR strategy is optimal in both economic and environmental aspects.
The optimization model proposed in this study for industrial parks can serve as a valuable tool to facilitate the implementation of ECCR initiatives within the park, and offer guidance towards the exploration of ECCR implementation schemes that yield both economic and environmental benefits. This model is well-suited to meet the needs of China’s carbon peak goal before 2030.
Data availability statement
The original contributions presented in the study are included in the article/Supplementary Material, further inquiries can be directed to the corresponding author.
Author contributions
PZ: Investigation, Methodology, Project administration, Writing–review and editing. WZ: Supervision, Writing–review and editing. JC: Methodology, Software, Writing–review and editing. XZ: Funding acquisition, Resources, Writing–review and editing. ZZ: Data curation, Writing–review and editing. CL: Methodology, Writing–original draft. S-EP: Visualization, Writing–original draft.
Funding
The author(s) declare financial support was received for the research, authorship, and/or publication of this article. This work is in part by science and technology project of State Grid Zhejiang Electric Power Co., Ltd. entitled “Research on Energy Efficiency Enhancement Technologies in End-Use Energy” (5211LS220004).
Conflict of interest
Authors PZ, WZ, JC, XZ, and ZZ were employed by Lishui Power Supply Company of State Grid Zhejiang Electric Power Co. Ltd.
The remaining authors declare that the research was conducted in the absence of any commercial or financial relationships that could be construed as a potential conflict of interest.
The author(s) declared that they were an editorial board member of Frontiers, at the time of submission. This had no impact on the peer review process and the final decision.
Publisher’s note
All claims expressed in this article are solely those of the authors and do not necessarily represent those of their affiliated organizations, or those of the publisher, the editors and the reviewers. Any product that may be evaluated in this article, or claim that may be made by its manufacturer, is not guaranteed or endorsed by the publisher.
Supplementary material
The Supplementary Material for this article can be found online at: https://www.frontiersin.org/articles/10.3389/fenrg.2024.1272679/full#supplementary-material
References
Abraham, E. J., Ramadan, F., and Al-Mohannadi, D. M. (2021). Synthesis of sustainable carbon negative eco-industrial parks. Front. Energy Res. 9, 689474. doi:10.3389/fenrg.2021.689474
Bastin, J. F., Finegold, Y., García, C., Mollicome, D., Rezende, M., Routh, D., et al. (2019). The global tree restoration potential. Science 365, 76–79. doi:10.1126/science.aax0848
Cao, X., and Zhang, Y. (2019). Dynamic accounting on the development costs of China certified emission reduction issued by larix gmelinii (rupr.) kuzen. Afforestation Refor. Proj. J. Statistics Inf. 34, 43–49. (In Chinese). doi:10.3969/j.issn.1007-3116.2019.03.006
Cao, X.-l., Li, X.-s., and Breeze, T. D. (2020). Quantifying the carbon sequestration costs for Pinus elliottii afforestation project of China greenhouse gases voluntary emission reduction program: a case study in jiangxi province. Forests 11, 928. doi:10.3390/f11090928
Chen, S., Liu, J., Zhang, Qi, Teng, F., and BenjaminMcLellan, C. (2022). A critical review on deployment planning and risk analysis of carbon capture, utilization, and storage (CCUS) toward carbon neutrality. Renew. Sustain. Energy Rev. 167, 112537. doi:10.1016/j.rser.2022.112537
Côté, R. P., and Liu, C. (2016). Strategies for reducing greenhouse gas emissions at an industrial park level: a case study of Debert Air Industrial Park, Nova Scotia. J. Clean. Prod. 114, 352–361. doi:10.1016/j.jclepro.2015.09.061
Davis, S. J., Lewis, N. S., Shaner, M., Aggarwal, S., Arent, D., Azevedo, I. L., et al. (2018). Net-zero emissions energy systems. Science 360, 9793–1429. doi:10.1126/science.aas9793
Feng, J.-C., Yan, J., Yu, Z., Zeng, X., and Xu, W. (2018). Case study of an industrial park toward zero carbon emission. Appl. Energy 209, 65–78. doi:10.1016/j.apenergy.2017.10.069
Ge, J., Zhang, Z., and Lin, B. (2023). Towards carbon neutrality: how much do forest carbon sinks cost in China? Environ. Impact Assess. Rev. 98, 106949. doi:10.1016/j.eiar.2022.106949
GOV (2021). The State Council on the issuance of carbon peak by 2030, Available online: https://www.gov.cn/zhengce/content/2021-10/26/content_5644984.htm (accessed on July 19, 2023).
Guo, W., Wang, Q., Liu, H., and Wade, A. (2023). Multi-energy collaborative optimization of park integrated energy system considering carbon emission and demand response. Energy Rep. 9, 3683–3694. doi:10.1016/j.egyr.2023.02.051
Guo, Y., Tian, J., and Chen, L. (2020). Managing energy infrastructure to decarbonize industrial parks in China. Nat. Commun. 11, 981. doi:10.1038/s41467-020-14805-z
Guo, Y., Tian, J., Zang, N., Gao, Y., and Chen, L. (2018). The role of industrial parks in mitigating greenhouse gas emissions from China. Environ. Sci. Technol. 52, 7754–7762. doi:10.1021/acs.est.8b00537
Huang, J., Chen, Q., Zhong, P., and Zhang, X. (2021). China carbon capture utilization and storage technology evaluation report. Beijing, China: Science Press, 76–77.
Ji, J., Wang, S., Ma, Y., Lu, C., Liang, T., and Zhang, R. (2020). Pollutant emission reduction of energy efficiency enhancement and energy cascade utilization in an energy-intensive industrial park in China. Environ. Sci. Pollut. Res. 27, 35017–35030. doi:10.1007/s11356-020-09158-5
Jia, Li, Quan-qin, S., Huang, L., and Zhao, P.-xiang (2010). Review on the growth equations of Pinus massoniana, Cunninghamia lanceolata and Pinus elliottii in China. J. Northwest For. Univ. 25, 151–156. (In Chinese).
Jia, Z., Wen, S., and Sun, Z. (2022). Current relationship between coal consumption and the economic development and China's future carbon mitigation policies. Energy Policy 162, 112812. doi:10.1016/j.enpol.2022.112812
Jing, Y., Zhu, Li, Yin, B., and Li, F. (2023). Evaluating the PV system expansion potential of existing integrated energy parks: a case study in North China. Appl. Energy 330, 120310. doi:10.1016/j.apenergy.2022.120310
Kim, H.-W., Dong, L., Choi, A. E.Sy, Fujii, M., Fujita, T., and Park, H.-S. (2018). Co-benefit potential of industrial and urban symbiosis using waste heat from industrial park in Ulsan, Korea. Resour. Conservation Recycl. 135, 225–234. doi:10.1016/j.resconrec.2017.09.027
Li, L., Dong, J., and Song, Y. (2020). Impact and acting path of carbon emission trading on carbon emission intensity of construction land evidence from pilot areas in China. Sustainability 12, 7843. doi:10.3390/su12197843
Li, X. (2020). Design of energy-conservation and emission-reduction plans of China's industry: evidence from three typical industries. Energy 209, 118358. doi:10.1016/j.energy.2020.118358
Lin, Y., Chong, C. H., Ma, L., Zheng, Li, and Ni, W. (2022). Quantification of waste heat potential in China: a top-down societal waste heat accounting model. Energy 261, 125194. doi:10.1016/j.energy.2022.125194
Ma, K., Geng, M., Han, L., Sun, Q., Zhang, L., Yang, Z., et al. (2023). Carbon accounting of weihe CSA pilot demonstration area in longjiang forest industry. Processes 11, 1251. doi:10.3390/pr11041251
Pieri, T., Nikitas, A., and Angelis-Dimakis, A. (2023). Public acceptance and willingness to pay for carbon capture and utilisation products. Clean. Technol. 5, 436–450. doi:10.3390/cleantechnol5010022
Qian, L., Xu, X., Sun, Y., and Zhou, Y. (2022). Carbon emission reduction effects of eco-industrial park policy in China. Energy 261, 125315. doi:10.1016/j.energy.2022.125315
Ren, B., Wang, G., Zuo, H., Xue, Q., She, X., and Wang, J. (2022). In-situ catalytic reforming of converter gas in converter flue based on thermochemical energy storage: kinetics and numerical simulation. J. Energy Storage 48, 103693. doi:10.1016/j.est.2021.103693
Rissman, J., Chris, B., Masanet, E., Aden, N., Morrow, W. R., Zhou, N., et al. (2020). Technologies and policies to decarbonize global industry: review and assessment of mitigation drivers through 2070. Appl. Energy 266, 114848. doi:10.1016/j.apenergy.2020.114848
Shi, X., Wang, T., Lu, S., Chen, K., He, D., and Xu, Z. (2022). Evaluation of China’s forest carbon sink service value. Environ. Sci. Pollut. Res. 29, 44668–44677. doi:10.1007/s11356-022-18958-w
Wang, H., Li, Q., and Rao, H. (2022). Accounting for the whole life-cycle value of forestry ecological products under the background of carbon neutralization—a case of Pinus elliottii. For. Econ. 44, 79–96. (In Chinese). doi:10.13843/j.cnki.lyjj.20220831.001
Wang, H., Yue, L., Wang, H., Liu, M., Yang, J., and Bi, J. (2013). Carbon reduction potentials of China's industrial parks: a case study of Suzhou Industry Park. Energy 55, 668–675. doi:10.1016/j.energy.2013.01.034
Wang, X., Jin, M., Feng, W., Shu, G., Tian, H., and Liang, Y. (2018). Cascade energy optimization for waste heat recovery in distributed energy systems. Appl. Energy 230, 679–695. doi:10.1016/j.apenergy.2018.08.124
Wei, X., Qiu, R., Liang, Y., Qi, L., Klemeš, J. J., Xue, J., et al. (2022). Roadmap to carbon emissions neutral industrial parks: energy, economic and environmental analysis. Energy 238, 121732. doi:10.1016/j.energy.2021.121732
Yang, Y., Xu, W., Wang, Y., Shen, J., Wang, Y., Geng, Z., et al. (2022). Progress of CCUS technology in the iron and steel industry and the suggestion of the integrated application schemes for China. Chem. Eng. J. 450, 138438. doi:10.1016/j.cej.2022.138438
Yu, X., Li, M., and Kang, W. (2022). Heterogeneity of decoupling between economic development and carbon emissions in China's green industrial parks. Earth's Future 10. 2022EF002753. doi:10.1029/2022EF002753
Zhou, N., Price, L., Dai, Y., Creyts, J., Khanna, N., Fridley, D., et al. (2019). A roadmap for China to peak carbon dioxide emissions and achieve a 20% share of non-fossil fuels in primary energy by 2030. Appl. Energy 239, 793–819. doi:10.1016/j.apenergy.2019.01.154
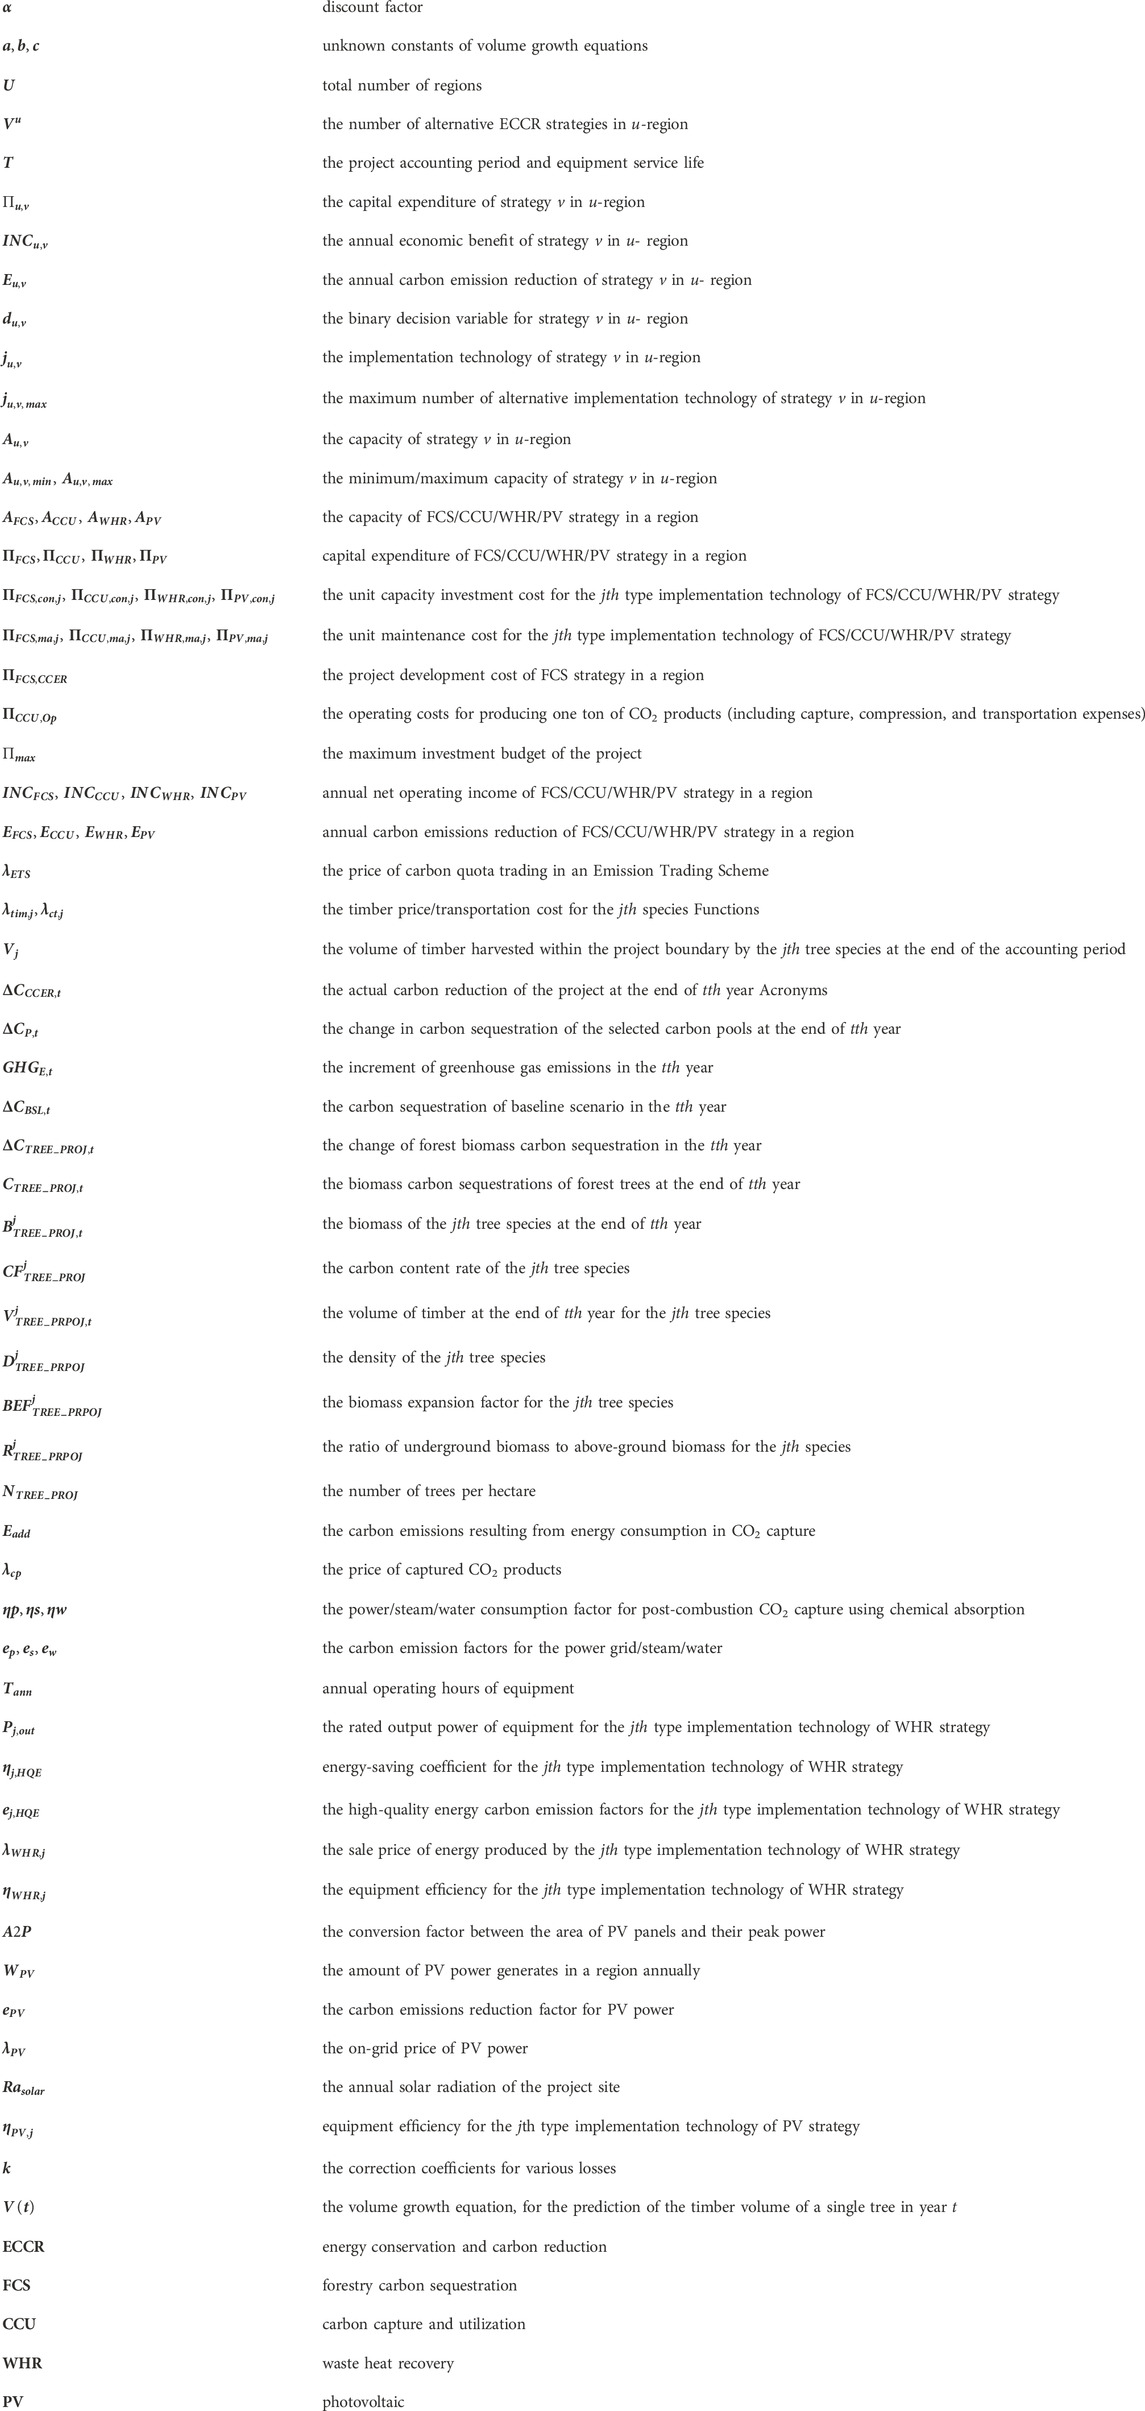
Nomenclature
Keywords: energy conservation, carbon reduction, planning optimization model, industrial park, emission trading
Citation: Zhao P, Zhang W, Chen J, Zhang X, Zhan Z, Lai CS and Peng S-E (2024) A novel optimization method of carbon reduction strategies implementation for industrial parks. Front. Energy Res. 12:1272679. doi: 10.3389/fenrg.2024.1272679
Received: 04 August 2023; Accepted: 22 January 2024;
Published: 09 February 2024.
Edited by:
Yonghui Sun, Hohai University, ChinaReviewed by:
Jiyu Wang, National Renewable Energy Laboratory (DOE), United StatesShouxian Zhu, Chinese Academy of Social Sciences (CASS), China
Yue Zhou, Cardiff University, United Kingdom
Guozhong Liu, Dongguan University of Technology, China
Copyright © 2024 Zhao, Zhang, Chen, Zhang, Zhan, Lai and Peng. This is an open-access article distributed under the terms of the Creative Commons Attribution License (CC BY). The use, distribution or reproduction in other forums is permitted, provided the original author(s) and the copyright owner(s) are credited and that the original publication in this journal is cited, in accordance with accepted academic practice. No use, distribution or reproduction is permitted which does not comply with these terms.
*Correspondence: Chun Sing Lai, Y2h1bnNpbmcubGFpQGJydW5lbC5hYy51aw==