 Renu Sharma
 Sonali Goel
 Saumya Ranjan Lenka
- Department of Electrical Engineering, Institute of Technical Education and Research, Siksha ‘O’ Anusandhan Deemed to be University, Bhubaneswar, Odisha, India
PV systems connected to the grid are primarily designed to generate clean energy to fulfil the rising energy demand. To predict the performance and efficacy of PV systems, several installation aspects are employed, such as location, local meteorological data, orientation, optimal tilt angle, varying losses, and energy yield estimation. Siksha ‘O’ Anusandhan Deemed to be University, Bhubaneswar (Latitude 20.24°N and Longitude 80.85°E) has taken one such initiative by installing a 13 kWp rooftop grid-connected solar photovoltaic system in one of its institutional buildings. The solar PV system is fixed at an angle of 21° and is installed on the rooftop of a 25-m height building. The measured performance characteristics were analysed and compared to those of PVSyst software to determine its feasibility in campus buildings. From the result, the annual electricity supplied to the grid is 17.79 MWh, final yield of 3.80 h/d, reference yield of 4.62 h/d and performance ratio of 0.82. The solar PV system installed at the institution is predicted to have reduced 17443.02 kg of CO2, 22.07 kg of SO2, and 46.1 kg of NOx from the atmosphere per year. The lebelised cost of energy (LCOE) of the installed PV system is 9.408 INR/kWh with a payback of 9.8 years. This study provides the techno-economic feasibility of installing grid-connected solar PV systems on the roof of an institutional building and help the solar installers in establishing the most efficient solar photovoltaic system’s sizing and design.
1 Introduction
The world’s energy demand has increased in all fields as a result of various developmental activities. Because fossil fuel-based technology is rapidly decreasing, it is time to harness renewable energy sources such as solar, wind, biomass, and small hydropower to overcome the energy crisis. Many countries have installed solar PV projects to produce electricity; as a result, the total installed capacity across the globe has reached 627 GW (IEA, 1974). Many Universities worldwide are making major investments to strengthen their long-term and medium-term sustainability. Odisha by its position in the globe has very good potential for almost all the renewable energy resources (Sharma and Goel, 2017) (Goel and Sharma, 2021). An assessment indicated that Odisha has a feasible renewable energy potential of 27,728 MW. The state of Odisha is located at 17.49′N −22.34′N latitude and 81.27′E–87.29′E longitude and receives a good amount of solar radiation of approximately 5.5 kWh/m2 for over 300 days a year (Government Of Odisha, 2023). Many rooftop solar power plants of various capacities have been installed in various government buildings, residential schools, hostels, and public health centres to meet the power deficit of the state. Additionally, many institutions have installed grid-interactive rooftop solar power plants. If the institution plans a large power plant to meet the load demand of the entire campus, a pre-feasibility study must be conducted in terms of its viability. However, academic solar projects can solve the energy demand of the campus, thereby generating revenue by selling excess electricity to the grid. The novelty of this paper is that no such study has been conducted in an institutional building in Eastern India, which is the first of its kind in the known literature. In Odisha, there has been no investigation on the installation of solar PV in an academic institution. This requires a large construction area and a large investment. In addition to this, the accumulation of dust over a solar panel situated over a 25 m high building was studied, which is new of its kind in any of the institutional buildings in eastern India. Despite the feasible potential of solar energy in Odisha, the implementation of the rooftop photovoltaic system in institutional buildings faces various challenges. A large-scale project necessitates a significant financial commitment as well as a longer timeframe to execute. During this period, changes in the inflation rate will have an influence on the investment. Similarly, the government’s renewable energy subsidy looks to be modest in comparison to the project’s investment. However, the institute’s insufficient budget makes it difficult to implement such a large scale project without the Govt. subsidy and a low-interest loan.
Better solar irradiance, climatic conditions, geotechnical considerations, topography, bearing strength of soil, environmental factors (soiling loss and shading loss), availability of grid supply, and land accessibility are important factors to consider when choosing a location (IFC, 2015). When evaluating solar potential, special emphasis should be placed on minimizing the shadowing impact, as this reduces the efficiency of the system (Sathyanarayana et al., 2015).
Some of the relevant studies along with the salient findings and place of study are presented in Table 1.
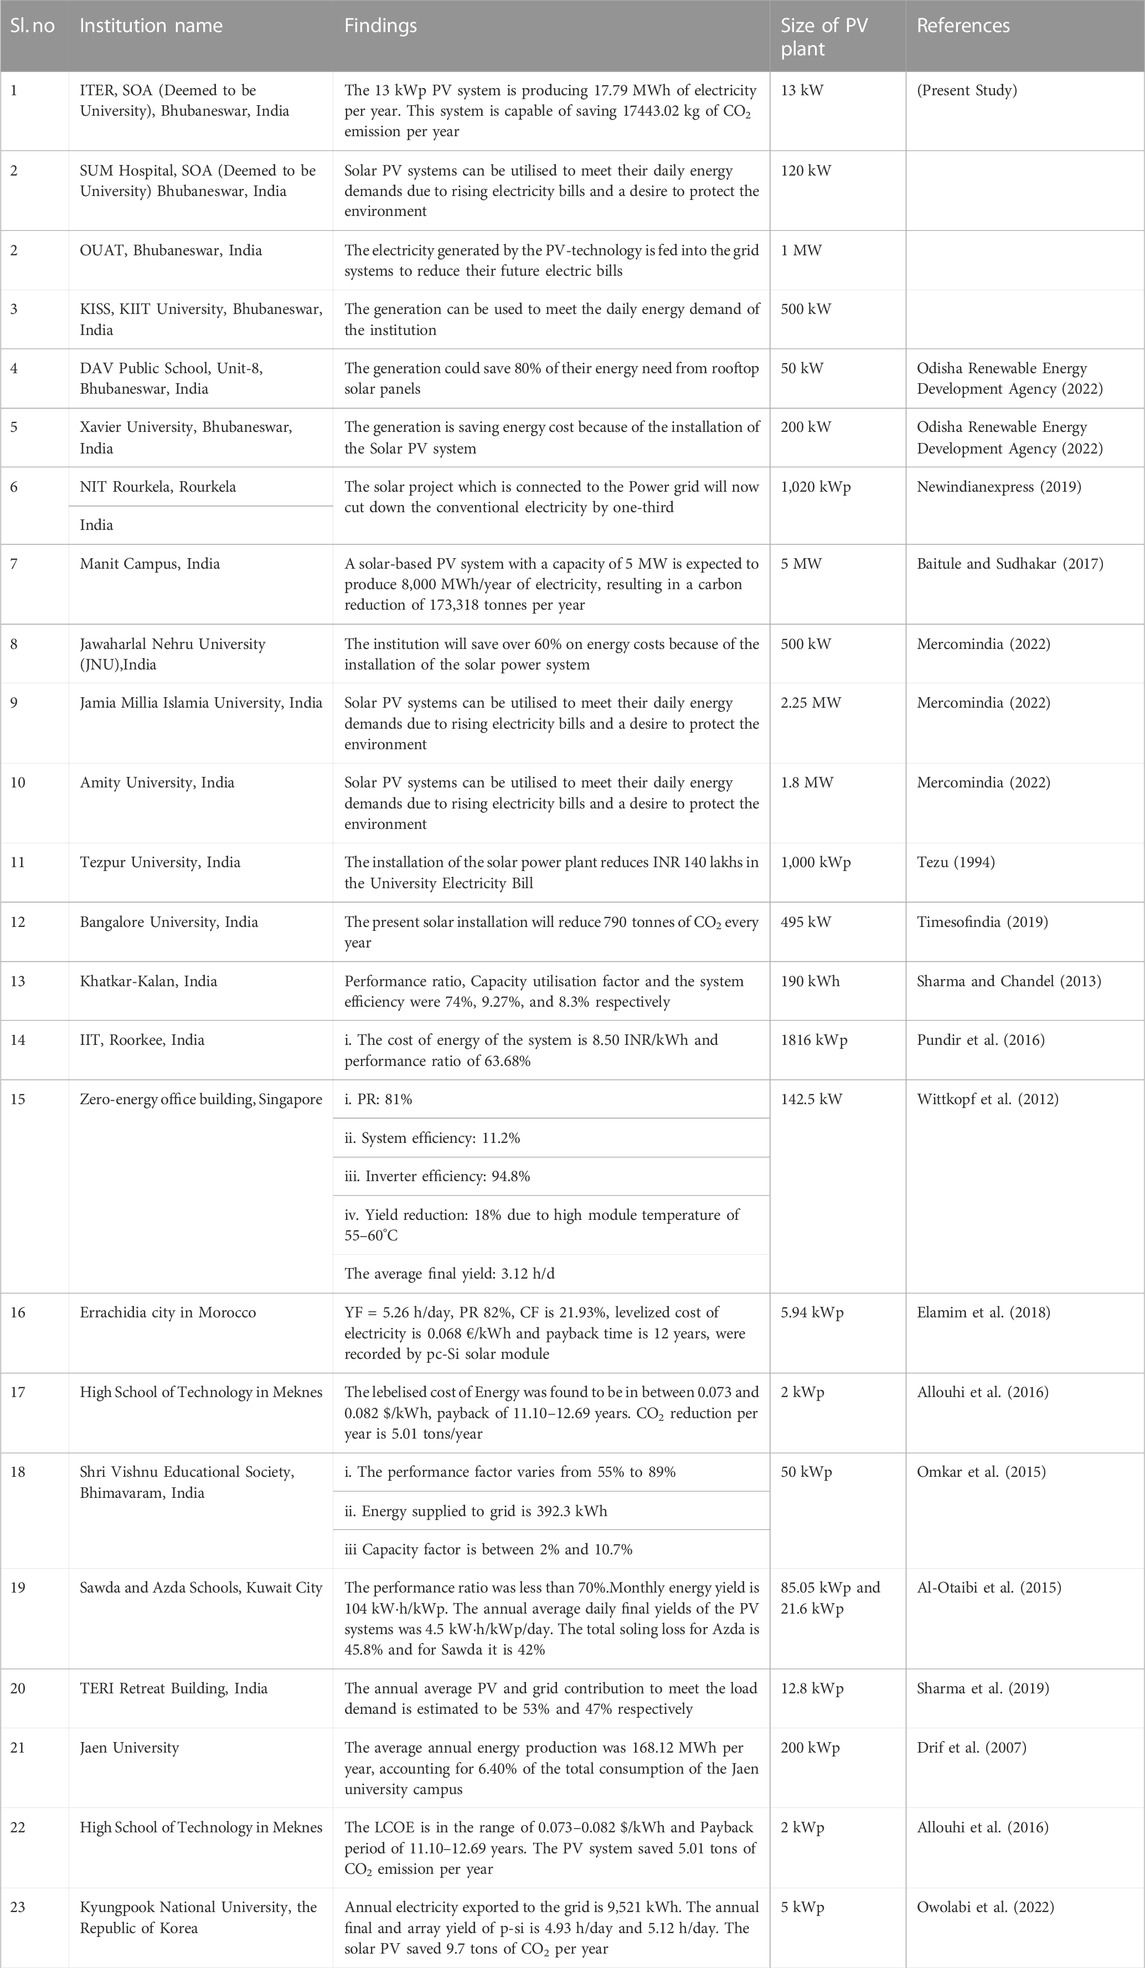
TABLE 1. Summary of some relevant studies in Institutional buildings.
2 Methodology
This study investigates the use of open rooftop areas at academic institutions to produce sustainable energy, which can generate revenue and protect the environment. Many adjustments must be made to achieve the best balance between energy performance and cost, particularly in self-consumption estimations. The detailed methodology is shown in Figure 1.
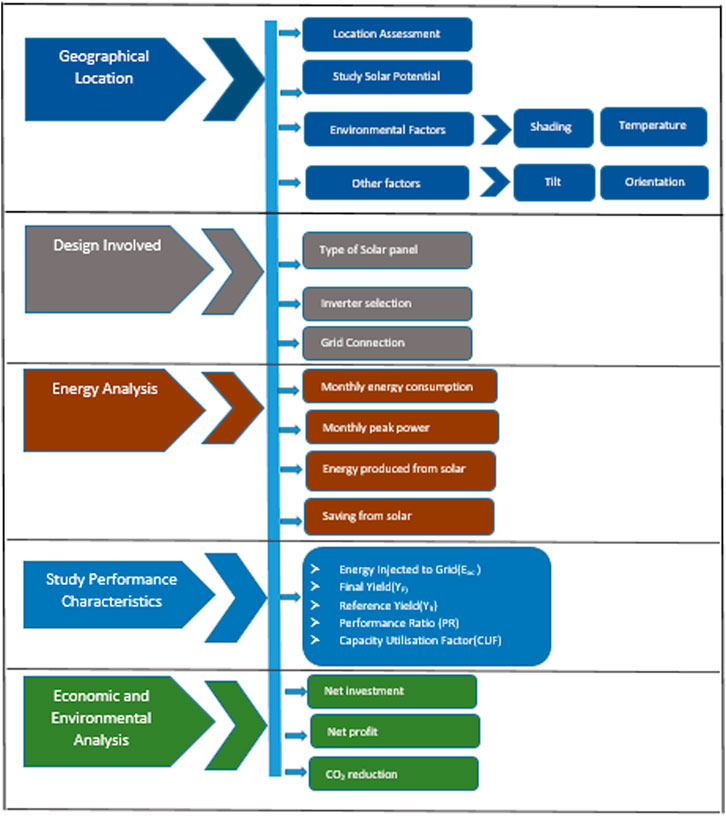
FIGURE 1. PV design methodology.
The measured performance characteristics were studied and compared with those of the PVSyst software to determine its feasibility in campus buildings. The parameters considered for designing a grid-connected solar Photovoltaic system are the location of the study (latitude and longitude), orientation, climatic condition, photovoltaic type, its losses, and the area required for the potential site for installation. The design procedure is as follows:
• Finding the geographical location for the installation of the solar PV system.
• Selecting the right model of a PV system
• Knowing the energy consumption of the institutional building
• Measured data analysis of the SPV system
• Data analysis by using PVSyst
• Comparison of the measured data with the predicted values by using PVSyst software
• Evaluation of the cost and benefit of the solar PV system
• Environmental benefit assessment of the PV System
3 Case study
The 13 kWp grid-connected solar PV system consists of 40 nos. of solar PV modules each with 1.94 m2 area (total area of 77.6 m2). An array is formed by connecting twenty modules in series, and two such arrays are arranged in parallel. The Waaree modules WS 325 (each of 325 Wp capacity) having 72 solar cells made up of polycrystalline silicon with an open circuit voltage (Voc) of 46.60 V and a short circuit current (Isc) of 9.20 A were used in the PV system. The modules are free from any effect of shade and are fixed with a tilt angle of 210 facing south at an azimuth angle of 00. The entire PV system is mounted on metal frames supported by concrete pillars. The surface of the PV modules was cleaned with water at intervals of 15 days throughout the monitoring period to reduce losses due to soiling. The solar panel, inverter, and battery bank should have the same input voltage (either 12 V, 24 V, or 48 V). In this case, a Kirloskar 3 Phase Solar Inverter, model KSG-III-20 K, was used to convert DC to AC, which was then fed directly into the state grid. The specifications of the PV module and the inverter are listed in Tables 2, 3, respectively.
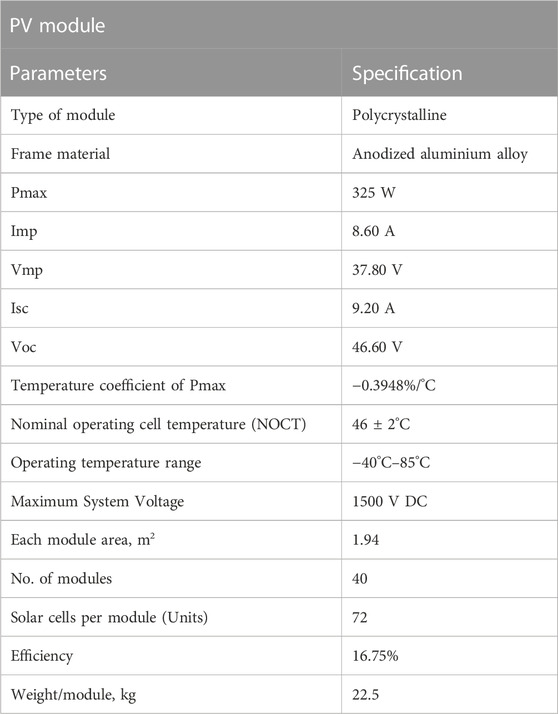
TABLE 2. Specification of PV module installed.
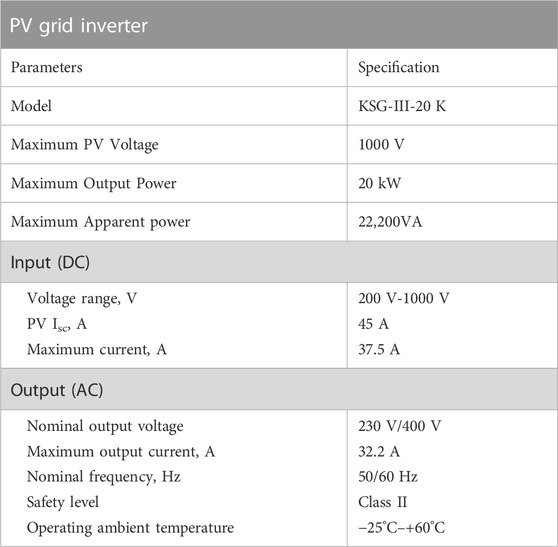
TABLE 3. Specification of inverter.
4 Result and discussion
4.1 Weather data
The study was conducted in Siksha “O” Anusandhan Deemed to be University Bhubaneswar, India. The satellite image of the roof area of the buildings of a constituent institute in Bhubaneswar, India is shown in Figure 2A. The image was assessed on 3rd December 2021 through “Google Earth” software.
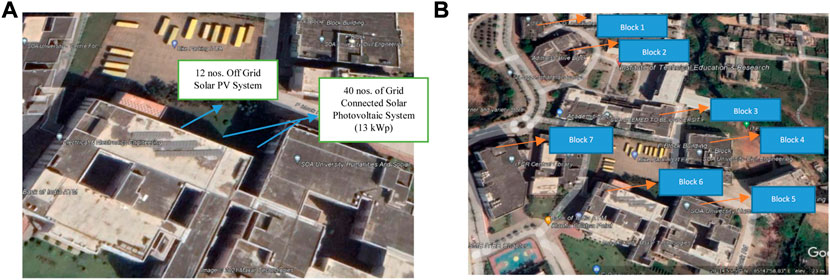
FIGURE 2. (A) Satellite image of the roof area of the building of the constituent Institute. (B) The roof top area found suitable for the construction.
Figure 2B shows the rooftop area, which is suitable for the construction of a large-scale solar PV system. A total of 22,048 m2 areas were identified for installation of the solar photovoltaic system, out of which only 101 m2 of rooftop area was utilized. The remaining 21,947 m2 can be used for the placement of an additional solar photovoltaic system. Solar irradiance data were used to assess the location’s solar potential, as it is the key parameter that directly affects the system’s energy output and is influenced by factors such as latitude, longitude, altitude, cloud cover, and air quality (Sharma and Goel, 2015; Rathod et al., 2016; Hasapis et al., 2017; Paudel et al., 2021).
The cell temperature was measured using an HDE infrared thermometer (Range: −32°C–380°C) at 15-min intervals and averaged hourly from 6.00 h to 18.00 h. A laboratory thermometer was used to record the ambient temperature. Other meteorological data, such as temperature, wind velocity, relative humidity, solar insolation, were obtained from the local meteorological department. The weather data are presented in Table 4.
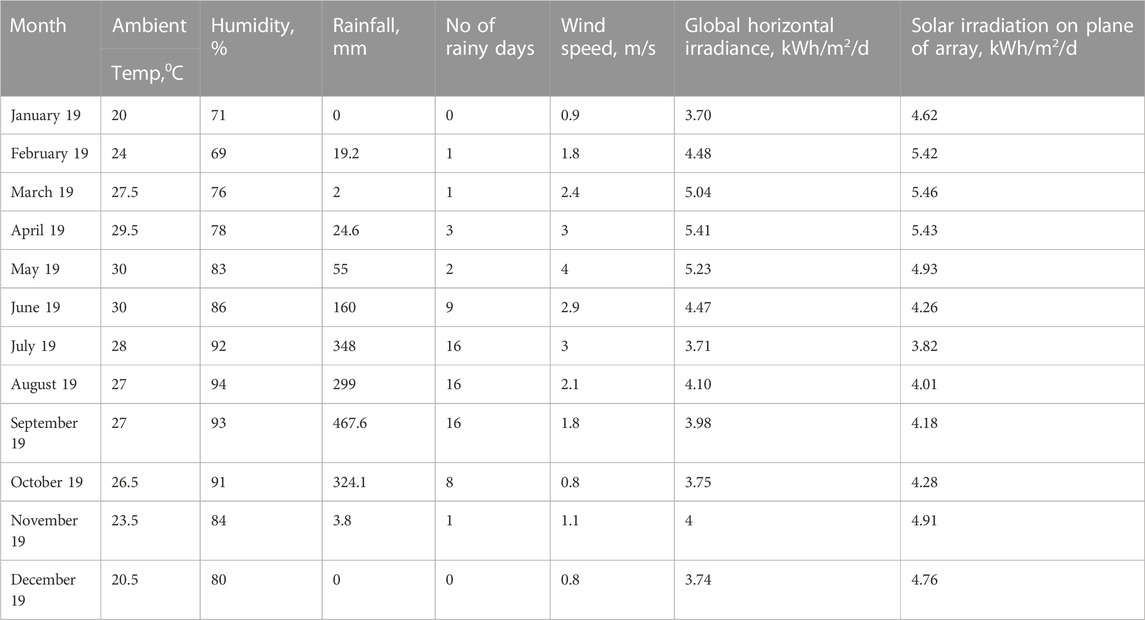
TABLE 4. Meteorological observations of the site.
From the above Table, it was seen that the maximum in plane solar irradiation was observed during the month of March while minimum was found during July. Minimum and maximum humidity varies from 69% to 94% while maximum wind speed of 4 m/s found in May 2019. The highest average ambient temperature of 30°C were observed in May, June and lowest of 20°C in the month of January. Maximum rainfall of 467.6 mm was found in the month of September 2019. Usually the solar radiation data is available for the horizontal surface. Therefore, it needs to be corrected for the tilted surface.
4.2 Selecting the right model of a PV system
Solar energy has gained in popularity over the last decade. Improvements in solar technology have resulted in a reduction in panel costs. The Government of India provides various financial incentives to encourage renewable energy development. Therefore, integration technologies have become essential. A comparison of the various types of solar PV technologies is presented in Table 5.
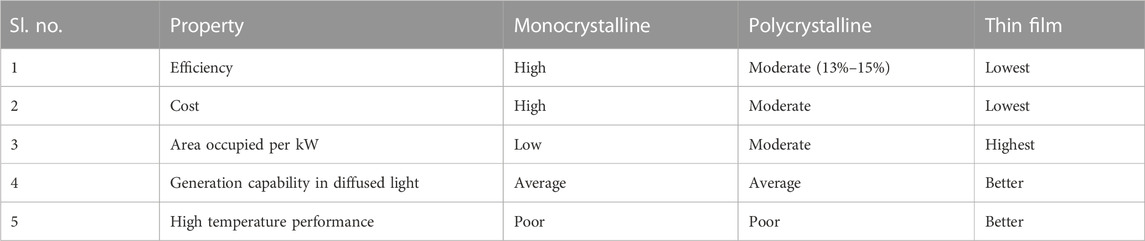
TABLE 5. Comparison of different solar technology.
Because polycrystalline solar panels are cheaper and more eco-friendly to produce, they are best suited for installation in large solar farms, roof-mounted arrays, traffic lights, and houses.
4.3 Estimating the energy and power consumption of the institutional building
The campus energy consumption data were studied by collecting data such as monthly energy consumption, monthly peak power, monthly electricity bills, energy produced from solar PV systems, and solar energy savings. The monthly energy consumption in MWh, Power per hour in kWh, and minimum demand for the year 2019 were collected through a personal survey, as mentioned in Table 6.
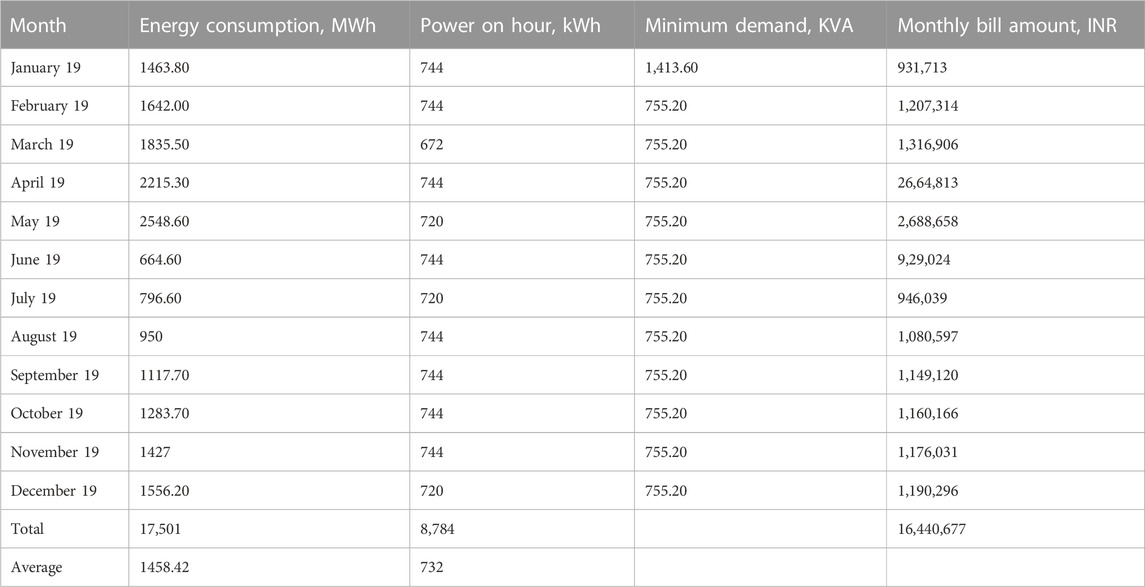
TABLE 6. Monthly energy consumption and monthly electricity bill.
The monthly average energy consumption of the campus was 1458.42 MWh whereas the yearly total energy consumption was 17,501 MWh. The average power-on time was 732 kWh. The total electricity bill of the campus is INR 1, 64, 40,677, which is too high. Thus, switching to various solar power options can reduce the total electricity bill.
4.4 Measured performance analysis of the solar PV system
The performance parameters such as final yield, reference yield, performance ratio, capacity utilisation factor, soiling loss, shading loss, and energy generation were studied to observe the overall performance of the PV power plant. The measured performance parameters of the 13-kWp grid connected PV system are given in Table 7.

TABLE 7. Measured performance parameters of 13 kWp grid connected PV system.
As the present PV system is installed on rooftop of a 5th floor building, shading loss due to adjacent buildings, trees, etc., is zero.
4.4.1 Soiling loss
As the present research site is situated in crowded localities, many traffic and construction sites are located in and around the building (where the rooftop system is mounted), causing more dust deposits on the modules. As massive construction is ongoing in and around the institutional building, the accumulation of dust over the solar panel is more, which requires frequent cleaning. The effect of dust accumulation is shown in Table 8, which is unique to our study. The measurement of soiling loss at the site of study is shown in Figure 3.
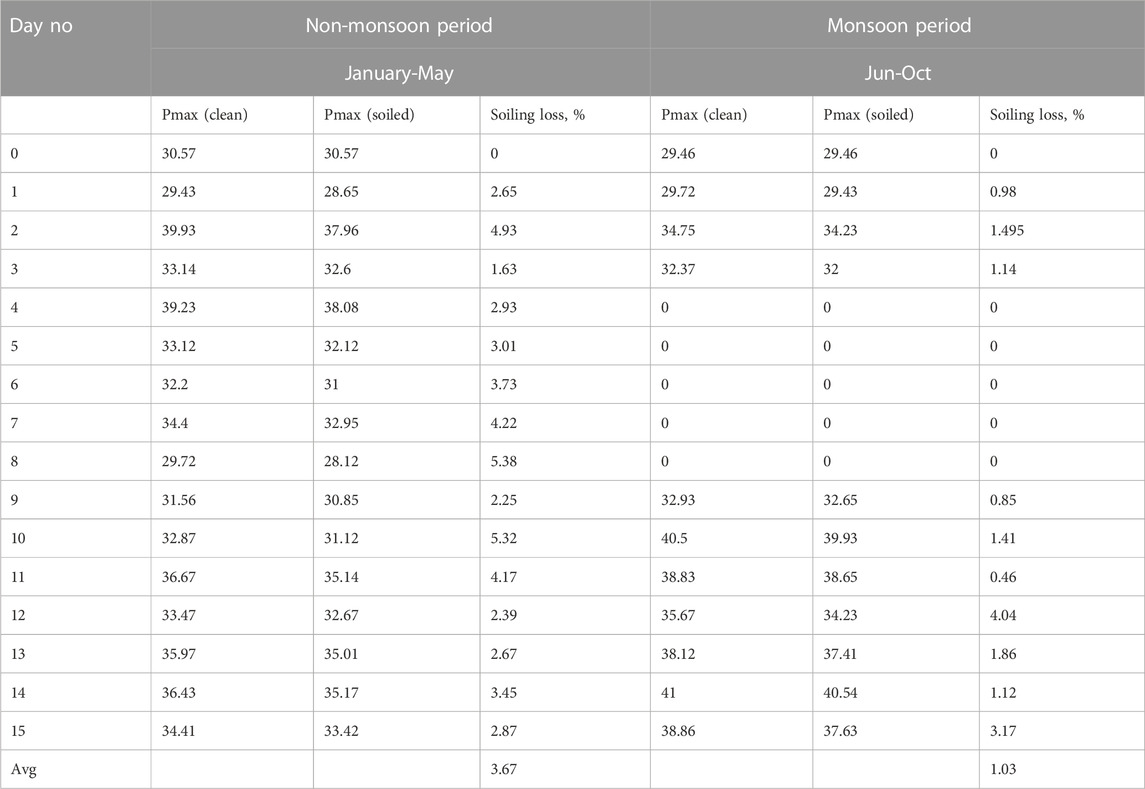
TABLE 8. Soiling loss in monsoon and non-monsoon days.
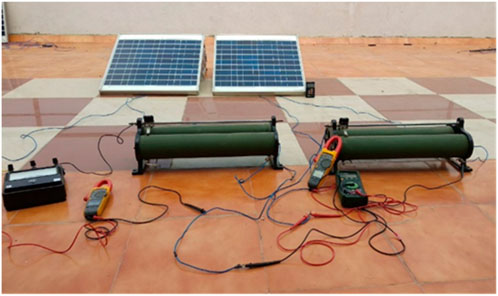
FIGURE 3. Measurement of soiling loss.
Two 50 Wp solar panels were mounted separately on the roof at a 210 tilt angle for soiling loss measurement, and Isc, Voc, and Pmax were measured for clean and soiled panel every day at 12 noon for 15 days. To minimize soiling loss, cleaning was performed every 15 days. Soiling loss was calculated by
Where, X = Isc or Pmax or daily energy yield in kWh, Isc and Pmax values are recorded at solar noon for soiling loss calculation.
Power and efficiency loss due to soiling can be calculated by (Goel et al., 2020)
From the above table it is seen that the soiling loss was found to be 3.67%/day during non-monsoon months (January-May) while it is only 1.03%/day in monsoon months (June-October). The details of soiling loss is shown in Figure 4A, B.
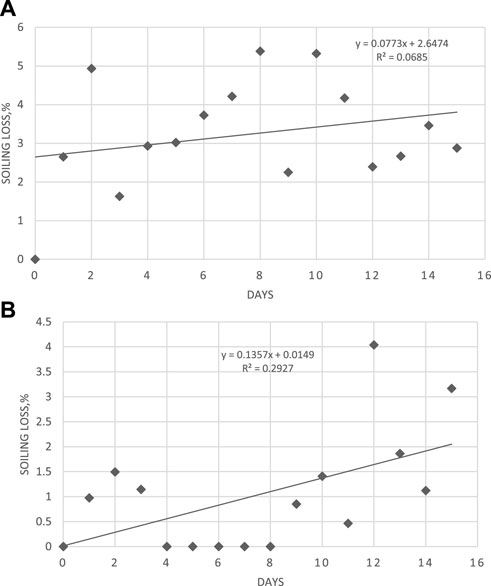
FIGURE 4. (A) Soiling loss in non-monsoon month. (B) Soiling loss in monsoon months.
4.5 Data analysis using PVSyst software
PVSyst is the most widely used simulation software tool for performance analysis of PV plants. It is capable of importing meteorological data from many sources according to the suitability of locations. This tool accurately predicts the energy yield, performance ratio, and efficiency of a system by considering various losses. It also performs an economic analysis of the PV systems.
The two most significant factors that affect the performance of a PV system are temperature and solar irradiation. Lower irradiance results in a lower power output and temperatures above 250°C lead to reductions in the PV power output. There is also a point on the curve at which the PV module discharges the maximum power to the load for each curve. This point is referred to as the maximum power point (MPP). In addition; other factors also affect solar photovoltaic power generation. These are the losses due to shading, soiling, mismatch, and ohmic losses; the power–voltage curve of the Waaree WS 325 PV module at various levels of irradiance at 25°C is shown in Figure 5A, while Figure 5B depicts the power–voltage relationship at various cell temperatures.
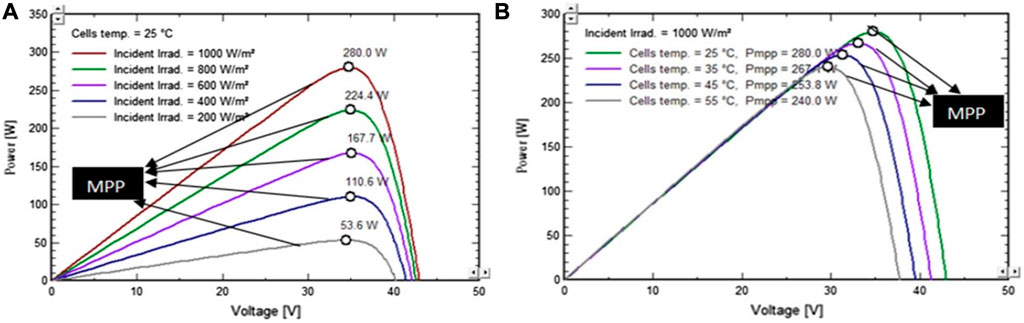
FIGURE 5. (A) P–V characteristics of PV module with the location of MPP for different irradiance levels at 25°C (B) P–V characteristics of the module at different temperatures at an irradiance of 1000 W/m2.
The monthly performance of the PV system from PVSyst software is shown in Table 9.
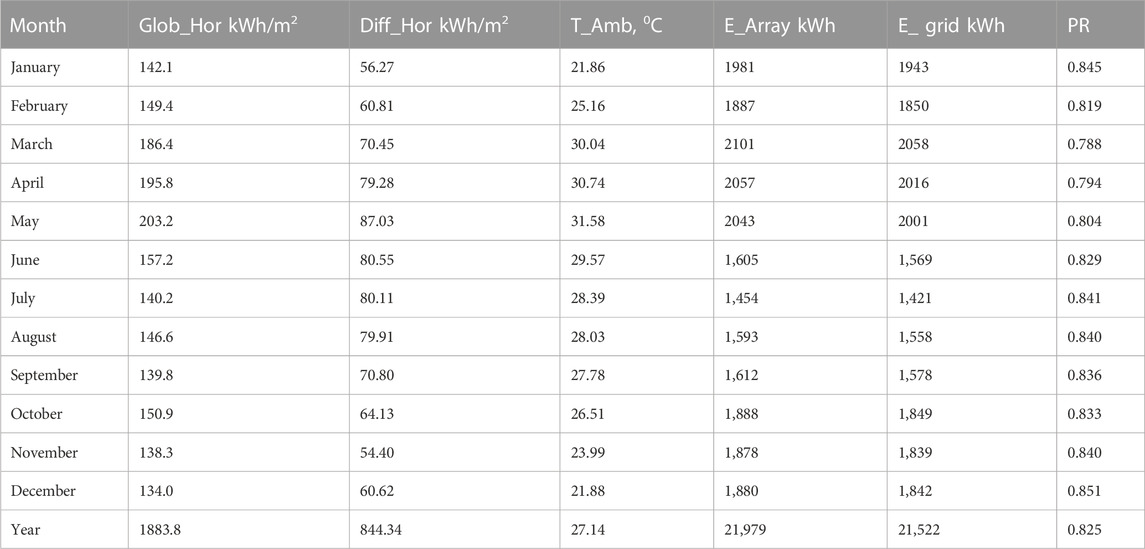
TABLE 9. Performance Calculation of the PV System Balances and main results.
The energy injected to the grid is shown in Figure 6.

FIGURE 6. Energy injected into the grid.
The normalised performance coefficient and the simulation results are given in Table 10; Figure 7 respectively.

TABLE 10. Normalised Performance coefficient.
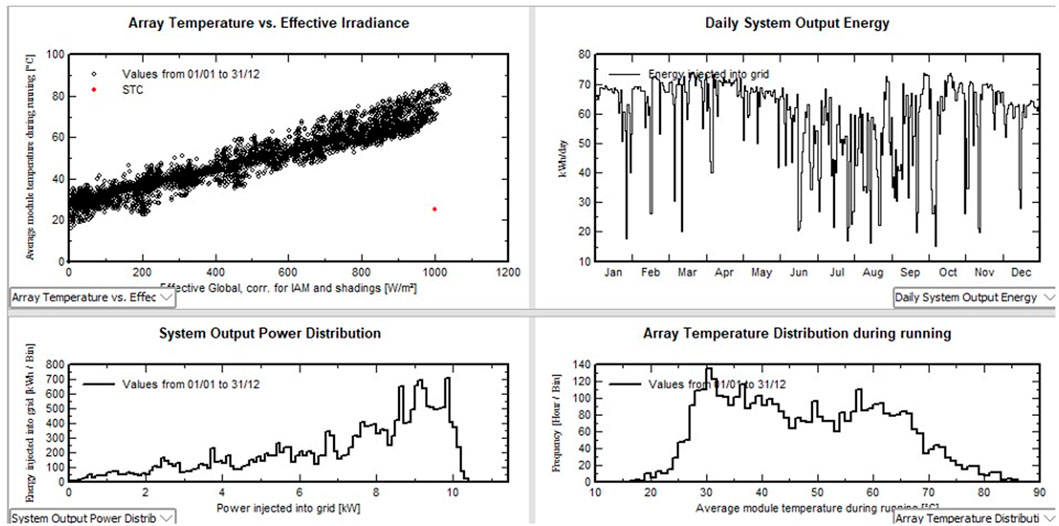
FIGURE 7. Simulation results.
4.5.1 Losses parameters
The main causes of losses in PV systems are thermal loss, ohmic loss, mismatch loss, soiling loss, IAM loss, degradation loss, and aging. The advantage of using the PVSyst software is the design of a PV system by considering the loss parameters of all systems. Table 11 shows the detailed losses of the 13 kWp PV system. The PV array experienced a maximum ohmic loss of 262.12 kWh annually. The gross annual inverter loss was calculated to be 456.33 kWh. The loss diagram of the installed PV system is shown in Figure 8.
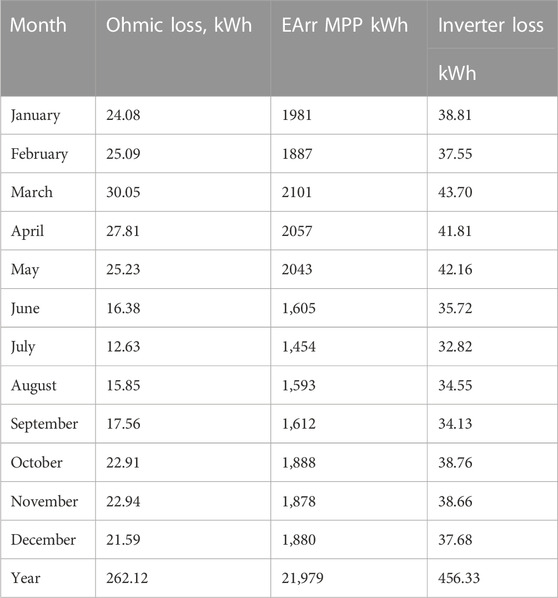
TABLE 11. Various system losses of 13 kWp PV system Detailed System losses.
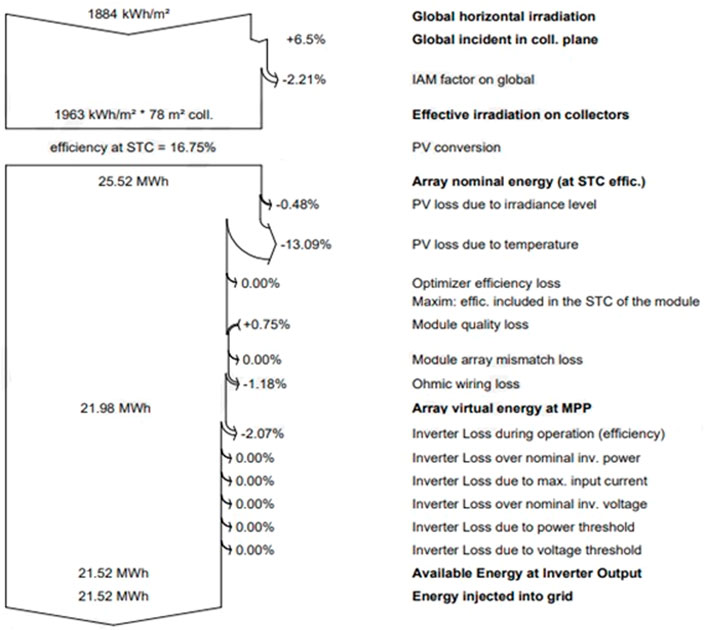
FIGURE 8. Loss diagram of the PV System.
4.6 Comparison between measured data with the predicted values by using PVSyst
The comparison of measured and simulation parameters is shown in Table 12.
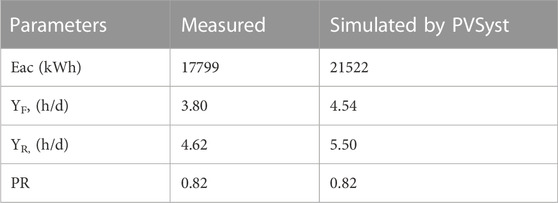
TABLE 12. Comparison of measured and simulation parameters.
The measured values of the final yield, reference yield, and performance ratio were in close agreement with the results obtained from the PVSyst software. The energy supplied to the grid by the PVSyst software was much higher than that of the measured values. The annual energy supplied to the grid was 17799 kWh. The measured annual performance ratio of 82% indicates that the installation of a PV system in eastern India is much more effective for solar power generation.
4.7 Cost and benefit of the system
4.7.1 Net cash flow
The investment of the system includes installation costs and maintenance costs. The detailed investment cost of the system by PVSyst software is given in Table 13.
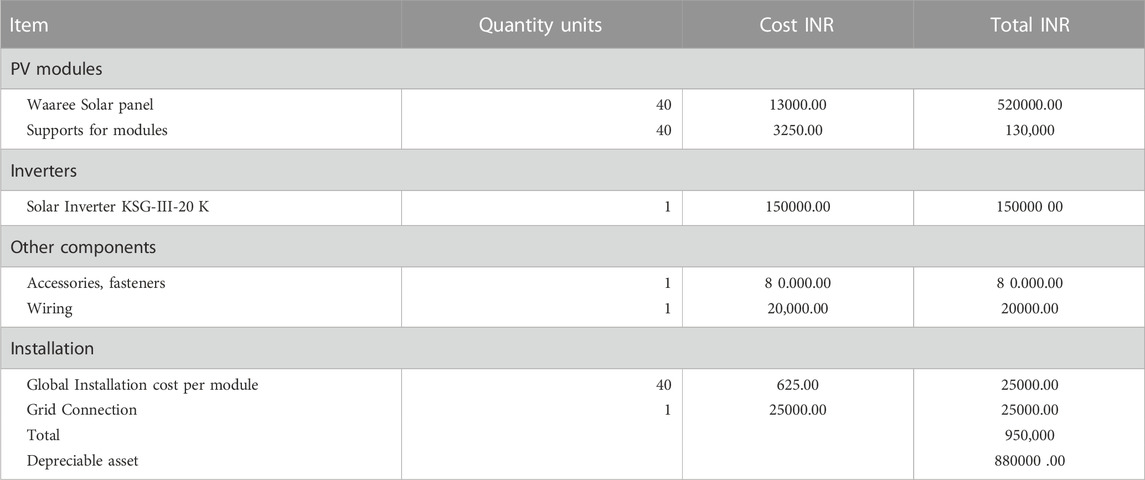
TABLE 13. Investment cost of the system. Installation costs.
4.7.2 Operating costs of the system
The detailed operation and maintenance cost of the 13 kWp solar PV system is shown in Table 14.
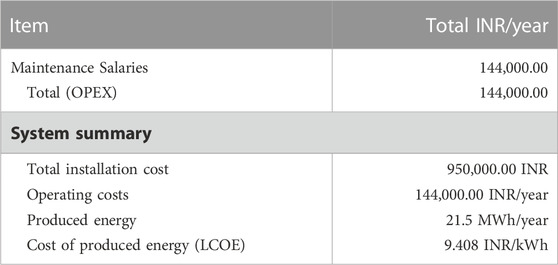
TABLE 14. Operation and maintenance cost of the system.
The detailed economic analysis of the system is shown in Table 15.
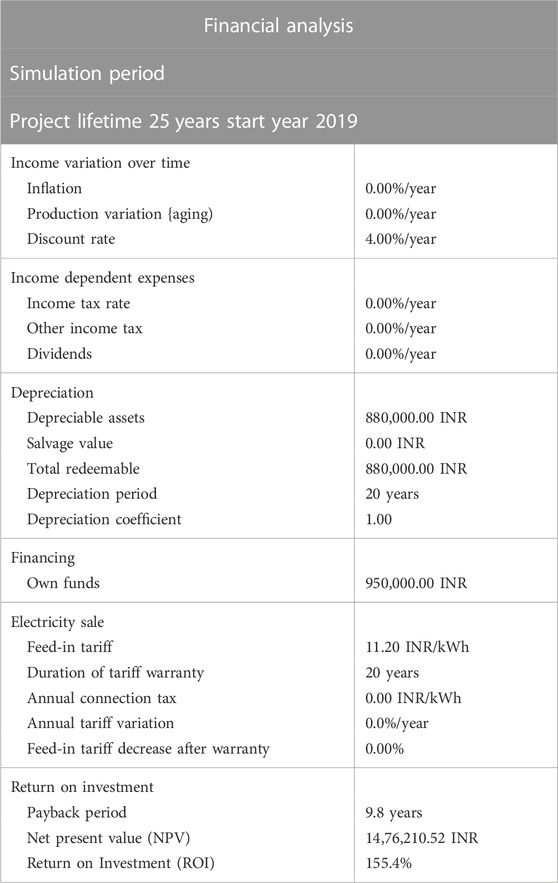
TABLE 15. Detail financial analysis of the system.
4.7.3 System’s net benefit
The yearly net profit from the PV system is shown in Table 16.
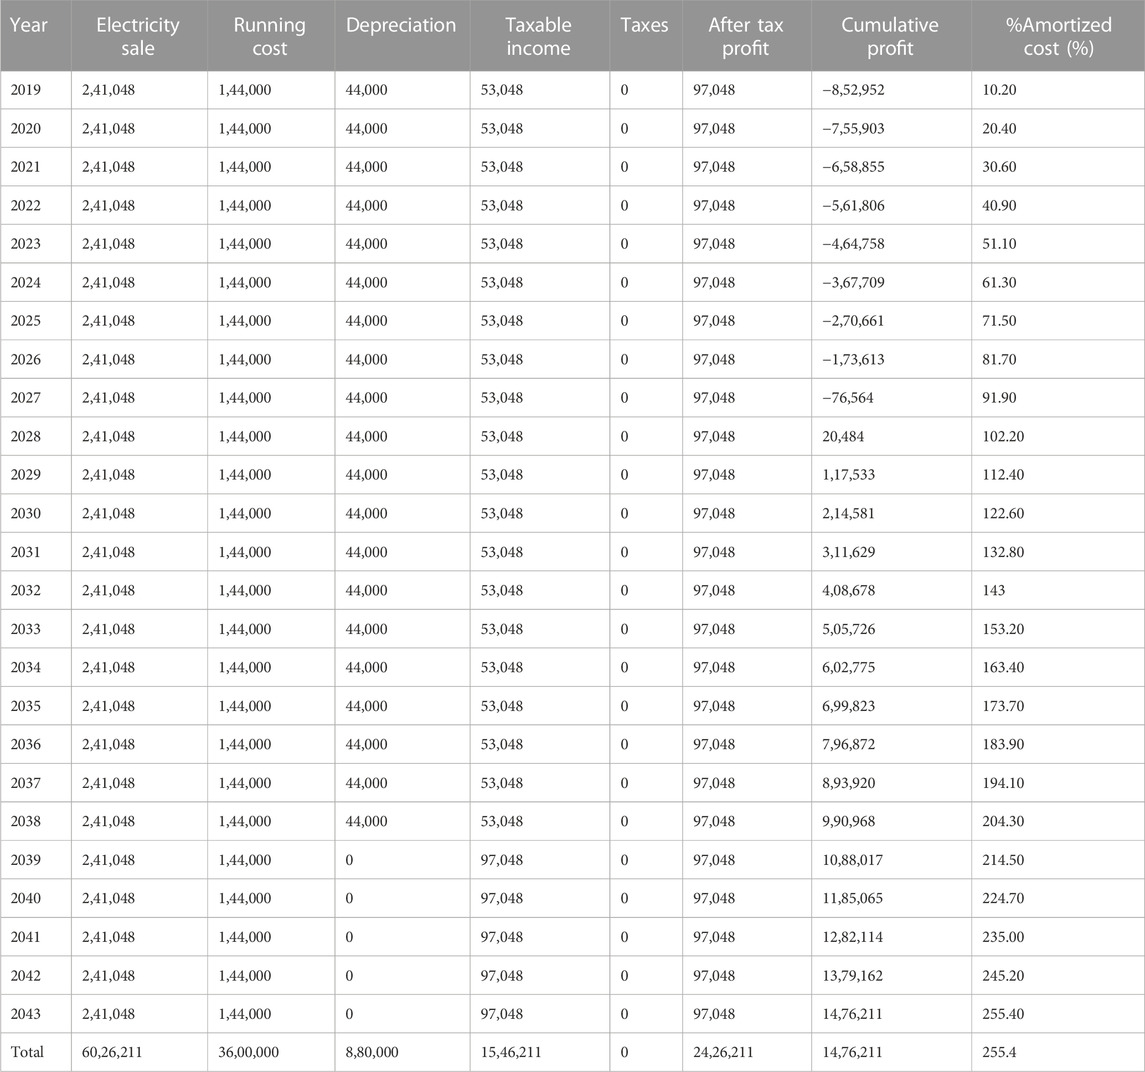
TABLE 16. Yearly net profit from the PV system.
The yearly net profit from the PV system is calculated for 24 years, and the net cumulative profit per year is INR 14, 76,211 (Table 16).
4.8 Environmental benefit assessment of the system
Power generation from PV systems or other renewable resources has a positive environmental impact. Carbon dioxide (CO2), nitrogen oxide (NOx), sulphur dioxide (SO2), and ash are among the greenhouse gases (GHG) released by coal-fired thermal power plants. The 13 kWp solar PV system installed at the institution is predicted to have reduced 17443.02 kg of CO2, 22.07 kg of SO2, and 46.1 kg of NOx emissions per annum (Table 17).
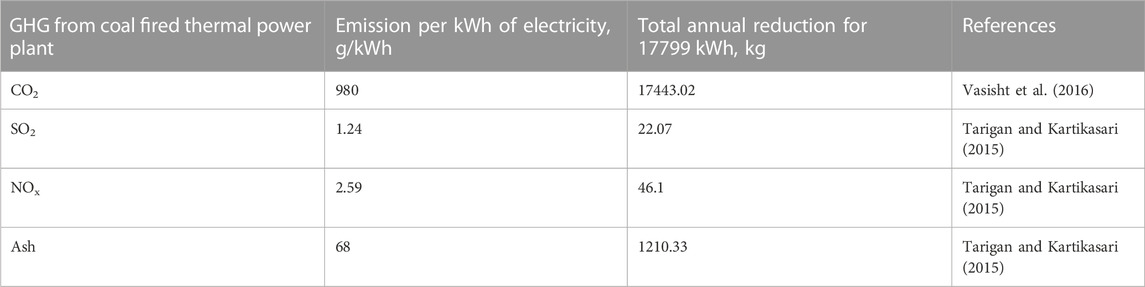
TABLE 17. Greenhouse gasses reduction by 13-kWp PV system.
5 Conclusion
The performance of a 13 kWp grid-connected rooftop solar photovoltaic system installed on ITER, SOA (Deemed to be University), and Bhubaneswar was studied in 2019. The annual performance parameters were determined and compared with simulated values using the PVsyst software tool. The measured values of the final yield, reference yield, and performance ratio were in close agreement with the results obtained using the PVSyst software. The energy supplied to the grid by the PVSyst software was much higher than that of the measured values. The measured and simulated PR values were 82%. The annual electricity supplied to the grid was 17.79 MWh, final yield was 3.80 h/d and reference yield was 4.62 h/d. The solar PV system installed at the institution is predicted to have reduced 17443.02 kg CO2/year from the atmosphere.
Data availability statement
The original contributions presented in the study are included in the article/supplementary material, further inquiries can be directed to the corresponding author.
Author contributions
All authors listed have made a substantial, direct, and intellectual contribution to the work and approved it for publication.
Conflict of interest
The authors declare that the research was conducted in the absence of any commercial or financial relationships that could be construed as a potential conflict of interest.
Publisher’s note
All claims expressed in this article are solely those of the authors and do not necessarily represent those of their affiliated organizations, or those of the publisher, the editors and the reviewers. Any product that may be evaluated in this article, or claim that may be made by its manufacturer, is not guaranteed or endorsed by the publisher.
Abbreviation
CUF capacity utilisation factor,% Diff Hor horizontal diffused radiation, kWh/m2 Eac energy injected into grid, kWh EARR MPP effective energy at the output of the array, at maxi maximum power point EArray effective energy at the output of the array, kWh GlobHor horizontal global irradiation,kWh/m2 h/d hour/day Ht total mean daily in-plane solar insolation, kWh/m2/day kWh kilo watt hour Lc captor loss, h/d LCR array loss/incident energy ratio = Lc/YR LS system loss, h/d LSR system loss/incident energy ratio = Ls/YR MWh mega watt hour PR performance ratio PVrated rated PV power T Amb ambient temperature YA array yield YF final yield YRreference yield.
References
Al-Otaibi, A., Al-Qattan, A., Fairouz, F., and Al-Mulla, A. (2015). Performance evaluation of photovoltaic systems on Kuwaiti schools’ rooftop. Energy Convers. Manag. 95, 110–119. doi:10.1016/j.enconman.2015.02.039
Allouhi, A., Saadani, R., Kousksou, T., Saidur, R., Jamil, A., and Rahmoune, M. (2016). Grid-connected PV systems installed on institutional buildings: Technology comparison, energy analysis and economic performance. Energy Build. 130, 188–201. doi:10.1016/j.enbuild.2016.08.054
Baitule, A. S., and Sudhakar, K. (2017). Solar powered green campus: A simulation study. Int. J. Low-Carbon Technol. 12 (4), 400–410. doi:10.1093/ijlct/ctx011
Drif, M., Pérez, P. J., Aguilera, J., Almonacid, G., Gomez, P., De la Casa, J., et al. (2007). Univer Project. A grid connected photovoltaic system of 200kWp at Jaén University. Overview and performance analysis. Sol. Energy Mater. Sol. Cells 91 (8), 670–683. doi:10.1016/j.solmat.2006.12.006
Elamim, A., Hartiti, B., Haibaoui, A., Lfakir, A., and Thevenin, P. (2018). Performance evaluation and economical analysis of three photovoltaic systems installed in an institutional building in Errachidia, Morocco. Energy Procedia 147, 121–129. doi:10.1016/j.egypro.2018.07.041
Goel, S., and Sharma, R. (2021). Analysis of measured and simulated performance of a grid-connected PV system in eastern India. Environ. Dev. Sustain. 23 (1), 451–476. doi:10.1007/s10668-020-00591-7
Goel, S., Panda, S., Kumar, N. M., and Sharma, R. (2020). “Effect of soiling on power output of a photovoltaic system,” in Innovation in electrical power engineering, communication, and computing technology (Singapore: Springer), 351–359.
Government Of Odisha (2023). Topography. Available at: https://odisha.gov.in/odisha-profile/topography.
Hasapis, D., Savvakis, N., Tsoutsos, T., Kalaitzakis, K., Psychis, S., and Nikolaidis, N. P. (2017). Design of large scale prosuming in Universities: The solar energy vision of the TUC campus. Energy Build. 141, 39–55. doi:10.1016/j.enbuild.2017.01.074
IFC (2015). Utility-scale solar photovoltaic power plants. Washington, D.C: International finance corporation.
Mercomindia (2022). Mercom clean energy insigts. Available at: https://mercomindia.com.
Newindianexpress (2019). NIT Rourkela goes green with solar power plant. Available at: https://www.newindianexpress.com/states/odisha/2019/jun/25/nit-rourkela-goes-green-with-solar-power-plant-1994993.html.
Odisha Renewable Energy Development Agency (2022). Odisha renewable energy development agency. Available at: http://rts.odisha.gov.in/gallery.aspx.
Omkar, K., Srikanth, M. V., Swaroop, K. P., and Pvv, R. R. (2015). “Performance evaluation of 50 KWp rooftop solar PV plant,” in Industrial Instrumentation and Control (ICIC), 2015 International Conference on (IEEE), 761–765.
Owolabi, A. B., Yakub, A. O., Li, H. X., and Suh, D. (2022). Performance evaluation of two grid-connected solar photovoltaic systems under temperate climatic conditions in South Korea. Energy Rep. 8, 12227–12236. doi:10.1016/j.egyr.2022.09.053
Paudel, B., Regmi, N., Phuyal, P., Neupane, D., Hussain, M. I., Kim, D. H., et al. (2021). Techno-economic and environmental assessment of utilizing campus building rooftops for solar PV power generation. Int. J. Green Energy 18, 1469–1481. doi:10.1080/15435075.2021.1904946
Pundir, K. S. S., Varshney, N., and Singh, G. K. (2016). “Comparative study of performance of grid connected solar photovoltaic power system in IIT Roorkee campus,” in Paper of international conference on innovative trends in science, engineering and management held at New Delhi, India, 422–431.
Rathod, A. P. S., Mittal, P., and Kumar, B. (2016). “Analysis of factors affecting the solar radiation received by any region,” in 2016 International Conference on Emerging Trends in Communication Technologies (ETCT), Dehradun, India, 18-19 November 2016 (IEEE).
Sathyanarayana, P., Ballal, R., Sagar, P. L., and Kumar, G. (2015). Effect of shading on the performance of solar PV panel. Energy Power 5 (1), 1–4.
Sharma, A., Kolhe, M., Konara, K. M. S. Y., Mudgal, A., Muddineni, K., Garud, S., et al. (2019). “Performance assessment of building integrated photovoltaic and battery energy system: A case study of TERI-retreat facilty in India,” in 2019 4th International Conference on Smart and Sustainable Technologies (SpliTech), Split, Croatia, 18-21 June 2019 (IEEE), 1–5.
Sharma, R., and Goel, S. (2017). Performance analysis of a 11.2 kWp roof top grid-connected PV system in Eastern India. Energy Rep. 3, 76–84. doi:10.1016/j.egyr.2017.05.001
Sharma, R., and Goel, S. (2015). “Solar photovoltaic system design and its reliability,” in 2015 IEEE Power, Communication and Information Technology Conference (PCITC), Bhubaneswar, India, 15-17 October 2015 (IEEE), 155–159.
Sharma, V., and &Chandel, S. S. (2013). Performance analysis of a 190 kWp grid interactive solar photovoltaic power plant in India. Energy 55, 476–485. doi:10.1016/j.energy.2013.03.075
Tarigan, E., and Kartikasari, F. D. (2015). Techno-economic simulation of a grid-connected PV system design as specifically applied to residential in Surabaya, Indonesia. Energy Procedia 65, 90–99. doi:10.1016/j.egypro.2015.01.038
Tezu (1994). Solar power plant reduces rs 143 lakhs in the university electricity bill. Available at: http://www.tezu.ernet.in/dener/solar.htm.
Timesofindia (2019). Bangalore University inaugurates solar power project. Available at: http://timesofindia.indiatimes.com/articleshow/71392456.cms?utm_source=contentofinterest&utm_medium=text&utm_campaign=cppst.
Vasisht, M. S., Srinivasan, J., and Ramasesha, S. K. (2016). Performance of solar photovoltaic installations: Effect of seasonal variations. Sol. Energy 131, 39–46. doi:10.1016/j.solener.2016.02.013
Keywords: solar photovoltaic system, performance study, techno-economic analysis, environmental emission analysis, soiling loss
Citation: Sharma R, Goel S and Lenka SR (2023) Pragmatic analysis of solar photovoltaic system design in an institutional building in eastern India. Front. Energy Res. 11:943207. doi: 10.3389/fenrg.2023.943207
Received: 13 May 2022; Accepted: 10 March 2023;
Published: 22 March 2023.
Edited by:
Thomas Alan Adams, Norwegian University of Science and Technology, NorwayReviewed by:
Rajesh S. Kempegowda, Inrigo As, NorwaySurendra Poonia, Central Arid Zone Research Institute (ICAR), India
Copyright © 2023 Sharma, Goel and Lenka. This is an open-access article distributed under the terms of the Creative Commons Attribution License (CC BY). The use, distribution or reproduction in other forums is permitted, provided the original author(s) and the copyright owner(s) are credited and that the original publication in this journal is cited, in accordance with accepted academic practice. No use, distribution or reproduction is permitted which does not comply with these terms.
*Correspondence: Sonali Goel, c29uYWxpMTk4ODFAZ21haWwuY29t