 Zhengping Liang1*
 Bo Li
Bo Li Yiyi Zhang
94% of researchers rate our articles as excellent or good
Learn more about the work of our research integrity team to safeguard the quality of each article we publish.
Find out more
ORIGINAL RESEARCH article
Front. Energy Res. , 12 January 2024
Sec. Smart Grids
Volume 11 - 2023 | https://doi.org/10.3389/fenrg.2023.1348433
This article is part of the Research Topic Application of Image Processing and Knowledge Reasoning in the Construction of New Power System View all 23 articles
The insulation performance of oil-immersed paper bushings is prone to deteriorate, primarily due to moisture intrusion and thermal aging. The frequency domain spectroscopy (FDS) method is commonly employed to assess the insulation condition of the bushing. However, identifying and extracting relaxation polarization information from the low-frequency region of the FDS curve can be challenging, and there is little research about the condition evaluation under the combined effects of aging states and moisture content. To address this issue, this article uses the Taylor formula mathematical model to extract characteristic parameters from the dielectric modulus curve of OIP bushings and uses the KNN algorithm to achieve the evaluation of aging and moisture status. Then, the effectiveness and accuracy of the proposed method are validated on three field OIP bushings. The results demonstrate that the evaluation accuracy of the proposed method exceeds 83%, which has significant advantages compared to other classification algorithms. The innovation of this article lies in extracting new feature parameters and combining them with intelligent classification algorithms to evaluate the moisture and aging state of the bushing.
Oil-impregnated paper (OIP) bushings are extensively employed in power systems and hold the dominant market share, encompassing approximately 80% of the global bushing market (Bouaicha et al., 2009; Jyothi and Ramu, 2012). Once the bushing failure occurs, it may directly or indirectly cause huge economic losses and affect the stable operation of the power system (Wang et al., 2019; Liao et al., 2021). Statistics indicate that bushing faults account for a significant portion, ranging from 30% to 45%, of various power accidents (Yang et al., 2019; Liu et al., 2020a). Additionally, more than 37% of transformer explosions and fire incidents can be attributed to bushing faults, with a rising trend (Teng et al., 2022; Su et al., 2023). Among numerous factors influencing bushing performance, aging and moisture have the most substantial impact on the insulation (Teng et al., 2022). Therefore, deterioration in this context typically refers to the effects of aging and moisture intrusion on the oil-paper insulation of OIP bushings (Li et al., 2021; Zhou et al., 2021; Akbari et al., 2023). The degree of polymerization (DP) is usually considered the most important indicator for evaluating the aging degree of insulation papers (Li et al., 2020). Consequently, conducting a comprehensive evaluation of the bushing’s moisture condition and dielectric polarization (DP) holds immense significance.
In recent years, frequency domain spectroscopy (FDS) technology has been widely applied in the assessment of bushing conditions (Saha and Purkait, 2004; Fofana and Hadjadj, 2016; Zhang et al., 2019a; Xie et al., 2019). Compared with other dielectric response methods, it has advantages such as practicality, non-destructive, and rich insulation information (Buchacz et al., 2017; Netaworldjournal, 2018).
For the status evaluation of oil-paper insulation (Linhjell et al., 2007) pointed out that an increase in the moisture content of the insulating pressboard can cause the complex relative dielectric constant curve to shift towards the coordinate axis at high frequencies (Jadav et al., 2014) pointed out that the complex relative permittivity curves are more sensitive to the moisture content of the pressboard, while the sensitivity of the curves to aging is relatively small (Zaengl, 2003). Establish a quantitative relationship between the moisture content of insulation paper and the tan δ curve (Liu et al., 2021) extracted FDS test feature values from insulating paper with different levels of moisture content, and applied the GA-SVM (Support Vector Machine Based on Genetic Algorithm Optimization) algorithm to diagnose moisture content under laboratory and on-site conditions (Poovamma et al., 2008). found that the dielectric loss and the imaginary part of the complex relative permittivity of the insulating paperboard increases with the increase of aging degree, and the peak of the tanδ curve appears in the low-frequency region (Zhang et al., 2019b) obtained a new characteristic quantity based on the Davidson Cole model and the complex relative permittivity curve, and proposed a new quantitative evaluation method for the aging state of oil-paper insulation (Ren et al., 2019) reported a quantitative evaluation method for the insulation aging status of transformers based on frequency domain dielectric response test results by taking into account the Arrhenius equation and Ekendam equation.
However, the FDS parameters adopted in the above method is not applicable to the study of the relaxation process of the oil-paper insulation of the transformer bushings in the low-frequency region, which in turn makes the information on the insulation state carried by it ambiguous and leads to errors in the results. In addition, the state assessment of oil-paper insulation by the above methods often only considers the influence of a single factor, in fact, the moisture and aging process is always accompanied in the bushing at the same time, so the assessment of a single state of the bushing may lead to unsatisfactory assessment results.
Compared with the traditional FDS curves, the dielectric modulus has an outstanding advantage in characterizing the dielectric properties of insulating materials, as it carries more comprehensive information about the relaxation of insulating materials and reduces the influence of electrode polarization and conductivity behavior on the measurement results. In addition, the K-Nearest Neighbor (K-NN) classification algorithm has the advantages of high accuracy, insensitivity to anomalies, and conceptual clarity, and has been widely used in text and image recognition in recent years (Zhang et al., 2017; Islam et al., 2018; Liao et al., 2020). Besides, the K-NN classification algorithm has high flexibility, universality and evaluation ability for the comprehensive evaluation of two dimensions of moisture and aging state of oil-paper insulation (Choi et al., 2009; Rouhafzay and Cretu, 2020).
Therefore, this paper establishes a mathematical model of dielectric modulus and analyzes the influence of aging and moisture on the dielectric modulus curve, and proposes a Taylor’s formula mathematical model on the basis of the obtained dielectric modulus curve, which extracts the characteristic parameters of the dielectric modulus curves of different moisture and aging states. Then, combined with the K-NN classification algorithm model, three field bushings with unknown insulation states are evaluated for moisture and aging states (Liu et al., 2020b; Fan et al., 2021). Subsequently, an analysis and comparison with other classification algorithms (Support Vector Machine, Naive Bayes, and Decision Tree) is carried out to analyze the evaluation results and errors of several algorithms in detail, and then to prove the effectiveness and accuracy of the proposed evaluation method.
According to (Li et al., 2020), the reciprocal of the complex dielectric constant defines the complex dielectric modulus M*(ω). This relationship is expressed in Eqs 1, 2.
Equation 3 depicts the formulations for the real and imaginary parts of the dielectric modulus.
If the Debye relaxation model is introduced, the complex permittivity ε*(ω) can then be expressed in Eqs 4, 5 as
where εs is the static dielectric constant, ε∞ is the dielectric constant as the angular velocity approaches infinity, τ is the relaxation time constant, and the distribution factor β (0<β < 1) is related to the shape of the FDS curve plotted in the complex plane (Li et al., 2020).
The detailed relationship between dielectric modulus and complex dielectric constant is as Eq. 6
where M∞ = 1/ε∞, Ms = 1/εs and τM = τ(ε∞/εs)1/β. Furthermore, since ε∞ is always less than εs, it is easy to deduce that τM is always less than τ. The above relations indicate that the frequency interval characterizing the relaxation polarization in the complex dielectric modulus profile will move to a higher frequency interval than the dielectric constant. If M∞, Ms, and τM are substituted into Eq. 5, the expressions for the real and imaginary parts of M*(ω) are obtained as shown in Eq. 7.
When the effect of conductivity is neglected, in mathematical form the complex dielectric modulus M*(ω) can be regarded as the reciprocal of the complex relative permittivity ε*(ω), with the frequency f in the denominator position. The dielectric modulus M*(ω) serves as a valuable tool for assessing the insulation condition of transformer or bushing oil-paper structures under alternating electric fields. It overcomes the limitation of complex relative dielectric constant ε*(ω) by avoiding the masking of relaxation polarization information in the low-frequency range. Thus, the dielectric modulus M*(ω) effectively captures and characterizes the relaxation polarization properties of the oil-paper insulation, contributing to the evaluation of the insulation status of the bushing.
Taylor’s formula is one of the approximation methods often used in order to study the properties of complex functions, and its core idea is to approximate a complex function by replacing it with a polynomial function, within the function’s domain of definition. The process of establishing the mathematical model of Taylor’s formula is as follows.
If there exists a function f(x), and when f(x) is derivable at x0, then f(x) is constant in the neighborhood of x0, as presented in Eq. 8:
where o(x-x0) represents an infinitesimal quantity, in order to make the approximate substitution more precise, Taylor’s formula of order n (n ≥ 2) is generally used in analytical studies, as shown in Eq. 9, and n is referred to as the order of Taylor’s formula.
where x0 is the point with (n+1) order derivative contained in the interval (a, b) of the f(x).
The mathematical modeling process of Taylor’s formula based on the M''(ω) curve is as follows: let G(f) be the functional expression of the dielectric modulus curve M''(ω), and G(f) is continuous in the frequency domain (2 × 10⁻⁴ Hz to 5 × 10³ Hz) and conductible, satisfying the nth-order Taylor’s formula as follows.
where f0 lies in the frequency domain (2 × 10⁻⁴ Hz to 5 × 10³ Hz) and f0 can be any value in its interval. G(n)(f0) denotes the nth-order derivative of the function G(f) at f0 and G(n)(f0) is a constant. In order to facilitate the representation of Eq. 10, the constant symbol Λ(n) is introduced as shown in Eq. 11, and furthermore, since the value of the residual term Rn(f) is close to 0, Eq. 10 can then be simplified to Eq. 12.
In order to make the equation more concise and clearer, the constant Ωn is additionally introduced to denote Λ(n) and f0. Thus, the function G(f) can be written as Eq. 13 (Li et al., 2020).
The shape of the dielectric modulus curve M''(ω) varies under different moisture and aging states. As a result, the correlation coefficient Ωn obtained by Taylor’s formula changes with the values of moisture content mc% and degree of polymerization (DP). In order to clearly represent the imaginary part of the dielectric modulus curve, Eq. 13 can be written as Eq. 14:
The above analysis shows that Ωi (i = 0, 1, … , n) in Eq. 14 has a unique corresponding value in the face of M''(f) curves of different moisture and aging states. In other words, the coefficient Ωi (i = 0, 1, … , n) in the mathematical model of Taylor’s formula has a one-to-one mapping relationship with the corresponding moisture and aging state, so it can be used as a characteristic parameter to characterize the moisture and aging state of the oil-paper insulation, and Taylor’s formula can be used as a powerful tool to extract the characteristic parameter.
The classification principle of the K-NN algorithm is based on the core idea of the distance from the sample point to the nearest neighbor point to be identified (Rouhafzay and Cretu, 2020). Considering that the characteristic parameters φ(mc%, DP) encapsulate both moisture and aging information of the sample, the set of m characteristic parameters φ is denoted as the sample point x. This representation can be expressed using Eq. 15.
The Euclidean distance, denoted as d(x, xk), represents the measure of distance between the test sample point x and its adjacent point xk, as shown in Eq. 16.
The similarity λk(x, xk) between x and xk is defined as the reciprocal of the distance d(x, xk), as illustrated in Eq. 17. In the weighted K-NN algorithm, the weight value is determined by selecting the distances of the K nearest points surrounding the sample points. The weight of the adjacent point wk is represented by Eq. 18.
Given that the sample points of the p-type are denoted as vp, and the total number of categories for the sample points is c, the discriminant function for identifying the x point is expressed by Eq. 19.
In this equation, N represents the number of sample points for the p-type, kp denotes the sum of weights for points in the p-class, and yk is the discriminant parameter used to determine whether xk is an adjacent point of x, as indicated in Eq. 20.
Once Eq. 21 is satisfied, it signifies that the unrecognized point x belongs to the category vp.
In this paper, the insulating pressboard with a diameter of 140 mm and a thickness of 0.5 mm and Karamay No. 25 mineral insulating oil are used to prepare the test sample of the bushing. The specific performance parameters of the insulating pressboard and insulating oil are shown in Tables 1, 2, respectively. Firstly, dry the insulation paper and insulation oil separately in a vacuum immersion tank for 48 h (105°C 50 Pa). Then put the dried insulation paper into the dried insulation oil for 48 h (70°C 50Pa). Finally, seal the dried oil immersion paper insulation for future experimental use. The experimental pre-treatment process is shown in Figure 1. It is worth mentioning that when conducting aging experiments, moisture intrusion experiments, and dielectric response tests on oil-immersed paper bushings, oil-immersed insulation paper is usually used instead of the actual bushing, which has the advantages of material saving, time-saving, easy operation, and strong repeatability.
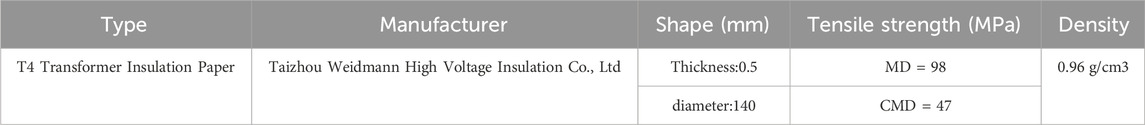
TABLE 1. Parameters of insulating pressboard.

TABLE 2. Parameters of insulating oil.
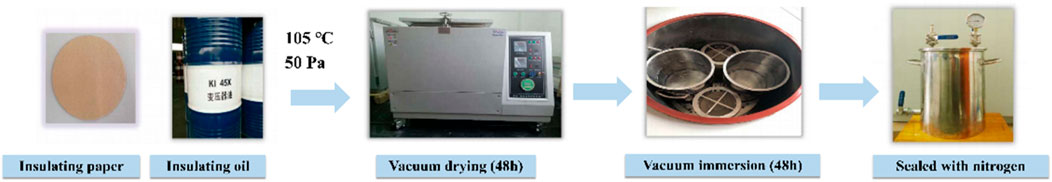
FIGURE 1. Flow chart of experimental material pretreatment.
After the pretreated experiments, the aging tests were conducted on the pretreated oil-immersed insulating pressboard samples. Firstly, group the preprocessed insulating pressboard according to the expected aging days, number it, and place it in an aging box for aging. The temperature of the aging box is set to 150°C. The temperature only affects the aging rate of the insulation paper, without affecting the aging products and principles. Therefore, to quickly obtain samples, using 150°C as the aging temperature is a relatively time-saving and reasonable choice. Prepare insulation paper with aging days of 0, 1, 3, 7, and 15 days, and store it. Randomly select one sample from each group of insulated pressboard samples with different aging degrees, and the DP test results are shown in Table 3. Due to the identical aging conditions of each group of samples, it is believed that the DP value of this sample can characterize the aging degree of all insulating pressboards under the same aging conditions.
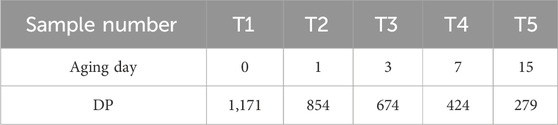
TABLE 3. Polymerization degree values of oil-immersed insulating cardboard samples.
On the basis of aging experiments, conduct moisture intrusion experiments on oil-immersed insulating pressboard samples. Firstly, use a Karl Fischer tester for initial moisture detection, and record its moisture content as a%. At this point, it is assumed that the initial moisture content of all insulating pressboards is a%. Group and number the insulating pressboard that needs to undergo moisture testing. Place the divided insulating pressboard with an initial moisture content of a% into a precision electronic balance, record its initial mass as m, and then expose the pressboard to air for natural moisture absorption. By controlling different moisture absorption times, obtain a pressboard with different moisture content (mc%). If the planned moisture content inside the pressboard needs to reach b%, then the measurement value of the electronic balance will reach (1-a%)/(1-b%) and seal the pressboard in an aging jar at a constant temperature of 45°C for 48 h to ensure uniform distribution of moisture inside the pressboard. A total of 20 sets of oil-immersed insulation paper samples were prepared, as illustrated in Figure 2.
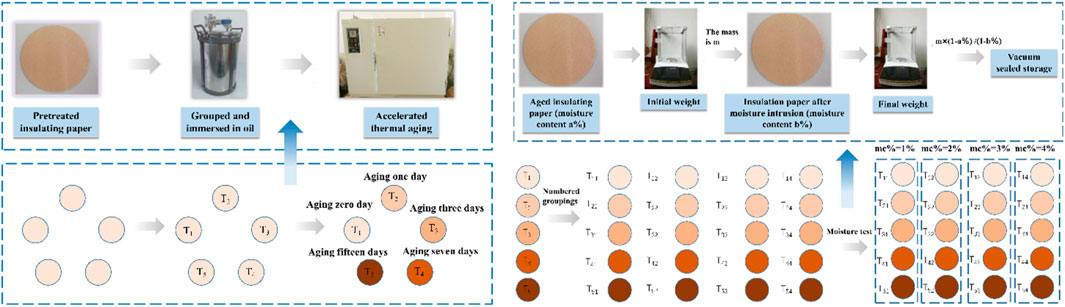
FIGURE 2. Flow chart of aging and damping experiments.
According to the report in (Sumereder and Muhr, 2010), the average DP of newly manufactured dry insulating pressboard is generally between 1,000 and 1,250, and as the aging degree increases, the DP gradually decreases. The existing standard DL/T 984-2005 (DL/, 2005) requires that when the DP of insulation paper is less than 250, it is the end of its lifespan, and it can be considered that its insulation performance has completely deteriorated and no longer meets the insulation requirements. Therefore, within the DP range where the insulating pressboard has insulation properties (250 ≤ DP ≤ 1,250), DP can be divided into five parts, representing five different levels of aging, as shown in Figure 3.
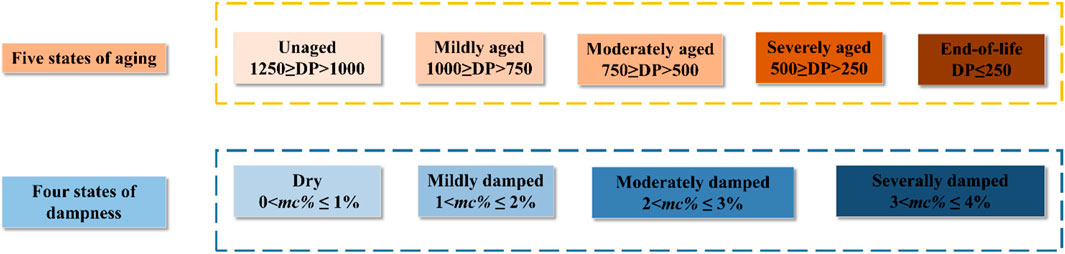
FIGURE 3. Insulation state division.
In addition, the technical report published by CIGRE (International Conference on the Great Power Grid) states that when the moisture content of the insulating pressboard is 0%<mc%≤ 1%, it is considered dry; When the moisture content of the insulating cardboard is 1%< mc%≤ 2%, it is considered that the insulating cardboard has been affected by moisture. According to the IEEE standard, a damp insulated pressboard is divided into two stages: moderate moisture and severe moisture. This article believes that when the moisture content of the insulated pressboard is (2%< mc%≤ 3%), it is considered that the insulated pressboard has been moderately damp; When the moisture content of the insulating pressboard is (mc%>3%), it is considered that the insulating pressboard has been heavily damped, as shown in Figure 3. In summary, the oil-immersed insulating pressboard prepared in this article with different levels of moisture and aging will be divided into 20 different states, as shown in Table 4.
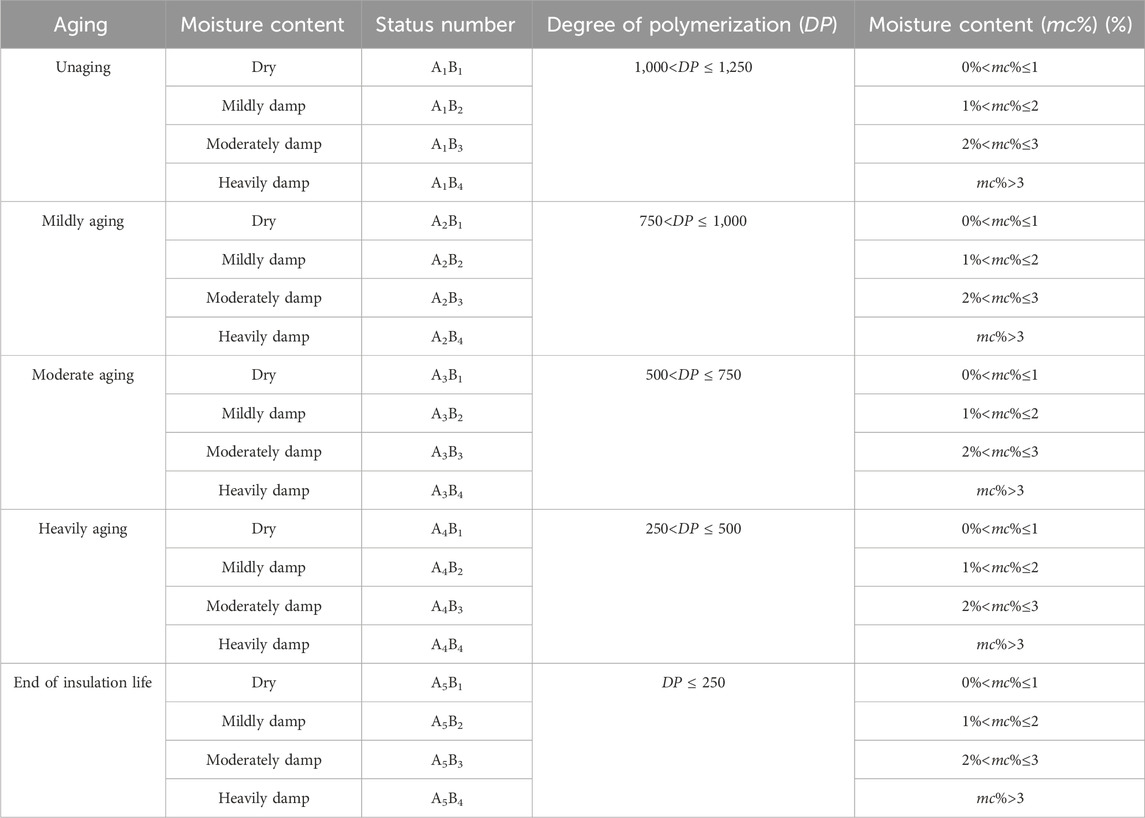
TABLE 4. Classification of moisture and aging conditions of insulated pressboard.
In this paper, a DIRANA dielectric response tester and a three-electrode test cell are used to set up a frequency domain dielectric response test platform, the output and test terminals of DIRANA are connected on both sides of the insulating pressboard, respectively. The test frequency ranged from 2 × 10⁻⁴ to 5 × 10³ Hz, and the test voltage was set to 200 V AC. Then the FDS tests are performed on insulating paperboards in different aging and moisture states at 45°C, to obtain the real part ε′(ω) and the imaginary part of the ε''(ω) of the complex relative permittivity, and then the inverse of the complex permittivity is taken to obtain the real part of the dielectric modulus M′(ω) and the imaginary part of the permittivity modulus M''(ω).
FDS tests were performed on samples with different moisture levels under the same aging degree conditions and the corresponding dielectric modulus graphs were obtained (shown in Figure 4). Under the same aging level, the change of moisture content of oil-impregnated insulating paperboard will have an effect on M′(ω) in the low and middle-frequency regions, while the high-frequency region (102 Hz∼104 Hz) is almost unaffected. Comparing oil-impregnated paperboards with the same degree of aging, an increase in the water content of the paperboard leads to a decrease in the value of M′(ω) in the low-frequency region of the M′(ω) curves, while the M′(ω) curves in the high-frequency region are essentially unchanged under any water content condition. In addition, unlike the imaginary part of the complex relative permittivity, the value of the imaginary part of the dielectric modulus M''(ω), increases with increasing frequency in the low-frequency region (10–4 Hz–10–1 Hz).
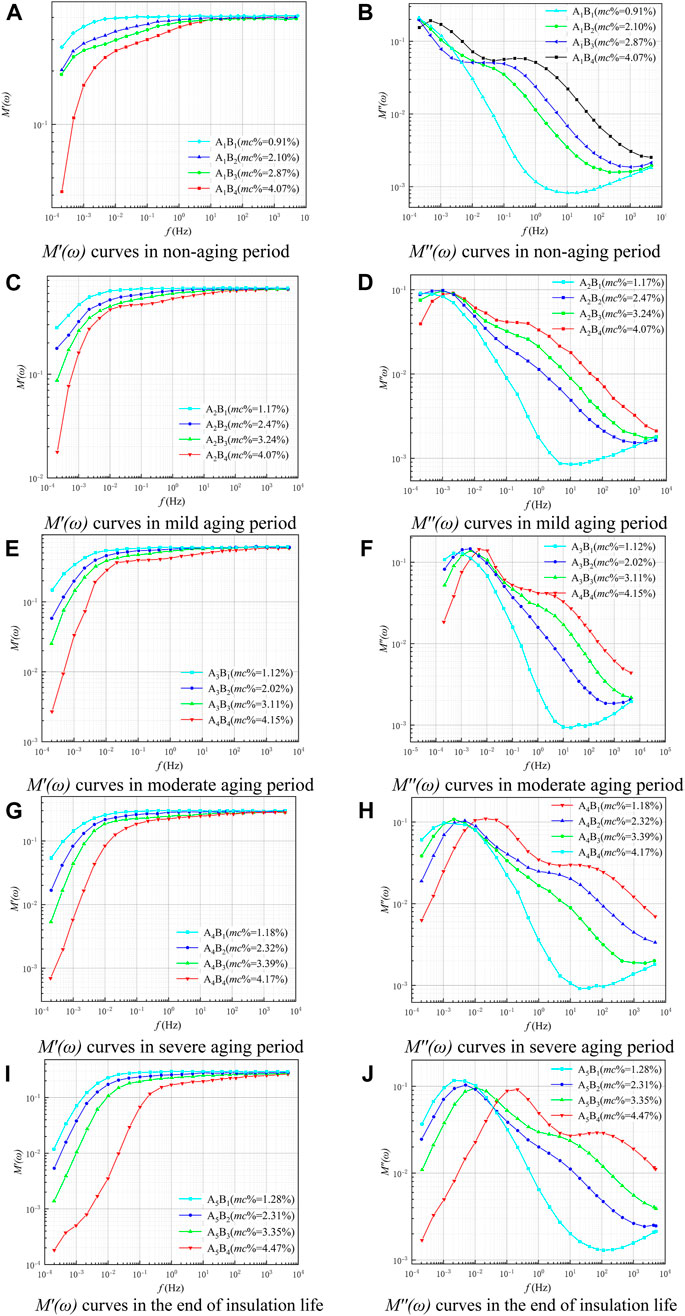
FIGURE 4. M′(ω) and M''(ω) curves in different aging periods.(A) M′(ω) curves in non-aging period. (B) M''(ω) curves in non-aging period. (C) M′(ω) curves in mild aging period. (D) M''(ω) curves in mild aging period. (E) M′(ω) curves in moderate aging period. (F) M''(ω) curves in moderate aging period. (G) M′(ω) curves in severe aging period. (H) M''(ω) curves in severe aging period. (I) M′(ω) curves in the end of insulation life. (J) M''(ω) curves in the end of insulation life.
The Taylor’s formula mathematical model based on Eq. 14 is used to extract the relevant characteristic coefficients of the curve. It is worth noting that the error of the extracted parameters depends on the size of the n value in Eq. 14: the larger the value of n, the better the resulting Taylor’s formula fitting curve fits the original data, and the smaller the error of the obtained parameters. However, a larger value of n will lead to an increase in computational time. Therefore, this paper selected the imaginary curves of the dielectric modulus of four samples (A5B1, A5B2, A5B3, A5B4) at the end-of-life stage of the insulation in the moisture condition to calculate the R2 corresponding to different values of n (n = 5, 6, 7, 8), and then analyze the effect of different values of n on the extraction of the feature parameter in detail.
When n = 7 and n = 8, it is observed that the measured values of dielectric modulus for the four different degrees of moisture are almost completely overlapped with the corresponding fitted curves, and the R2 shown in Table 5 are higher than 0.99, which satisfies the fitting requirements. Therefore, through in-depth comparative analysis, this paper selects Taylor’s formula at n = 7, shown in Eq. 22, to extract the characteristic coefficients of the dielectric modulus.
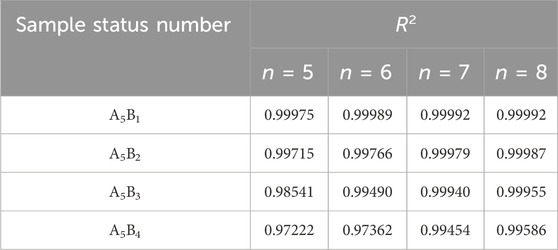
TABLE 5. Comparison of fitting degree R2.
By determining the values of the coefficients Ω0∼Ω7 in Eq. 22, Taylor’s formula for the approximate replacement of the imaginary part of the dielectric modulus is obtained. Different moisture and aging states will obtain unique corresponding sets of parameters (Ω0∼Ω7), and conversely, each different set of parameters (Ω0∼Ω7) can only characterize unique moisture and aging states. The extracted parameters are shown in Table 6.

TABLE 6. Results of feature parameter extraction.
Due to the time-consuming preparation cycle of the experiment, there are high requirements for the measurement and preservation of the samples. Therefore, it is difficult to construct a database of dielectric modulus parameters based on laboratory-prepared samples. To overcome the above difficulties, this paper finds that there is a quantitative relationship between the dielectric modulus characteristic parameters Ω0∼Ω7 and mc%, as shown in Figure 5. The fitting results show that the fitting degree R2 of each curve reaches above 0.9, thus effectively establishing a mapping relationship between the moisture content mc% and the characteristic parameters Ω0∼Ω7.
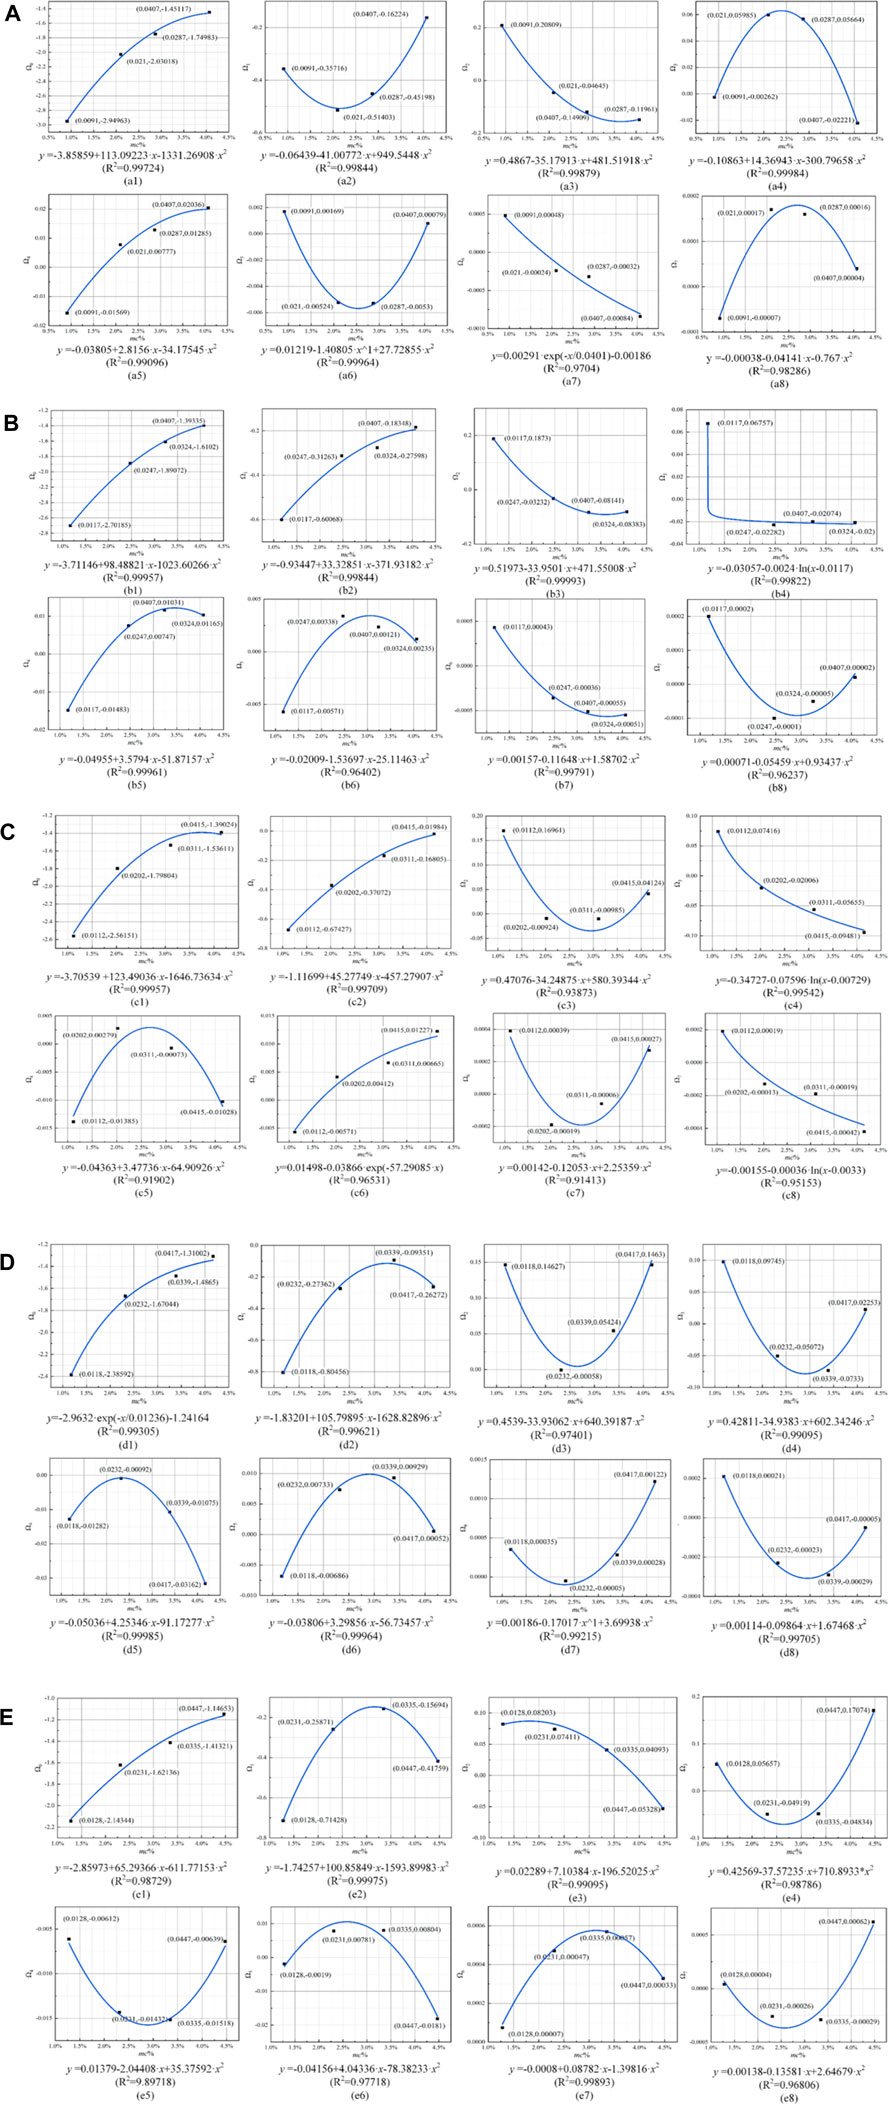
FIGURE 5. Fitting curves of characteristic parameters of dielectric modulus: (A) unaged; (B) mildly; aged (C) moderate aging; (D) severe aged; (E) end-of-life.
Therefore, based on the curve fitting method, more than 1,000 sets of dielectric modulus parameters of five aging states (unaged, mild aging, moderate aging, severe aging, and insulation life termination) and four moisture states (dry, mild damped, moderate damped, and severe damped) are obtained to construct the parameter database.
In this paper, three bushings retired from a 110 kV substation of China Southern Power Grid Company are selected for moisture and aging condition assessment to verify the effectiveness and feasibility of the proposed assessment method. The test equipment is a DIRANA dielectric response tester manufactured by OMICRON company. The Output terminal of DIRANA (high-voltage electrode) is connected to the terminal of the casing; the CH1 terminal (low-voltage electrode) is connected to the measurement terminal of the casing; in order to ensure the safety and reliability of the measurements, it is required that the shell of DIRANA and casing is well grounded.
The test bushing was named bushing 1, bushing 2, and bushing 3. The details of the three bushings are shown in Table 7 and the frequency domain dielectric response test results are shown in Figure 6. After the FDS test, it was disassembled and subjected to moisture measurements and DP measurements to obtain its true moisture and aging status.
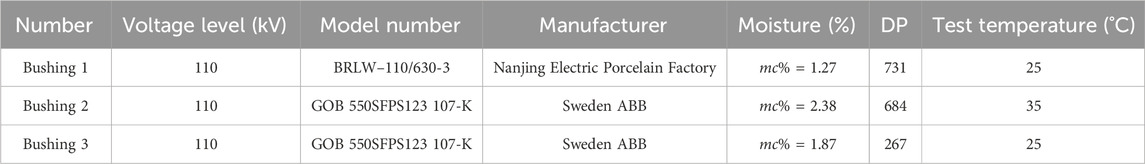
TABLE 7. Details of bushing to be tested.
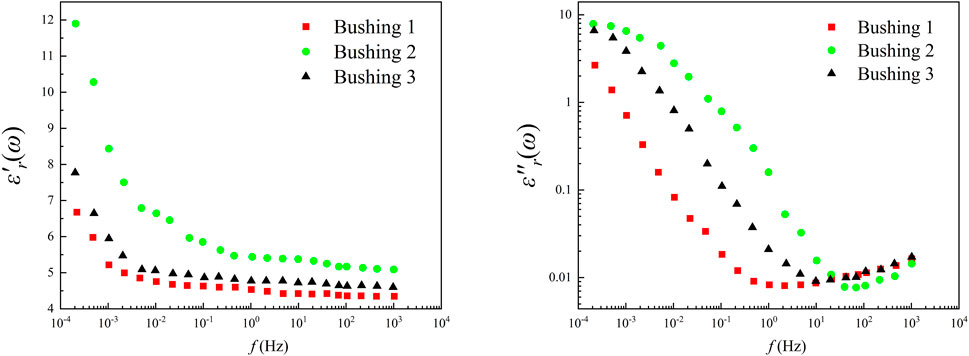
FIGURE 6. The ε′(ω) and ε''(ω) curves of bushing to be tested.
Due to the limitation of the measurement conditions, the frequency range of the field test is f∈(1 × 10⁻⁴ Hz to 1 × 10³ Hz), as shown in Figure 6. Compared with the FDS test results under laboratory conditions, the field test is missing part of the test data in the high-frequency region (1 × 10³ Hz to 5 × 10³ Hz). Therefore, in order to investigate whether the extracted dielectric modulus parameters under the partially missing data condition will generate errors and thus lead to assessment failure, the following discussion is carried out in this paper:
Taking the dielectric modulus M''(ω) curves for the lightly damped and heavily aged condition (mc% = 2.32%, DP = 424) and the heavily damped and lightly aged condition (mc% = 4.07%, DP = 854) as an example, the M''(ω) curves for the complete and partially data missing conditions M''(ω) curves are shown. M''(ω) curves are shown in Figure 7 below.
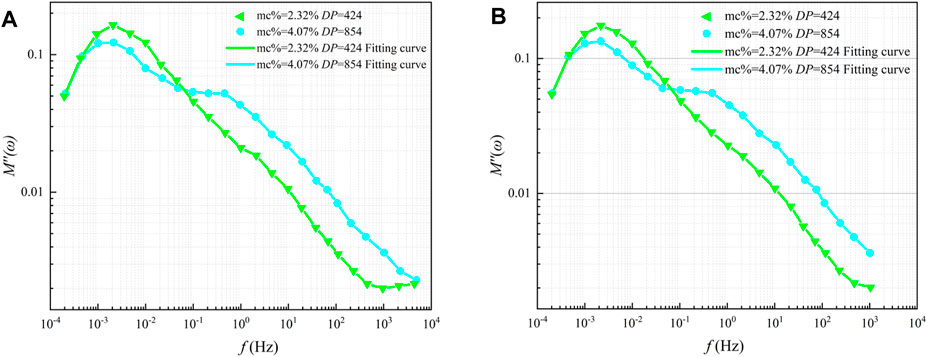
FIGURE 7. (A) M''(ω) curves with original data; (B) M''(ω) curves with reducing partial data.
FDS test results are very sensitive to temperature changes, and changes in the test temperature can result in changes in the test results. Therefore, it is necessary to correct the temperature of the test results of the field bushing. In this paper, the “frequency shift factor” technique is used to obtain the “frequency shift factor” α(T) of each FDS curve by using Eq. 23. Then, by multiplying the measurement frequency by the “frequency shift factor” α(T), as shown in Eq. 24, the sampling frequency at the reference temperature is obtained, and then the FDS curve at the reference temperature is obtained.
where Tref and Tt represent the reference and test temperatures, respectively. ft and fref denote the test and reference frequencies, respectively. Ea represents the activation energy of the oil-impregnated cellulose, which is generally considered to be Ea = 103 kJ/mol and R is the gas constant, R = 8.314 J/mol/K.
Since the FDS test was performed in this paper at a constant laboratory ambient temperature of 45°C (318.15 K), the reference temperature Tref = 318.15 K in Eq. 23, while the test temperatures of bushing 1, bushing 2, and bushing 3 were25°C, 35°C, and 25°C, respectively. Therefore, the test temperatures in Eq. 23 were sequentially set to 298.15, 308.15, and 298.15 K, and the α(T) of bushing 1, bushing 2, and bushing 3 were obtained to be 13.6277, 3.5384, and 13.6277, respectively. Subsequently, based on Eq. 24, the temperature-corrected ε′(ω) and ε''(ω) curves and M′(ω) and M''(ω) curves, as shown in Figure 8.
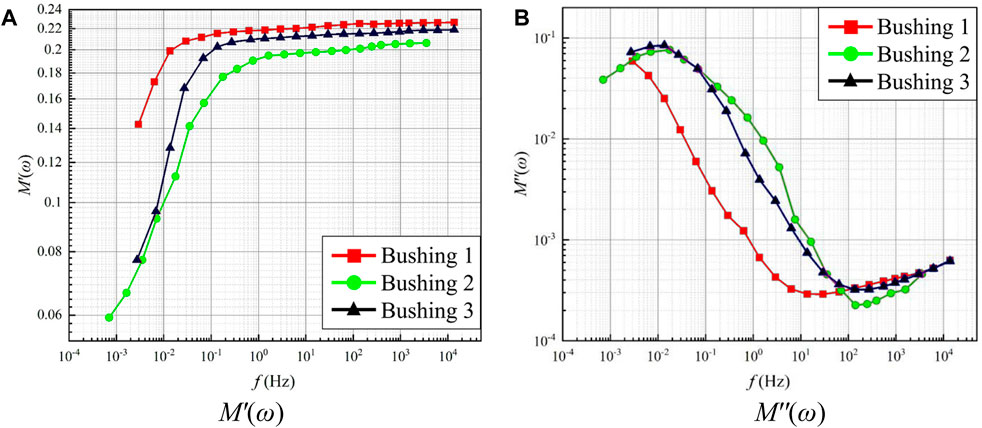
FIGURE 8. FDS curves after temperature correction. (A) M′(ω). (B) M''(ω).
After the temperature correction of the field bushing of the unknown state, this paper will use Eq. 22 to extract the characteristic parameters of its dielectric modulus M''(ω) curves, followed by the moisture and aging state assessment.
Equation 22 is used to extract the characteristic parameters from the temperature-corrected dielectric modulus M''(ω) curve, and then the characteristic parameters are used to assess the moisture and aging state. As shown in Figure 9, the fitted curves based on Eq. 22 almost coincide with the test data points, and the characteristic parameters Ωi (i = 0, 1, … ,7) and the corresponding fit degrees contained in the three bushings are listed in Table 8. The R2 exceeds 0.998, which verifies the validity and reliability of the mathematical model of Taylor’s formula, and these characteristic parameters can be used to assess the moisture and aging status of the bushings in the field.
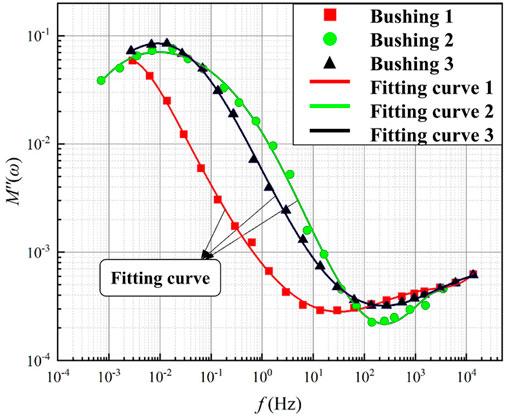
FIGURE 9. Fitting curves of bushing to be tested.
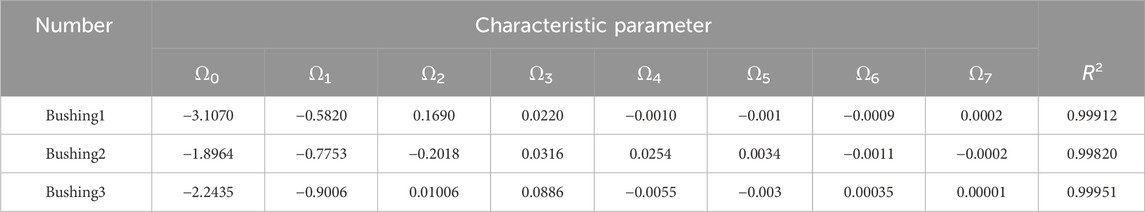
TABLE 8. Characteristic parameters extracted from the three bushings.
In this paper, 10 samples with the closest distance to the samples to be tested are selected in the training sample set (K = 10). Subsequently, the training sample set is established on top of the dielectric modulus feature parameter database, while the field bushing extracts the feature parameter as the samples to be tested, and finally, the K-NN classification algorithm is applied to evaluate the moisture and aging states of the field bushings. The evaluation results are shown in Table 9 and its confusion matrix is shown in Figure 10.
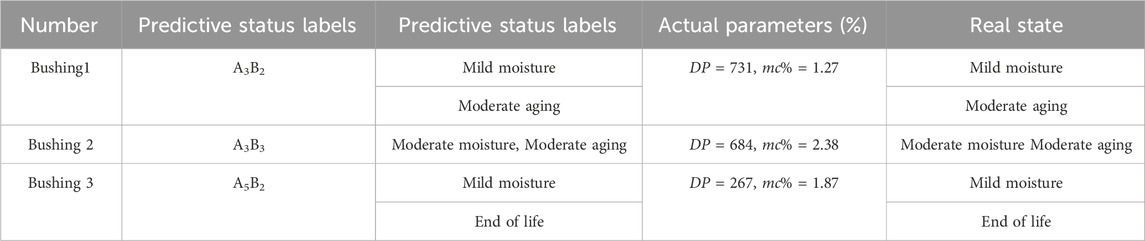
TABLE 9. Evaluation results of moisture and aging state of field bushings.
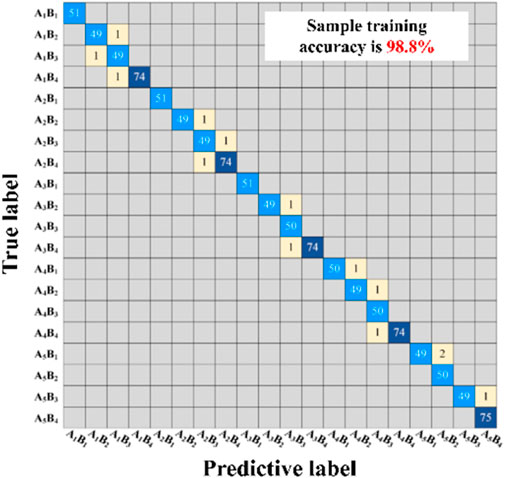
FIGURE 10. Classification result of the weighted K-NN model.
From the evaluation results of the K-NN classification algorithm obtained in Table 9, it can be seen that the predicted results for bushing 1 and bushing 2 agree with the actual results. The predicted result for bushing 3 is mild moisture and insulation life termination (DP ≤ 250, 1%≤mc%<2%), however, in fact, the actual moisture content mc% and DP values of bushing 3 are 1.87% and 267, respectively. and the real state is mild damp and heavy aging. The evaluation method produces an error in the assessment of the aging state of bushing 3. The real aging state of bushing 3 is heavy aging. However, the difference between the real DP value and the assessment result is only 17, and the reasons for the error may be as follows:
Firstly, when the DP measurement of bushing 3 is carried out, the sampling of the oil-impregnated insulation paper of the capacitor core may be concentrated in certain places, which cannot fully reflect the overall aging state of the bushing. Secondly, the DP measurement device is a high-precision instrument, and factors such as changes in the temperature of the testing environment and the quality of the test sample can affect the results of the DP test. Thirdly, it is generally believed that when DP drops to about 200, it no longer undergoes significant changes. Therefore, the insulating paper of the bushing may have reached the threshold value, and DP no longer decreases with the increase of aging time.
In summary, although the method proposed in this paper produces an error in the assessment of the aging state of field bushing 3, it is considered that the error is not caused by the defects of the model itself through the above analysis, and therefore, the prediction method of moisture and aging state of oil-impregnated paper bushing based on the K-NN classification algorithm proposed in this article can be used to effectively assess the bushing in the field and has a high degree of accuracy.
The dielectric modulus characteristic parameter proposed in this article is independent of insulation dimensions, and it is only related to the aging state and moisture content of oil-impregnated insulation paper. Therefore, the method proposed in this article is applicable to bushings of any voltage level, and the assessment process for on-site bushings is as follows: 1) Measure the internal temperature of the on-site bushing. 2) Use a dielectric response analyzer to perform FDS testing on the on-site bushing to obtain the complex relative permittivity curve at that temperature. 3) Convert the complex relative permittivity curve at the testing temperature to the complex relative permittivity curve at 45°C using the temperature-frequency factor. 4) Convert the complex relative permittivity curve to the dielectric modulus curve using the dielectric modulus model. 5) Extract characteristic parameters from the dielectric modulus curve using the Taylor formula mathematical model. 6) Based on the extracted characteristic parameters, assess the aging and moisture status of the bushing using the K-NN classification algorithm.
Other algorithms (Support Vector Machine, Naive Bayes, and Decision Tree) were used to assess the state of the three field bushings respectively. Comparing the assessment results of the four classification algorithms in Table 10, it can be found that the K-NN classification algorithm is the most accurate. the SVM algorithm produces an error in assessing the aging state of bushing 2 and bushing 3. The NB algorithm produces an error in assessing the dampness and aging state of casing 2. The NB algorithm produced errors for both moisture and aging of bushing 2. In addition, the DT algorithm produced large errors in the moisture and aging assessment of bushing 2. The evaluation accuracy was obtained according to Eq. 25.
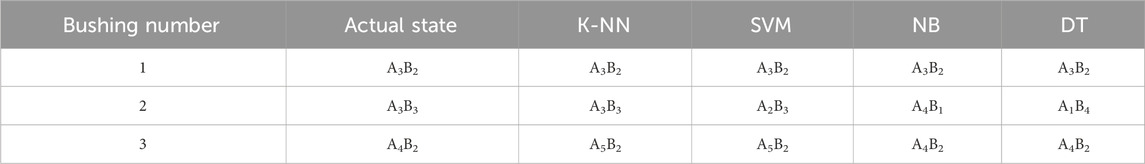
TABLE 10. Evaluation results of four classification algorithms.
Based on Eq. 25, the evaluation accuracy of the four classification algorithms is calculated. Among them, the assessment accuracy of the SVM method, NB method, and DT method is 66.67%, while the assessment accuracy of the K-NN method is 83.33%, which is higher than the other three algorithms. The above evaluation results verify the effectiveness and feasibility of the evaluation scheme proposed in this paper.
In addition, the confusion matrix Figure 11 shows that the sample training accuracy of the SVM algorithm, NB algorithm, and decision tree algorithm are 95.8%, 88.1%, and 95.6%, respectively, which are lower than that of the K-NN algorithm’s sample training accuracy of 98.8%. Therefore, the assessment method of the K-NN algorithm has the highest accuracy.
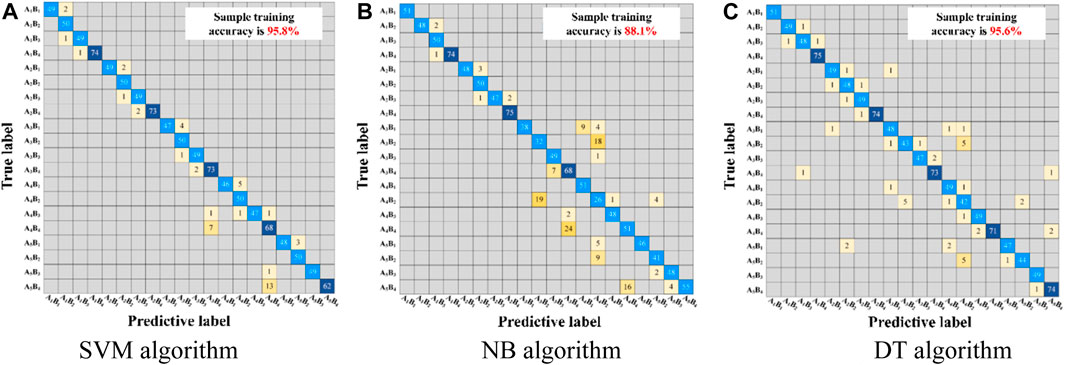
FIGURE 11. Confusion matrix of the other algorithms. (A) SVM algorithm. (B) NB algorithm. (C) DT algorithm.
The innovation of this article lies in establishing a Taylor formula mathematical model to extract characteristic parameters for characterizing the aging and moisture degree of insulation paper from the dielectric modulus M*(ω) curve of oil-immersed paper bushings and obtaining fitting relationships between various characteristic parameters and insulation degradation status. Then, the KNN classification algorithm was used to evaluate the aging and moisture status of insulation paper for bushings. The main results achieved in the thesis are as follows:
(1) A mathematical model of dielectric modulus is established, and the effects of moisture and aging on the dielectric modulus curve are analyzed in depth, and it is found that the M''(ω) curve can better distinguish the effects of aging and moisture, and the low-frequency region of the M''(ω) curve characterizes the aging state of insulation paper. The aging information characterized by the low-frequency region of the M''(ω) curve and the moisture information characterized by the high-frequency region of the M''(ω) curve do not interfere with each other, which proves that the dielectric modulus can be used as a powerful tool for the assessment of the moisture and aging state of the oil-paper insulation.
(2) The mathematical model of Taylor’s formula is established, and it is proved that each coefficient Ωi (i = 0, 1, … , n) of Taylor’s formula can be used as the characteristic parameter for state evaluation. In addition, the influence of the order n of Taylor’s formula on the value of the extracted parameters is investigated, and the results show that a small n will affect the accuracy of the parameters, and a large n will affect the complexity of the calculation. Subsequently, the extraction of the characteristic parameters (Ω0∼Ω7) of the dielectric modulus curves was realized on the basis of n = 7, and the results showed that the goodness-of-fit R2 of the characteristic parameters (Ω0∼Ω7) to mc% was more than 0.9, which had high reliability.
(3) A comprehensive assessment method for the moisture and aging state of bushing oil-paper insulation based on the K-NN algorithm is proposed. By applying this method to assess the moisture and aging state of three field bushings, the results show that the assessment method based on the K-NN algorithm achieves a training accuracy of 98.8% for the samples, and the accuracy of the assessment results reaches more than 83%, which has an obvious advantage compared with other classification algorithms (Support Vector Machine, Naive Bayes, and Decision Tree).
This research has not only made theoretical contributions but can also serve as a methodological foundation for practical engineering applications.
The original contributions presented in the study are included in the article/Supplementary Material, further inquiries can be directed to the corresponding authors.
ZL: Investigation, Writing–review and editing. YS: Validation, Writing–original draft. HC: Data curation, Writing–original draft. NZ: Data curation, Writing–original draft. BL: Formal Analysis, Writing–review and editing. YL: Validation, Writing–original draft. YF: Investigation, Writing–original draft. YZ: Conceptualization, Writing–review and editing.
The authors declare financial support was received for the research, authorship, and/or publication of this article. This work was financially supported by North China Power Engineering Co., Ltd. of China Power Engineering Consulting Group under Grant number JBGS 2023-01.
Authors ZL, YS, HC, NZ, YL, and YF were employed by North China Power Engineering Co., Ltd. of China Power Engineering Consulting Group.
The remaining authors declare that the research was conducted in the absence of any commercial or financial relationships that could be construed as a potential conflict of interest.
All claims expressed in this article are solely those of the authors and do not necessarily represent those of their affiliated organizations, or those of the publisher, the editors and the reviewers. Any product that may be evaluated in this article, or claim that may be made by its manufacturer, is not guaranteed or endorsed by the publisher.
Akbari, M., Mostafaei, M., and Rezaei-Zare, A. (2023). Estimation of hot-spot heating in OIP transformer bushings due to geomagnetically induced current. IEEE Trans. Power Deliv. 38 (2), 1277–1285. doi:10.1109/tpwrd.2022.3212322
Bouaicha, A., Fofana, I., Farzaneh, M., Setayeshmehr, A., Borsi, H., Gockenbach, E., et al. (2009). Dielectric spectroscopy techniques as quality control tool: a feasibility study. IEEE Electr. Insul. Mag. 25 (1), 6–14. doi:10.1109/mei.2009.4795464
Buchacz, J., Cichón, A., and Skubis, J. (2017). Detection of conductive layers short circuit in HV condenser bushings using frequency domain spectroscopy. IEEE Trans. Dielectr. Electr. Insulation 24 (1), 552–558. doi:10.1109/tdei.2016.005933
Choi, K., Singh, S., Kodali, A., Pattipati, K., Sheppard, J., Namburu, S., et al. (2009). Novel classifier fusion approaches for fault diagnosis in automotive systems. IEEE Trans. Instrum. Meas. 58 (3), 602–611. doi:10.1109/tim.2008.2004340
Fan, X., Liu, J., Lai, B., Zhang, Y., and Zhang, C. (2021). FDS measurement-based moisture estimation model for transformer oil-paper insulation including the aging effect. IEEE Trans. Instrum. Meas. 70, 1–10. doi:10.1109/tim.2021.3070622
Fofana, I., and Hadjadj, Y. (2016). Electrical-based diagnostic techniques for assessing insulation condition in aged transformers. Energies 9 (9), 679. doi:10.3390/en9090679
Islam, M. M., Lee, G., Hettiwatte, S. N., and Williams, K. (2018). Calculating a health index for power transformers using a subsystem-based GRNN approach. IEEE Trans. Power Deliv. 33 (4), 1903–1912. doi:10.1109/tpwrd.2017.2770166
Jadav, R. B., Ekanayake, C., and Saha, T. K. (2014). Understanding the impact of moisture and ageing of transformer insulation on frequency domain spectroscopy. IEEE Trans. Dielectr. Electr. Insul. 21 (1), 369–379. doi:10.1109/tdei.2013.003984
Jyothi, N. S., and Ramu, T. S. (2012). A model for the temperature distribution in resin impregnated paper bushings. Asia-Pacific Power Energy Eng. Conf. (APPEEC), 1–4. doi:10.1109/APPEEC.2012.6307302
Li, S., Yang, L., Li, S., Zhu, Y., Cui, H., Yan, W., et al. (2020). Effect of AC-voltage harmonics on oil impregnated paper in transformer bushings. IEEE Trans. Dielectr. Electr. Insulation 27 (1), 26–32. doi:10.1109/tdei.2019.008247
Li, Y., Zhang, W., Li, H., Xu, Y., and Zhang, G. (2021). Aging assessment of oil-impregnated-paper electrical equipment via near-infrared spectroscopy powered by improved PCA-RBF-NN: modelling and field practices. IEEE Trans. Dielectr. Electr. Insulation 28 (6), 2035–2042. doi:10.1109/tdei.2021.009813
Liao, W., Zhou, L., Li, Z., Wang, D., Zhang, J., Cai, J., et al. (2021). An IGBA algorithm-based curve reconstruction method of frequency-domain dielectric spectroscopy for OIP bushing with nonuniform moisture distribution. IEEE Trans. Transp. Electrification 7 (4), 3194–3203. doi:10.1109/tte.2021.3069014
Liao, W., Zhou, L., Wang, D., Wang, A., Guo, L., and Cui, Y. (2020). A diagnostic method for moisture intrusion fault in OIP bushing. IEEE Trans. Instrum. Meas. 69 (9), 7072–7081. doi:10.1109/tim.2020.2976278
Linhjell, D., Lundgaard, L., and Gafvert, U. (2007). Dielectric response of mineral oil impregnated cellulose and the impact of aging. IEEE Trans. Dielectr. Electr. Insulation 14 (1), 156–169. doi:10.1109/tdei.2007.302884
Liu, J., Fan, X., Zhang, C., Lai, C. S., Zhang, Y., Zheng, H., et al. (2021). Moisture diagnosis of transformer oil-immersed insulation with intelligent technique and frequency-domain spectroscopy. IEEE Trans. Industrial Inf. 17 (7), 4624–4634. doi:10.1109/tii.2020.3014224
Liu, J., Fan, X., Zhang, Y., Li, S., and Jiao, J. (2020b). Frequency domain spectroscopy prediction of oil-immersed cellulose insulation under diverse temperature and moisture. IEEE Trans. Dielectr. Electr. Insulation 27 (6), 1820–1828. doi:10.1109/TDEI.2020.008813
Liu, J., Fan, X., Zhang, Y., Zheng, H., and Zhu, M. (2020a). Quantitative evaluation for moisture content of cellulose insulation material in paper/oil system based on frequency dielectric modulus technique. Cellulose 27, 2343–2356. doi:10.1007/s10570-019-02820-3
Netaworldjournal, (2018). IEEE guide for dielectric frequency response test. IEEE Stand. C57 161, 1–76. doi:10.1109/IEEESTD.2018.8571325
Poovamma, P. K., Ahmed, T., and Viswanatha, C., (2008). “Evaluation of transformer oil by Frequency domain technique,” in IEEE international conference on dielectric liquids (IEEE), 1–4.
Ren, G., Cheng, J., Zhou, Q., Li, C., and Wu, W., (2019). “The method for aging condition prediction of transformer oil-immersed cellulose insulation based upon the aging kinetic equation,” in 2nd International Conference on Electrical and Electronic Engineering (EEE 2019), 147–151.
Rouhafzay, G., and Cretu, A. M. (2020). Object recognition from haptic glance at visually salient locations. IEEE Trans. Instrum. Meas. 69 (3), 672–682. doi:10.1109/tim.2019.2905906
Saha, T. K., and Purkait, P. (2004). Investigation of polarization and depolarization current measurements for the assessment of oil-paper insulation of aged transformers. IEEE Trans. Dielectr. Electr. Insul. 11 (1), 144–154. doi:10.1109/tdei.2004.1266329
Su, Z., Zhang, Y., Du, Y., Su, Y., Deng, J., Goh, H. H., et al. (2023). An enhanced X model of oil-impregnated paper bushings including axial and radial nonuniform thermal aging. IEEE Trans. Dielectr. Electr. Insulation 30 (2), 825–833. doi:10.1109/tdei.2022.3228223
Sumereder, C., and Muhr, M. (2010). Moisture determination and degradation of solid insulation system of power transformers. IEEE Int. Symposium Electr. Insulation. IEEE, 1–4. doi:10.1109/ELINSL.2010.5549775
Teng, C., Ding, Y., Zhang, Y., Huang, M., and Zhan, Z. (2022). Investigation on distribution of electro-thermal coupling fields influenced by HVDC bushing insulation properties. Front. Energy Res. 10. doi:10.3389/fenrg.2022.1005470
Wang, D., Zhou, L., Dai, C., Guo, L., and Liao, W. (2019). Insulation defect diagnostic method for OIP bushing based on multiclass LS-SVM and cuckoo search. IEEE Trans. Instrum. Meas. 69 (1), 163–172. doi:10.1109/tim.2019.2895482
Xie, J., Dong, M., Hu, Y., Zhuang, T., Albarracin-Sanchez, R., and Rodriguez-Serna, J. M. (2019). Modeling oil-paper insulation frequency domain spectroscopy based on its microscopic dielectric processes. IEEE Trans. Dielectr. Electr. Insul. 26 (6), 1788–1796. doi:10.1109/tdei.2019.008155
Yang, L. J., Zou, T., Deng, B., Zhang, H., Mo, Y., and Peng, P. (2019). Assessment of oil-paper insulation aging using frequency domain spectroscopy and moisture equilibrium curves. IEEE Access 7, 45670–45678. doi:10.1109/access.2019.2906379
Zaengl, W. S. (2003). Dielectric spectroscopy in time and frequency domain for HV power equipment, Part I: theoretical considerations. IEEE Electr. Insul. Mag. 19 (5), 5–19. doi:10.1109/mei.2003.1238713
Zhang, M., Liu, J., Jia, H., Chen, Q., Lv, J., and Chen, X. (2019a). Modelling the low-frequency electrode dielectric response based on transformer equivalent oil-paper insulation model. IET Sci. Meas. Technol. 13 (5), 700–707. doi:10.1049/iet-smt.2018.5495
Zhang, M., Liu, J., Yin, M., Jia, H., and Lv, J. (2019b). Assessment on oil-paper insulation aging of transformer based on dielectric response model. Electr. Power Components Syst. 47 (13), 1145–1155. doi:10.1080/15325008.2019.1663454
Zhang, Y., Wei, H., Liao, R., Wang, Y., Yang, L., and Yan, C. (2017). A new support vector machine model based on improved imperialist competitive algorithm for fault diagnosis of oil-immersed transformers. J. Electr. Eng. Technol. 12 (2), 830–839. doi:10.5370/jeet.2017.12.2.830
Keywords: aging state, dielectric modulus, frequency domain spectroscopy (FDS), K-nearest neighbor algorithm, moisture content
Citation: Liang Z, Sun Y, Cheng H, Zhang N, Li B, Liu Y, Fang Y and Zhang Y (2024) A comprehensive evaluation method for moisture and aging state of oil-immersed paper bushings based on dielectric modulus and K-nearest neighbor algorithm. Front. Energy Res. 11:1348433. doi: 10.3389/fenrg.2023.1348433
Received: 02 December 2023; Accepted: 22 December 2023;
Published: 12 January 2024.
Edited by:
Bo Wang, Wuhan University, ChinaReviewed by:
Jun-Wei Zha, University of Science and Technology Beijing, ChinaCopyright © 2024 Liang, Sun, Cheng, Zhang, Li, Liu, Fang and Zhang. This is an open-access article distributed under the terms of the Creative Commons Attribution License (CC BY). The use, distribution or reproduction in other forums is permitted, provided the original author(s) and the copyright owner(s) are credited and that the original publication in this journal is cited, in accordance with accepted academic practice. No use, distribution or reproduction is permitted which does not comply with these terms.
*Correspondence: Zhengping Liang, enBsaWFuZzE4OEAxNjMuY29t; Yiyi Zhang, eWl5aXpoYW5nQGd4dS5lZHUuY24=
Disclaimer: All claims expressed in this article are solely those of the authors and do not necessarily represent those of their affiliated organizations, or those of the publisher, the editors and the reviewers. Any product that may be evaluated in this article or claim that may be made by its manufacturer is not guaranteed or endorsed by the publisher.
Research integrity at Frontiers
Learn more about the work of our research integrity team to safeguard the quality of each article we publish.