 Guangjian Zhang
 Xiufei Yang
 Yan Li
 Mingming Ge3
- 1Research Center of Fluid Machinery Engineering and Technology, Jiangsu University, Zhenjiang, China
- 2Wenling Fluid Machinery Technology Institute of Jiangsu University, Wenling, China
- 3Lab of AI for Fluids, Westlake University, Hangzhou, China
The wake flow of a circular cylinder is numerically investigated by Large Eddy Simulation (LES) combined with the Schnerr–Sauer cavitation model. By comparing entropy production in the presence or absence of cavitation, the energy loss distribution in the wake flow field of a cylinder is explored, shedding light on the interactions between multiscale vortex systems and cavitation. The comparative results reveal that, under non-cavitating conditions, the energy loss region in the near-wake area is more concentrated and relatively larger. Energy dissipation in the wake flow field occurs in regions characterized by very high velocity gradients, primarily near the upper and lower surfaces of the cylinder near the leading edge. The influence of cavitation bubbles on entropy production is predominantly observed in the trailing-edge region (W1) and the near-wake region (W2). The distribution trends of wall entropy production on the cylinder’s surface are generally consistent in both conditions, with wall entropy production primarily concentrated in regions exhibiting high velocity gradients.
1 Introduction
Cavitation is a phase transition process and a phenomenon that manifests in liquids due to fluid dynamic factors, occurring either within the liquid or at the liquid-solid interface (Arndt, 2012; Prosperetti, 2017; Tian et al., 2023). This process induces fluctuations in fluid pressure within the flow field (Lei et al., 2017; Lei et al., 2018), leading to an uneven distribution of surface loads on flow components (Sun et al., 2021) and the generation of hydrodynamic noise (Fry, 1984). In severe instances, cavitation can result in damage to flow components (Hutli et al., 2019; Sun et al., 2023), thereby impacting the operational stability of hydraulic machinery. Therefore, the operation and design of hydraulic machinery are influenced and constrained by cavitation, such as pumps (Li et al., 2018; Al-Obaidi, 2020; Li et al., 2021) and turbines (Khare and Prasad, 2021; Amromin, 2022; Sun et al., 2022). Hence, the research significance lies in the investigation of the distribution of energy loss induced by cavitation in the wake flow around a cylinder.
In the investigation of the wake flow around a cylinder, observations of cavitation bubble occurrences in the wake of a cylindrical body were conducted by Saito and Sato, (2003), utilizing static and high-speed cameras. The mechanisms of cavitation pulsation and scouring were explored from diverse perspectives, revealing that Karman vortex cavities, detaching downstream of the cylindrical body, can be segmented into distinct components. A pioneering and in-depth analysis of cavitation flow structures in the shear layer and wake of a cylindrical body was carried out by Kumar et al. (2017), employing high-speed photography. The findings concluded that cavities primarily originate in the free shear layer, displaying significant variations in cavitation activity span. Wang et al. (2021) studied the ventilated cavitating flow of a circular cylinder through numerical simulation. The simulation results indicate that the bubble size distribution in the wake is closely related to the turbulence intensity. Observations by Ghahramani et al. (2020), through experiments and numerical simulations, revealed that at high cavitation numbers, vortices detach cyclically, while at very low cavitation numbers, large stationary cavities form in the wake region. A transitional state is evident during the detachment process for moderate cavitation numbers. Cavitation flow on a cylindrical body under laminar (Reynolds number Re = 200) and turbulent (Re = 3,900) conditions within the cavitation number range (σ = 5 to 0.5) was investigated by Brandao et al. (2020). The study observed a transition from non-cavitation to cyclic and transitional cavitation states as the free-stream cavitation number decreased.
In the evolutionary dynamics of multiscale vortex systems within the wake flow field and their interactive processes with cavitation, a consistent manifestation of energy conversion is observed, contributing significantly to the intricacy of the vortex-cavitation flow field. To grasp the characteristics of the vortex-cavitation flow field and unveil the interactions between multiscale vortex systems and cavitation, a comprehensive understanding of energy distribution in the flow field is essential. Traditionally, the evaluation of total pressure loss obtained from Computational Fluid Dynamics (CFD) has been employed by many researchers to associate energy loss. However, this approach does not accurately pinpoint the precise locations of the losses. The reasons behind the reduction in available energy and the resulting entropy production during heat transfer and fluid flow processes were investigated by Bejan, (1996). Unsteady computations of entropy production rates within the laminar boundary layer in the wall region were conducted by Walsh and Hernon, (2006). Denton, (1993) proposed that entropy production serves as an effective means to explain energy losses in hydraulic machinery. This is attributed to the fact that specific entropy in-creases during the most authentic and irreversible adiabatic processes in hydraulic machinery, significantly contributing to energy losses (Zhang et al., 2020). A numerical model for estimating wall roughness based on entropy loss theory was proposed by Herwig et al. (2008), demonstrating the applicability of entropy production methods to both laminar and turbulent flows. Due to the unavailability of transient fluctuation variables in Computational Fluid Dynamics (CFD) computations, an enhanced model based on entropy production theory to assess entropy losses generated directly by dissipation was proposed by Herwig and Kock, (2007). Wang et al. (2020), building upon the previous cavitation entropy production diagnostic model, further considers the influence of mass transfer and slip velocity. Additional terms introduced include interfacial entropy and diffusion entropy in comparison to previous entropy production terms.
Utilizing the Large Eddy Simulation (LES) turbulent model and entropy production theory, numerical simulations and calculations of entropy production are con-ducted on the wake flow of a cylinder in this paper. Through a comparison of entropy production with and without cavitation models, the investigation delves into the energy distribution of cavitation phenomena in the wake flow field of a cylinder. Furthermore, the study explores the characteristics of the cavitation flow field and elucidates the interactions between multiscale vortex systems and cavitation. The objective of this approach is to attain a more profound comprehension of the mechanisms governing cavitation transformation.
2 Methodology
2.1 Governing equations
The cavitating flow involves liquid and vapor phases. In this work, the homogeneous mixture model was adopted, assuming the multiphase fluid components share the same velocity and pressure. The mass and momentum conservation equations for the mixture flow are shown as follows:
where
Solving the above unsteady Navier-Stokes equations directly raises an excessive demand on computing resources, which makes it impossible to be implemented in practical applications. Although Reynolds-Averaged Navier-Stokes (RANS) methods need reasonable computational cost, they fail in the situations dominated by coherent large-scale anisotropic vortical structures. Aiming at better simulating at an affordable cost, the LES approach was used, carrying out filtering in a small-space area, and dividing the turbulent flow into large-scale motion and small-scale motion. The large-scale motion is solved directly while the small-scale motion is modelled using the Smagorinsky-Lilly subgrid-scale model.
2.2 Cavitation model
The mass transfer between the vapor and liquid phases in cavitating flows is depicted using the following governing equation:
The source terms
where
2.3 Numerical setup
The computational model is shown in Figure 1. The cylinder diameter D is 9.5 mm, and the two-dimensional computational domain is 60D × 30D with an upstream dimension 10D and a downstream dimension 50D. The computational domain is discretized using structured grids, and the grids in the cylinder surface and wake region are locally refined. The total number of elements is about 336,000 and the average wall y + value is less than 4.6.
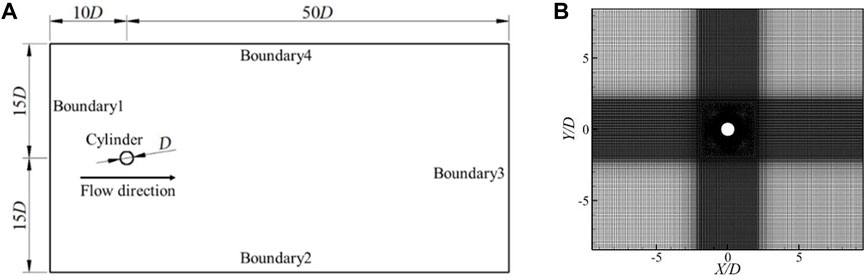
FIGURE 1. Computational model: (A) computational domain, (B) local grids.
Boundary 1 of the computational domain is set as a velocity inlet with a value
2.4 Entropy production method
Entropy production arises from irreversible processes, during which the conversion of mechanical energy into internal energy occurs, resulting in energy dissipation. Entropy, as a state parameter, is governed by an equilibrium equation in a single-phase, incompressible flow, which can be expressed as:
Kock and Herwig, (2004) proposed that the Reynolds-averaged process can be dissected into two components, namely the averaged and fluctuating components. By extending the traditional Reynolds-averaged process, they formulated the entropy balance equation as follows,
In the equation,
Given the negligible temperature change in the examined cylindrical flow phenomenon, this study excludes the consideration of entropy production during heat transfer. The direct solution method is utilized to compute the entropy production
The total entropy generation rate of the wall region is obtained by integrating over the wall region. Calculation formula for wall entropy generation:
Therefore, the total entropy production rate ψ inside the flow field is defined as follows:
The entropy production rate near the cylindrical wall surface is:
3 Results and discussion
3.1 Qualitative analysis of energy loss distribution in the wake flow field
The distribution of the entropy production rate and the dimensionless dynamic pressure in the wake flow field of a cylinder within a swirling flow is depicted in Figure 2. The dimensionless dynamic pressure is defined as follows:
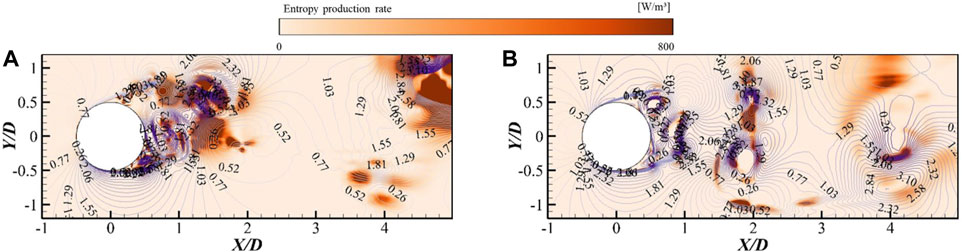
FIGURE 2. Entropy production rate and the distribution of dimensionless isobaric lines in the wake flow field. (A) Non-cavitating, (B) SS model (σ = 2.92).
The magnitude of the dimensionless dynamic pressure is representative of the fluid’s dynamic pressure in a specific region. The variation in color along isobars of nondimensional dynamic pressure demonstrates the dimensionless pressure drop in the flow field, with darker hues indicating more significant pressure drops.
In Figure 2A, in the non-cavitating case, energy losses in the vortex separation region near the upper and lower surfaces of the cylinder and in the wake region are revealed. The distribution trend of dimensionless dynamic pressure along the isobars is similar to that of the dimensionless pressure drop. In the region near the stagnation point at the leading edge of the cylinder, the obstructive effect of the cylinder results in lower fluid velocities, leading to a corresponding decrease in dynamic pressure at this location. From the stagnation point to the vicinity of the vortex shedding point on the cylinder surface, the flow separation caused by the acceleration and subsequent deceleration of flow due to the increasing flow velocity in this region results in a variation of dynamic pressure characterized by an initial increase followed by a decrease. In the near-wake region, as multiple-scale vortex structures detach and evolve, the pressure at the center of the vortices is relatively lower than the ambient pressure due to centrifugal forces. The velocity increases gradually from the vortex center to the vortex periphery, and the velocity gradient is significant. Consequently, the dimensionless isobars in the vicinity of the vortex periphery are densely distributed, with relatively higher dynamic pressure values. Upon comparison, it is evident that the regions of energy loss in the wake flow field around the cylinder are typically located in the low-pressure areas and their vicinity where the pressure drop is significant. In these regions, the dimensionless isobars are densely distributed, indicating a high velocity gradient in the flow field. Thus, the energy loss in the wake flow field of the cylinder in the non-cavitating model typically occurs in spatial ranges characterized by significant velocity gradients between the vortex center and its periphery.
Through comparative analysis, it is observed that under the non-cavitation model, energy losses in the wake flow field around the cylinder primarily manifest in low-pressure regions with significant pressure drops and their immediate surroundings. In these regions, a dense distribution of dimensionless dynamic pressure on equipotential lines is noted, indicating a notable velocity gradient in this flow area. Consequently, under the non-cavitation model, energy loss in the wake flow field around the cylinder typically occurs in spatial regions where a substantial velocity gradient exists between the center and the edge of the vortex.
In Figure 2B, it can be observed that the introduction of the SS cavitation model results in energy loss in the vortex separation region near the upper and lower surfaces of the cylinder, as well as in the wake region. Notably, the areas where energy loss occurs in the wake flow field are relatively dispersed, and the distribution area is comparatively small. The trend in the distribution of dimensionless dynamic pressure on equipotential lines generally aligns with that observed under the non-cavitation model.
Under the SS cavitation model, locations of energy loss in the wake flow field around the cylinder typically coincide with low-pressure regions experiencing substantial pressure drops. In these areas, a dense distribution of dimensionless dynamic pressure on equipotential lines is noted, indicating a significant velocity gradient in this flow region. Consequently, under the influence of the SS cavitation model, energy loss in the wake flow field around the cylinder generally occurs in spatial regions exhibiting a substantial velocity gradient between the center and the edge of the vortex.
When Figures 2A, B are compared, both display energy loss from the vortex separation region on the cylinder surface to the near-wake region. In contrast to the SS cavitation model, under the non-cavitation model, the energy loss region in the near-wake area is more concentrated, and the area is relatively larger. The primary reason for this difference lies in the generation of cavitation bubbles in the wake flow field when employing the SS cavitation model. These bubbles compress the upstream fluid, causing deceleration of the upstream flow and significant deformation of the detached multi-scale vortex system. Consequently, under non-cavitation model, the maximum dimensionless dynamic pressure in the wake flow field is higher than that under combined SS cavitation model conditions. Simultaneously, the compression of the multi-scale vortex system by the cavitation bubbles induces deformation and dispersion of the vortex system, resulting in a more scattered distribution of the regions experiencing energy loss in the wake flow field. However, in both conditions, energy loss in the wake flow field around the cylinder occurs in regions with a significant velocity gradient.
In Figure 3, under non-cavitation model conditions, the areas characterized by higher entropy production values in the wake flow field are larger when compared to those observed under the SS cavitation model. This distinction arises because, under non-cavitation model conditions, the multi-scale vortex system in the flow field remains relatively intact, featuring interactions solely between vortex systems. Consequently, the areas with significant changes in pressure gradient in the wake flow field, and hence higher entropy production values, are relatively larger, and there are nearly no points with exceptionally high entropy production.
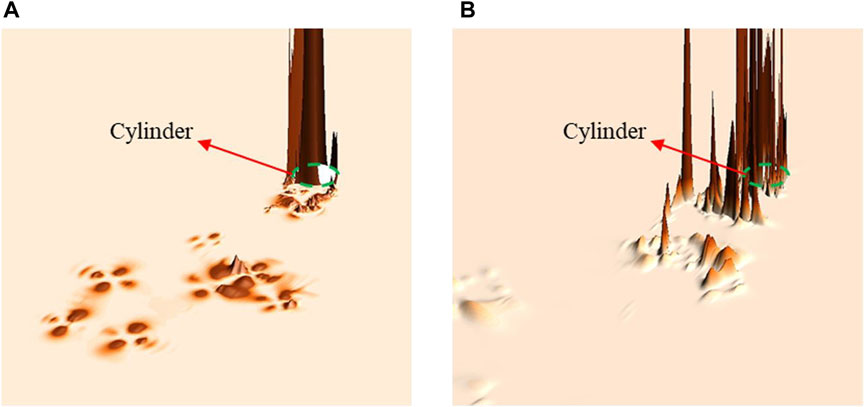
FIGURE 3. Locations of energy loss and the magnitude of entropy production values in the wake flow field. (A) Non-cavitating, (B) SS model (σ = 2.92).
Conversely, in the wake flow field under the combined SS cavitation model, the presence of cavitation bubbles results in the compression of the upstream fluid, inducing deceleration in the upstream flow. This leads to a reduction in velocity and velocity gradient within the boundary layer near the cylinder surface. Consequently, in the regions near the cylinder surface, most of the extreme points of entropy production are smaller than those observed under the non-cavitation model. Moreover, the generation of cavitation bubbles in the wake flow field compresses the multi-scale vortex system, causing significant deformation. The initially more concentrated vortices weaken in strength and disperse in the near-wake region due to the compression effect of the cavitation bubbles. This results in the emergence of some regions with significant changes in pressure gradient between interacting vortices, leading to localized extreme points of high entropy production.
3.2 Quantitative analysis of energy loss distribution in the wake flow field
For the facilitation of a quantitative analysis of energy loss in the near-wake flow field around a cylinder, the region is systematically divided into four zones: W0, W1, W2, and W3. These zones correspond to the leading-edge region, trailing-edge region, near-wake region, and far-field region of the wake flow field around the cylinder, as illustrated in Figure 4.
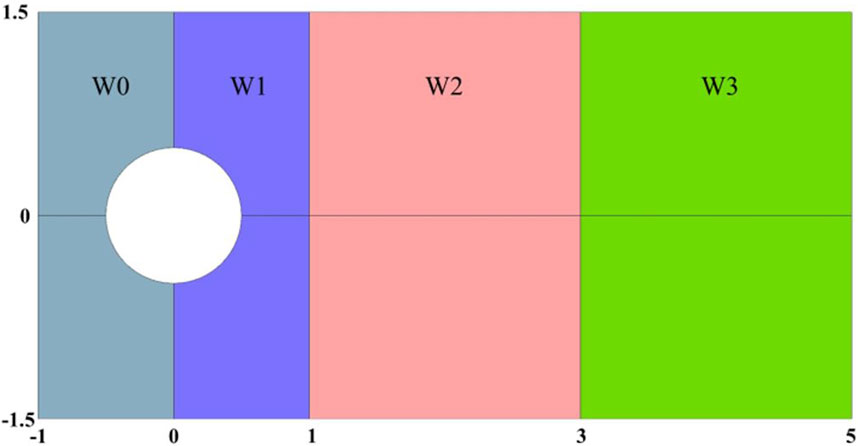
FIGURE 4. Diagram of the partitioned zones in the wake flow field.
By integrating entropy production rates in each region, the calculation of energy losses is conducted and summarized in Table 1. The results emphasize a significant disparity in total energy loss, with the leading-edge region exhibiting notably greater losses compared to the other three regions, both in the absence of cavitation and when the SS cavitation model is incorporated. Notably, the energy loss in the leading-edge region without cavitation slightly exceeds that with the SS cavitation model. In both operational conditions, energy loss locations in this region concentrate near the upper and lower surfaces of the cylinder’s leading edge. In contrast, entropy production in the wake flow region is notably smaller than those in the leading-edge region. Specifically, losses in the trailing-edge region, near-wake region, and far-field region are compared, as illustrated in Figure 5. Observations indicate a gradual decrease in entropy production from the near to the far direction of fluid flow in the wake region. Furthermore, when the SS cavitation model is incorporated, energy losses in each region of the wake flow field are lower compared to the condition without cavitation. This reduction is primarily attributed to the generation of cavitation bubbles in the wake flow field, compressing the upstream fluid and leading to a decrease in flow velocity in the near-wake region. Consequently, the intensity of multiscale vortices diminishes, and the average velocity gradient between vortices decreases, thereby reducing entropy production in the wake flow field.
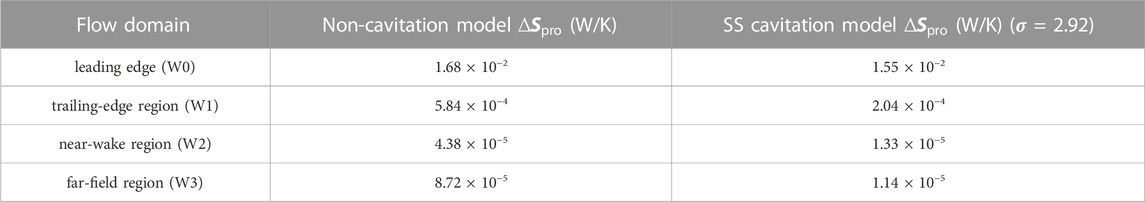
TABLE 1. Energy loss in the near wake region of the cylinder.
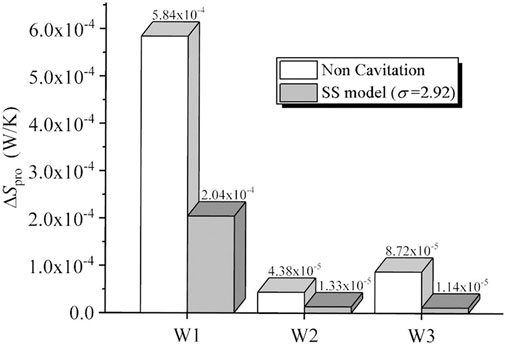
FIGURE 5. Energy loss in each region for different working conditions.
Figure 6 displays the proportions of direct entropy production (left) and fluctuating entropy production (right) in the corresponding regions of the wake flow field. A comparison reveals that in the absence of cavitation, entropy production in the leading-edge region is primarily attributed to direct entropy production. In contrast, in the trailing-edge, near-wake, and far-field regions, the proportion of fluctuating entropy production gradually increases, becoming the primary source of entropy production in those areas. However, with the incorporation of the SS cavitation model, entropy production in the leading-edge, trailing-edge, and near-wake regions of the wake flow field are predominantly associated with direct entropy production, while in the far-field region, fluctuating entropy production assumes prominence. Remarkably, in both scenarios, entropy production in the leading-edge region is primarily due to direct entropy production. This is a consequence of significant pressure gradient variation in this region. Simultaneously, the presence of cavitation bubbles in the wake flow field compresses the upstream fluid, causing a decrease in the ratio of fluctuating entropy production to total entropy production in the trailing-edge and near-wake regions. In the far-field region, entropy production is primarily associated with fluctuating entropy production. Due to the influence of cavitation bubbles, the proportion of fluctuating entropy production in this region is slightly lower when the SS cavitation model is applied compared to the condition without cavitation. Combining this information with Figure 5, it is evident that under SS cavitation model conditions, the total entropy production in the trailing-edge, near-wake, and far-field regions of the wake flow field decreases, accompanied by a corresponding reduction in the proportions of fluctuating entropy production in each region.
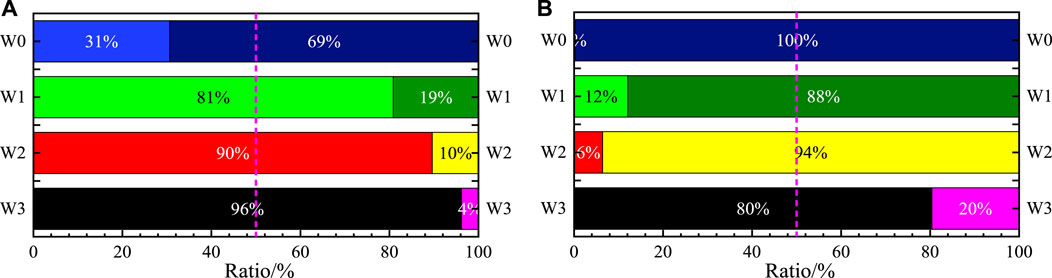
FIGURE 6. Percentage of pulsating entropy production (left) versus direct entropy production (right) in each region. (A) Non-cavitating, (B) SS model (σ = 2.92).
In summary, under both operational conditions, entropy production in the flow field around the cylinder are predominantly governed by direct entropy production in the leading-edge region (W0) and fluctuating entropy production in the far-field region (W3). The impact of cavitation bubbles on entropy production is primarily manifested in the trailing-edge region (W1) and near-wake region (W2).
3.3 Analysis of wall entropy production
Figure 7 depicts wall entropy production on the surface of the cylinder for both the non-cavitation model and the combined SS cavitation model, with the 180° direction corresponding to the leading-edge stagnation point on the cylinder surface, and the 0° direction corresponding to the trailing-edge stagnation point. The distribution, magnitude, and trends of wall entropy production on the cylinder surface are generally consistent for both the non-cavitation model and the combined SS cavitation model, as revealed in the graph. In summary, wall entropy production on the cylinder surface primarily concentrates on the upper and lower surfaces near the leading edge. The leading-edge surface exhibits a slightly higher maximum wall entropy production in the non-cavitation model compared to the combined SS cavitation model. However, during minor wall entropy production fluctuations on the trailing-edge surface, the maximum wall entropy production in the combined SS cavitation model surpasses that in the non-cavitation model. According to wall entropy production theory, the magnitude of wall entropy production is primarily related to the velocity of the fluid in the vicinity of the wall and the wall shear stress induced by velocity gradients. Thus, the distribution trend of wall entropy production along the cylinder surface aligns generally with the velocity distribution trend in the nearby region. This suggests that wall entropy production is mainly concentrated in regions with higher velocity gradients, and as velocity gradients increase, the values of wall entropy production also increase.
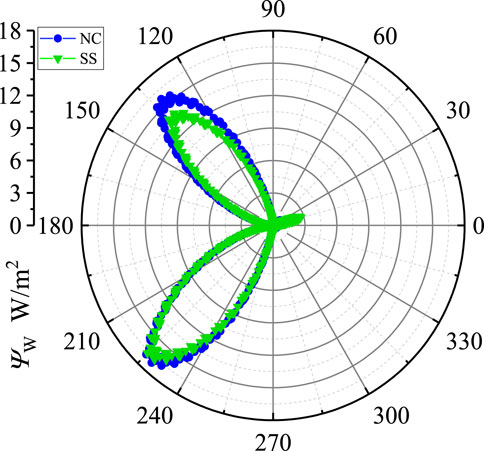
FIGURE 7. Entropy production on the surface of the cylinder with and without cavitation model.
Given the frequent incidence of energy losses in regions characterized by substantial velocity gradients, there arises a necessity for a meticulous investigation into entropy production rates within the velocity boundary layer on the surface of the cylinder. Circles C1, C2, and C3, centered around the cylinder’s axis, were deliberately selected within the velocity boundary layer at distances ranging from 0.5D to 0.525D. The visual representation of the distribution of entropy production rates for these circles is presented in Figures 8, 9.
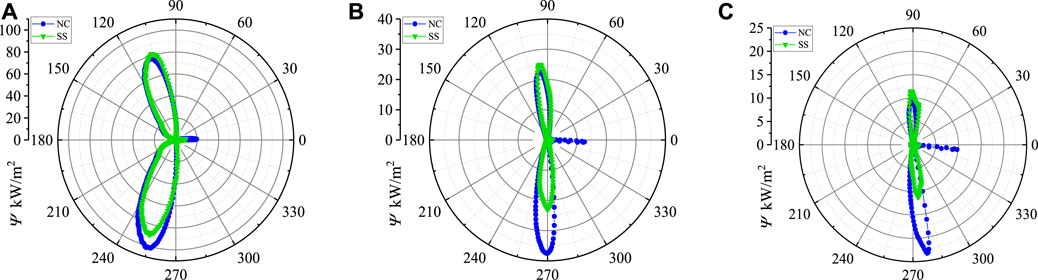
FIGURE 8. Entropy production at different locations and under different conditions in velocity boundary layer. (A) C1, (B) C2, (C) C3.
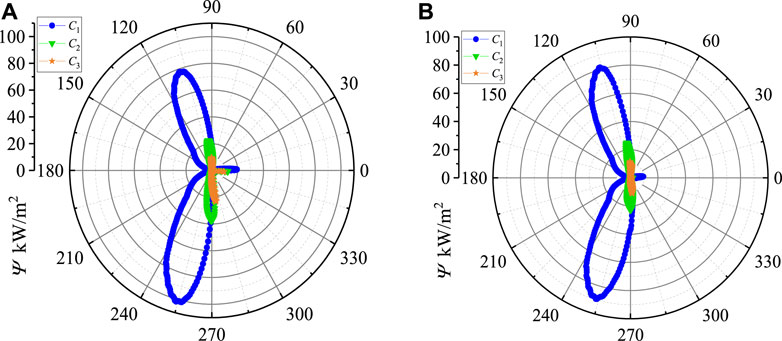
FIGURE 9. Distribution of entropy production in boundary layer under different working conditions. (A) Non-cavitating, (B) SS model (σ = 2.92).
Referring to Figure 8, it becomes evident that the distribution trends of entropy production rates on circles C1, C2, and C3 remain consistently similar for both the non-cavitation model and the combined SS cavitation model. At the leading-edge stagnation point (180°), the entropy production rate is nearly zero for all three circles. Proceeding clockwise from the leading-edge stagnation point to the region near the upper surface flow separation point (ranging from 180° to 90°), in both scenarios, the entropy production rate rapidly increases to a maximum value and then experiences a rapid decrease. On the trailing-edge surface (ranging from 90° to 270°), there is a pronounced fluctuation of entropy production rate only in the vicinity of the trailing-edge stagnation point (0°). Near the lower surface flow separation point and back to the leading-edge stagnation point, the entropy production rate again rapidly increases to a certain maximum value before decreasing rapidly.
Upon comparing C1, C2, and C3, it is apparent that the locations of the maximum entropy production rates on the surface of the cylinder are generally consistent for both the non-cavitation model and the combined SS cavitation model. However, in the region beneath the cylinder, the maximum entropy production rate in the non-cavitation model significantly exceeds that in the combined SS cavitation model. As analyzed earlier, in the trailing-edge region, both operating conditions are significantly influenced by fluctuating entropy production. Consequently, the difference in energy losses mainly depends on the distribution of fluctuating entropy production, which is associated with the dissipation of turbulent kinetic energy in the fluid. Due to the quasi-periodic nature of the wake flow field, the distribution of turbulent kinetic energy dissipation rate on the cylinder surface is also quasi-periodic. At present, the turbulent kinetic energy dissipation on the upper surface concentrates near the leading edge, which is consistent with the flow separation point on the upper surface. This results in minimal generation of fluctuating entropy production in the velocity boundary layer on the upper surface of the cylinder. Therefore, in the velocity boundary layer on the upper surface of the cylinder, the trends of entropy production rates are similar for both the non-cavitation model and the combined SS cavitation model, with the maximum entropy production rate slightly higher when the SS cavitation model is incorporated.
Concurrently, the turbulent kinetic energy dissipation on the lower surface concentrates near the trailing edge, which is consistent with the flow separation point on the lower surface. Therefore, although the trends of entropy production rate distribution in the region near the lower surface are similar for both cases, the region is closer to the trailing-edge region (W1). Under the influence of cavitation bubble compression, the maximum entropy production rate in the velocity boundary layer on the lower surface of the cylinder is significantly smaller when the SS cavitation model is incorporated compared to the non-cavitation model. Meanwhile, in the region near the trailing-edge stagnation point of the cylinder, the effect of cavitation bubble compression in the wake flow field significantly influences the velocity boundary layer’s maximum entropy production rate under non-cavitation model conditions, making it much greater than that under the combined SS cavitation model. This observation indicates that the presence of cavitation bubbles in the wake flow field around the cylinder compresses the upstream fluid, leading to a reduction in the flow velocity and, consequently, a decrease in velocity gradients in the velocity boundary layer on the cylinder surface when the SS cavitation model is incorporated. This further elucidates the sharp decrease in the proportion of fluctuating entropy production in the leading-edge and trailing-edge regions observed in Figure 7 under both non-cavitation and combined SS cavitation model conditions.
According to Figure 9, it is evident that the variation trend of entropy production rate distribution within the velocity boundary layer remains fundamentally consistent under both non-cavitation and combined SS cavitation model conditions. The entropy production rate gradually decreases from the inner to the outer layers, and the location of the maximum entropy production rate also progressively shifts away from the leading-edge stagnation point. This shift is primarily attributed to flow separation occurring on the surface of the cylinder. In summary, the impact of vortex cavitation in the wake flow field around the cylinder on the distribution trend of entropy production rates within the velocity boundary layer on the cylinder surface is relatively minor. However, it significantly affects the magnitude of entropy production rates and the proportion of contributions from different sources to entropy production.
4 Conclusion
1. Energy loss in the wake flow field around a cylinder, from the region of flow separation on the cylinder surface to the near-wake area, is evident irrespective of the presence or absence of cavitation model conditions. However, under non-cavitation conditions, the energy loss region in the near-wake area is more concentrated and relatively larger. Regardless of the conditions, energy loss occurs in regions with very high velocity gradients.
2. The locations of energy loss are concentrated near the upper and lower surfaces of the cylinder, particularly near the leading edge, in both scenarios. In the leading-edge region (W0), energy loss is primarily attributed to direct entropy production, while in the far-field region (W3), fluctuating entropy production dominates. The influence of cavitation bubbles on entropy production is mainly observed in the trailing-edge region (W1) and near-wake region (W2).
3. The distribution trends of wall entropy production on the cylinder surface are generally consistent in both scenarios, with wall entropy production concentrated in regions with high velocity gradients. As velocity gradients increase, the values of wall entropy production also increase. Analysis of entropy production rates at different positions in the velocity boundary layer, on circles C1, C2, and C3, reveals consistent distribution trends under both non-cavitation and combined SS cavitation model conditions, displaying two peaks. However, under non-cavitation model conditions, the maximum entropy production rate in this region’s velocity boundary layer is significantly greater than that under the combined SS cavitation model.
Data availability statement
The original contributions presented in the study are included in the article/Supplementary material, further inquiries can be directed to the corresponding author.
Author contributions
GZ: Funding acquisition, Project administration, Resources, Supervision, Writing–original draft. XY: Software, Writing–original draft. YL: Writing–review and editing. MG: Validation, Writing–review and editing. FG: Data curation, Methodology, Writing–review and editing.
Funding
The author(s) declare financial support was received for the research, authorship, and/or publication of this article. This research was funded by the National Natural Science Foundation of China (grant nos 51979125, 52005224, and 52306041) and the senior talents fund of Jiangsu University (No. 21JDG043).
Conflict of interest
The authors declare that the research was conducted in the absence of any commercial or financial relationships that could be construed as a potential conflict of interest.
Publisher’s note
All claims expressed in this article are solely those of the authors and do not necessarily represent those of their affiliated organizations, or those of the publisher, the editors and the reviewers. Any product that may be evaluated in this article, or claim that may be made by its manufacturer, is not guaranteed or endorsed by the publisher.
References
Al-Obaidi, A. R. (2020). Detection of cavitation phenomenon within a centrifugal pump based on vibration analysis technique in both time and frequency domains. Exp. Tech. 44, 329–347. doi:10.1007/s40799-020-00362-z
Amromin, E. (2022). Analysis of scale effects on tide turbine cavitation. Ocean. Eng. 264, 112246. doi:10.1016/j.oceaneng.2022.112246
Arndt, R. E. (2012). Some remarks on hydrofoil cavitation. J. Hydrodynamics, Ser. B 24, 305–314. doi:10.1016/s1001-6058(11)60249-7
Bejan, A. (1996). Entropy generation minimization: the new thermodynamics of finite-size devices and finite-time processes. J. Appl. Phys. 79, 1191–1218. doi:10.1063/1.362674
Brandao, F. L., Bhatt, M., and Mahesh, K. (2020). Numerical study of cavitation regimes in flow over a circular cylinder. J. Fluid Mech. 885, A19. doi:10.1017/jfm.2019.971
Denton, J. D. (1993). The 1993 igti scholar lecture: loss mechanisms in turbomachines. J. Turbomach. 115 (4), 621–656. doi:10.1115/1.2929299
Fry, S. (1984). Investigating cavity/wake dynamics for a circular cylinder by measuring noise spectra. J. Fluid Mech. 142, 187–200. doi:10.1017/S0022112084001051
Ghahramani, E., Jahangir, S., Neuhauser, M., Bourgeois, S., Poelma, C., and Bensow, R. E. (2020). Experimental and numerical study of cavitating flow around a surface mounted semi-circular cylinder. Int. J. Multiph. Flow. 124, 103191. doi:10.1016/j.ijmultiphaseflow.2019.103191
Gu, F., Huang, Y., and Zhang, D. (2021). Cavitation of multiscale vortices in circular cylinder wake at Re= 9500. J. Mar. Sci. Eng. 9 (12), 1366. doi:10.3390/jmse9121366
Herwig, H., Gloss, D., and Wenterodt, T. (2008). A new approach to understanding and modelling the influence of wall roughness on friction factors for pipe and channel flows. J. Fluid Mech. 613, 35–53. doi:10.1017/S0022112008003534
Herwig, H., and Kock, F. (2007). Direct and indirect methods of calculating entropy generation rates in turbulent convective heat transfer problems. Heat. Mass Transf. 43, 207–215. doi:10.1007/s00231-006-0086-x
Hutli, E., Fekete, T., and Nedeljkovic, M. (2019). Surface characteristics and cavitation damage progress in ductile materials. Eng. Fail. Anal. 106, 104157. doi:10.1016/j.engfailanal.2019.104157
Khare, R., and Prasad, V. (2021). Prediction of cavitation and its mitigation techniques in hydraulic turbines-A review. Ocean. Eng. 221, 108512. doi:10.1016/j.oceaneng.2020.108512
Kock, F., and Herwig, H. (2004). Local entropy production in turbulent shear flows: a high-Reynolds number model with wall functions. Int. J. Heat. Mass Transf. 47, 2205–2215. doi:10.1016/j.ijheatmasstransfer.2003.11.025
Kumar, P., Chatterjee, D., and Bakshi, S. (2017). Experimental investigation of cavitating structures in the near wake of a cylinder. Int. J. Multiph. Flow. 89, 207–217. doi:10.1016/j.ijmultiphaseflow.2016.09.025
Lei, T., Zhifeng, X., Yabin, L., Yue, H., and Yun, X. (2018). Influence of T-shape tip clearance on performance of a mixed-flow pump. Proc. Inst. Mech. Eng. Part A J. Power Energy 232, 386–396. doi:10.1177/0957650917733129
Lei, T., Zhiyi, Y., Yun, X., Yabin, L., and Shuliang, C. (2017). Role of blade rotational angle on energy performance and pressure fluctuation of a mixed-flow pump. Proc. Inst. Mech. Eng. Part A J. Power Energy 231, 227–238. doi:10.1177/0957650917689948
Li, D., Song, Y., Lin, S., Wang, H., Qin, Y., and Wei, X. (2021). Effect mechanism of cavitation on the hump characteristic of a pump-turbine. Renew. Energy 167, 369–383. doi:10.1016/j.renene.2020.11.095
Li, Y., Feng, G., Li, X., Si, Q., and Zhu, Z. (2018). An experimental study on the cavitation vibration characteristics of a centrifugal pump at normal flow rate. J. Mech. Sci. Technol. 32, 4711–4720. doi:10.1007/s12206-018-0918-x
Prosperetti, A. (2017). Vapor bubbles. Annu. Rev. Fluid Mech. 49, 221–248. doi:10.1146/annurev-fluid-010816-060221
Saito, Y., and Sato, K. (2003). “Cavitation bubble collapse and impact in the wake of a circular cylinder,” in Fifth international symposium on cavitation (CAV2003) (Osaka, Japan), 1–4.
Schnerr, G. H., and Sauer, J. (2001). “Physical and numerical modeling of unsteady cavitation dynamics,” in Fourth international conference on multiphase flow (New Orleans, LO, USA: ICMF), 1.
Sun, X., Xia, G., You, W., Jia, X., Manickam, S., Tao, Y., et al. (2023). Effect of the arrangement of cavitation generation unit on the performance of an advanced rotational hydrodynamic cavitation reactor. Ultrason. Sonochemistry 99, 106544. doi:10.1016/j.ultsonch.2023.106544
Sun, X., You, W., Xuan, X., Ji, L., Xu, X., Wang, G., et al. (2021). Effect of the cavitation generation unit structure on the performance of an advanced hydrodynamic cavitation reactor for process intensifications. Chem. Eng. J. 412, 128600. doi:10.1016/j.cej.2021.128600
Sun, Z., Li, D., Mao, Y., Feng, L., Zhang, Y., and Liu, C. (2022). Anti-cavitation optimal design and experimental research on tidal turbines based on improved inverse BEM. Energy 239, 122263. doi:10.1016/j.energy.2021.122263
Tian, B., Huang, B., and Li, L. (2023). Investigation of transient sheet/cloud cavitating flow dynamics from multiscale perspective. Phys. Fluids 35 (7). doi:10.1063/5.0159763
Walsh, E. J., and Hernon, D. (2006). Unsteady volumetric entropy generation rate in laminar boundary layers. Entropy 8, 25–30. doi:10.3390/e8010025
Wang, C., Zhang, Y., Yuan, Z., and Ji, K. (2020). Development and application of the entropy production diagnostic model to the cavitation flow of a pump-turbine in pump mode. Renew. Energy 154, 774–785. doi:10.1016/j.renene.2020.03.065
Wang, Z., Liu, H., Gao, Q., Wang, Z., Wang, Y., Wang, G., et al. (2021). Numerical investigation of ventilated cavitating flow in the wake of a circular cylinder. Phys. Rev. Fluids 6, 064303. doi:10.1103/PhysRevFluids.6.064303
Keywords: cavitation, energy loss, entropy production, cylinder wake, vortex
Citation: Zhang G, Yang X, Li Y, Ge M and Gu F (2023) Numerical investigation of energy loss distribution in the cavitating wake flow around a cylinder using entropy production method. Front. Energy Res. 11:1342712. doi: 10.3389/fenrg.2023.1342712
Received: 22 November 2023; Accepted: 11 December 2023;
Published: 29 December 2023.
Edited by:
Yang Yang, Yangzhou University, ChinaCopyright © 2023 Zhang, Yang, Li, Ge and Gu. This is an open-access article distributed under the terms of the Creative Commons Attribution License (CC BY). The use, distribution or reproduction in other forums is permitted, provided the original author(s) and the copyright owner(s) are credited and that the original publication in this journal is cited, in accordance with accepted academic practice. No use, distribution or reproduction is permitted which does not comply with these terms.
*Correspondence: Fadong Gu, MjExOTExMDA0QHN0bWFpbC51anMuZWR1LmNu