 Bo Zeng
 Mingyang Wu
 Yuliang Su
 Yintong Guo
 Jiangrong Feng2
 Jun Lu
94% of researchers rate our articles as excellent or good
Learn more about the work of our research integrity team to safeguard the quality of each article we publish.
Find out more
ORIGINAL RESEARCH article
Front. Energy Res., 08 January 2024
Sec. Advanced Clean Fuel Technologies
Volume 11 - 2023 | https://doi.org/10.3389/fenrg.2023.1342254
This article is part of the Research TopicAdvances in Geomechanics Research and Application for Deep Unconventional ReservoirsView all 35 articles
Deep reservoirs have a large difference in geo-stress, and compared to shallow reservoirs, multiple clusters of fracturing are usually required to effectively improve the quality of reservoir reconstruction. In this paper, considering the relevant geological parameters of a certain reservoir in the southwest, multi-cluster reservoir fracturing models under three-dimensional conditions based on the cohesive element modelling method are established. Then, the quantitative rules of fluid pressure, fracture length, fracture aperture, fracture area, tensile failure rate, and the fractal dimension of fracture morphology under different fracturing cluster numbers were revealed. The results show that compared to conventional fracturing, multi-cluster fracturing can significantly increase the number of main fractures and improve the effectiveness of reservoir reconstruction. As the number of clusters increases, the number of main fractures in the reservoir increases, but it can also lead to the increase of small opening fractures, which may be unfavourable for the pumping of proppant and subsequent mining. Meanwhile, based on the fractal dimension results of fracture morphology, it was found that under this simulation condition, the number of fracturing clusters had a significant impact on the fractal dimension of fracturing fractures before the fracturing of six clusters, while after the fracturing of six clusters, the impact of the number of fracturing clusters on the fractal dimension of fracturing fractures decreased. Therefore, when considering factors such as the complexity of fractures, multi-cluster fracturing does not necessarily result in more fracturing clusters being better but should be comprehensively considered for optimization. This study has certain reference significance for selecting the spacing between multiple fracturing clusters.
With the development of unconventional oil and gas, more and more attention has been paid to the exploration and development of deep shale (Song, et al., 2017). Because of the high in-situ stress in deep shale reservoirs (Guo, et al., 1993; Huang, et al., 2019; Jiang, et al., 2019; Moghadasi et al., 2019; Yang et al., 2023), it is difficult for hydraulic fractures to start and expand, and hydraulic fractures are easy to close under high in-situ stress, so conventional methods of shale reservoir fracture growth cannot be used to study unconventional shale reservoirs (Wu, et al., 2020; Luo, et al., 2022). For deep shale reservoir reconstruction engineering, the way of stage fracturing is usually adopted, so it is necessary to study the law of multi-cluster fracture propagation in deep shale reservoirs.
Early fracturing research was achieved through theoretical derivation and indoor experiments. With the deepening of fracturing research, the assumption of homogeneous rocks in theoretical derivation has made it difficult to meet the current research needs. Meanwhile, although indoor experiments are an excellent method for fracturing research (Qiu, et al., 2023; Tan, et al., 2023), they are limited by sample size and cost, making it difficult to conduct more targeted on-site numerical simulation studies. As an accurate, efficient and convenient research method, numerical simulation can take into account some special factors in the actual reservoir, such as irregular natural fractures, random lithology mutants, and even complex ground stress states, and it is very suitable for studying the fracture propagation mechanism of deep shale reservoirs(Wei, et al., 2015; Liu, et al., 2018; Wu M. et al., 2018; Zheng, et al., 2022). At present, the numerical methods commonly used in hydraulic fracture propagation simulation (Xiang, et al., 2009; Ju, et al., 2016; Yan, et al., 2018; Rougier, et al., 2019) mainly include the unified pipe-interface element method (Yan, et al., 2021; Yan and Yu, 2022), peridynamics, cracking particles method, finite element method (FEM) (Xiang, et al., 2009; Lecampion and Desroches, 2015), extended finite element method (XFEM) (Wang, 2016; Zou, et al., 2020), displacement discontinuity method (DDM), discrete element method (DEM) (Huang, et al., 2022) and phase field method (PFM). The FEM, as a mature numerical calculation method, is widely used in hydraulic fracturing numerical simulation because of its flexibility in dealing with complex mechanical problems, such as rock heterogeneity. However, fractures can only expand along the grid boundary and grid reconstruction is required. Based on the conventional finite element continuous displacement field, the XFEM characterizes discontinuity of displacement by adding local enrichment function to the element containing fracture, allowing fracture to penetrate the grid without grid reconstruction. Compared with the finite element method, XFEM has obvious advantages and is widely used in the simulation of hydraulic fracture propagation. However, this method has some difficulties in dealing with complex fracture networks and multi-cluster fracture propagation. DDM as an indirect boundary element method, only needs to discrete the fracture, but does not need to discrete other areas outside the fracture. Therefore, compared with the finite element method, DDM is one of the most used numerical methods for the simulation of complex fracture networks.
However, due to the assumption of discontinuous displacement solutions, this method cannot be applied to non-homogeneous and non-linearly elastic media. The discrete element method (DEM) discrete the medium into blocks (or particles) and judges the fracture behavior by the contact state between the blocks (Huang, et al., 2019). Hydraulic fracturing is the process in which rock mass fractures occur, so the DEM method is gradually used to simulate the propagation of hydraulic fractures. The advantages of this method in dealing with discontinuity problems make it very suitable for simulating the complex fracture network propagation process in reservoirs with high natural fracture development, but its disadvantages are that it cannot deal with continuum problems well, and the calculation amount is too large, and the calculation efficiency is low. The phase field method equates the fracture to a material weakening zone, and the displacement is continuous. Under the framework of finite element calculation, the phase field variable is introduced to describe the fracture without additional tracking of the fracture geometry. Compared with the discrete model, the PFM has a unique advantage in calculating complex fracture propagation such as fracture intersection, bifurcation, and three-dimensional arbitrary tortuous propagation path. However, the model also has some shortcomings, such as requiring the finite element mesh in the fracture propagation area to be sufficiently fine and commutative. The finite element discrete element method (FDEM) (Munjiza, 2004; Wu, et al., 2023) is a hybrid simulation method, that can give full play to the advantages of the finite element method and discrete element method, and avoid the disadvantages of both, so it is suitable for hydraulic fracturing simulation test. Unfortunately, the previous numerical simulation studies mainly focused on the study of fracture propagation mechanism under low geo-stress environments, and it is difficult to provide direct references for fracturing operations in deep-tight sandstone reservoirs. Therefore, based on the FDEM method, it is very necessary to study the law of multi-cluster hydraulic fracture propagation under high-ground stress. Meanwhile, deep reservoirs usually use multi-cluster fracturing construction. Yuan et al. (Yuan et al., 2018) established a mathematical model for CFS multi-stage fracturing of horizontal wells. Considering the differences in limited hydraulic fracture conductivity, hydraulic fracture inclination, and the different shapes of multi-wing fractures at perforation points, this model can effectively analyze the production performance of different multistage fractured horizontal well types. A simple and fast well-testing method has been proposed by Meng et al. (Meng et al., 2020) for fracturing evaluation and parameter estimation of non-uniform fractured multi-fracture horizontal wells. Then, they found that there is a good relationship between the fracturing treatment parameters and the generated fracture properties, including fracture length and reservoir ratio (or fracture volume ratio). Qin et al.'s research (Qin et al., 2019) shows that the fractal dimension of rough fractures significantly affects the permeability characteristics of reservoirs. Given that the evaluation of the fractal dimension of fractures after fracturing is more likely to be presented simultaneously with the fracturing results, it is also necessary to further evaluate the complexity of complex fractures using the fractal dimension.
This paper investigates a specific reservoir in the southwest by considering relevant geological parameters. Three-dimensional (3D) multi-cluster reservoir fracturing models using cohesive element modeling were established, and the quantitative rules of fluid pressure, fracture length, fracture aperture, fracture area, tensile failure rate, and the fractal dimension of fracture morphology under different fracturing cluster numbers were revealed. The simulation method, modeling process, and parameters for the benchmark model are presented in Section 2, and the simulation results and corresponding analysis are presented in Section 3. Afterward, the results of comparing and analyzing the differences in conventional quantitative parameters and morphological fractal dimensions of fracture propagation during different cluster fracturing processes are presented in Section 4, and some suggestions for the number of fracturing clusters in the fracturing block were provided. The conclusion is presented at the end.
Reservoir fracturing is a typical fluid-solid coupling process that involves stress deformation and rock fracture caused by fluid injection (Huang, et al., 2023). Therefore, the fracturing process needs to meet the equilibrium equation. During the fracturing process, the fluid first flows from the perforation into the reservoir, involving the distribution of pipe flow in multiple clusters of fracturing. Subsequently, the fluid flows into the reservoir through different clusters and gradually forms artificial fractures, involving simulation processes such as reservoir fracturing. Therefore, this study is based on cohesive element modeling to achieve reservoir fracture simulation, and corresponding equations were used to simulate fluid flow in pipes, fractures, and matrices. Of course, the fracturing process may also involve the migration of porous media in the reservoir matrix (Song, et al., 2022a; Song, et al., 2022b). Based on above analysis, the detailed simulation methods and model settings is described below.
During the entire fracturing process, reservoir deformation and fluid flow need to meet the following equilibrium equations (Wu Z. et al., 2018)
where
Fluid flow needs to satisfy the continuity equation (Dahi Taleghani, et al., 2018)
where
When fracturing a real reservoir, fluid is first injected from the wellbore and further flowed into the reservoir through wellbore perforation and diversion. There is a relationship between the total amount of injected fluid and the total amount of different perforated fluids flowing into the reservoir.
Correspondingly, the fluid pressure drop equilibrium equation can be described as
where p0 is the injection point fluid pressure, ppf,i is the fluid pressure at the cluster, pcf,i is the pressure drop through the cluster, psf,i is the pressure resulting from friction between the fluid and the wellbore.
It is worth mentioning that when fluid flows in the wellbore, there will be a certain pressure loss due to the influence of wellbore roughness, which can be calculated using the following formulas (Modeland, et al., 2011; Zhang, et al., 2023).
where ΔP is the pressure difference at the node of the cluster, ΔZ is the elevation difference of the node, v is the fluid velocity in horizontal wellbore, ρ is the fluid density, G is the acceleration of gravity, CL is the loss coefficient, f is the friction force on the wellbore, L is the wellbore length, Ki is the loss term in fixed direction, Ks is the roughness of wellbore, Dh is the wellbore diameter, Re is the Reynolds number of the fluid in the wellbore.
Given the complexity of the perforation situation, there may also be some pressure loss at the perforation location (Cramer, et al., 2019)
where n is the number of perforations in each cluster, in this paper, the value is 16, Dp is the perforation diameter, C is the coefficient affecting perforation flow, generally 0.56–0.9 (Modeland, et al., 2011; Zhang, et al., 2023), in this paper, the value is 0.6.
After the fluid flows into the reservoir through the wellbore and perforation, it will promote the initiation of artificial fractures. At this time, the deformation behaviour of artificial fractures can be described by linear elastic equations (Wu, et al., 2019)
where
where
It is generally believed that rock is a brittle material, and when it fails, fractures will rapidly initiate, and its strength stress-strain curve shows a rapid downward trend. To simulate this failure behaviour, the Cohesive element used to simulate artificial fractures cannot deform infinitely and can be judged using the maximum principal stress criterion (Wang, 2019)
where
After the failure of reservoir rocks, fractures rapidly develop, but their bearing capacity does not directly decrease to 0. The reservoir rock still has a certain degree of continuous attenuation of deformation resistance, which can be described using damage variables (Xavier, et al., 2014; Wu M. et al., 2018; Wu, et al., 2019)
where
Damage factors could be calculated by
where
It is worth mentioning that the process of artificial fracture initiation, opening, and extension is accompanied by fluid flow. After the artificial fracture initiation, the fluid flow inside it can be calculated by the following equation.
where q represented the volume flow vector per tangential element length; t was the thickness of a cohesive element, m; μ was the viscous coefficient of fracturing fluid in a cohesive element; p was the fluid pressure in a cohesive element, MPa.
The flow of fluid in fractures is not limited to the flow inside the fractures. Since the interface between the fluid and the reservoir matrix is rock, there is also a certain degree of fluid flow ability. Under this condition, there may be some filtration of fluid within the fracture, i.e., it flows out of the fracture into the reservoir. At this point, the fluid filtration at the upper and lower interfaces of the fracture can be defined by the filtration coefficient.
where
Finally, the fluid filtered into the reservoir from fractures and other locations will flow through Darcy flow to other areas of the reservoir, therefore, it can be described by Darcy flow (Li and Ghosh, 2006)
where
To conduct a targeted and in-depth analysis of the multi-cluster fracturing construction rules of a fracturing well in Southwest China, the on-site data of a fracturing well in Southwest China was first investigated. Subsequently, based on on-site data and existing researches (Wu, et al., 2022; Wu, et al., 2023), a multi-cluster fracturing simulation model for the reservoir was constructed, and the corresponding model settings are as follows.
① The fracturing well belongs to the well section that has completed the fracturing transformation, and the main construction process is the transformation mode of multiple clusters and large displacement within the section. The fracturing fluid is a low-viscosity and smooth water system. After comprehensive consideration, the range of segmented fracturing is 60 m × 60 m, mainly involving multiple layers, with the sum of thicknesses of the closest layer being about 3 m. Therefore, the simulation model study area size is set to 60 m × 60 m × 3 m. The fluid used in the simulation has a smooth water parameter of 0.001 Pa s.
② Observation and statistics of fractured well cores show the presence of natural bedding fractures, with linear density ranging from 0.5 to 30 per meter. Given that natural fractures are not the focus of this simulation, the model assumes that natural fractures are approximately 0.5 per meter. Meanwhile, the conventional interface element method with global embedding has phenomena such as long computational time and severe local shear collapse of fractures. Therefore, the use of random modelling to form a discrete nonplanar sequence fracture network (Shi, et al., 2023) facilitates the development of multi-cluster fracturing. Subsequently, based on the Python module developed by us; a corresponding grid model was formed as shown in Figure 1.
③ The injected fluid flows into the reservoir after being diverted along the wellbore components, and the pressure loss and fluid distribution in the wellbore can be simulated through the fluid pipe element (fp3d2 and fpc3d2) in Abaqus. Therefore, the fp3d2 element is used to set up a simulated wellbore located at the bottom of the reservoir area, and the fpc3d2 element is used to simulate the friction before flowing into the reservoir. The interaction between fluid volume and fluid pressure in the simulation is achieved by binding the wellbore tip node and the reservoir interface element node. Therefore, during single cluster fracturing, the injection point of the model is located at the endpoint of the wellbore. In addition, there is randomness in the actual on-site perforation spacing. To simulate perforation more realistically, the perforation of this model is randomly set, with a total of 32 perforation points.
④ The x direction is assumed to be the maximum horizontal principal stress direction, the z direction is assumed to be the vertical principal stress direction and the y direction is assumed to be the minimum horizontal principal stress direction. The outer boundary of the model is a fixed displacement and impermeable boundary condition, with upper and lower boundaries constraining displacement in the z direction and left and right boundaries constraining displacement in the x and y directions.
⑤ To reduce computational complexity, larger grid seeds were used for grid generation. After grid generation, the total grid size of the reservoir components was 16596, including 12710 rock block elements, 3885 interface elements, and a total of 28376 nodes. The total number of simulated wellbore elements is 95, including 32 fpc3d2 elements, 63 fp3d2 elements, and a total of 98 nodes.
⑥ On-site logging interpretation and triaxial compression tests show that the Poisson’s ratio of the fractured rock is between 0.224 and 0.266, and Young’s modulus is 40.16–48.58 GPa, the porosity ranges from 3.6% to 5.2%. Therefore, in the reservoir fracturing benchmark model, Young’s modulus is taken as 43 GPa, Poisson’s ratio is taken as 0.23, and porosity is taken as 0.03. At the same time, the maximum horizontal stress of the target section is about 110 MPa, the minimum horizontal stress is about 96 MPa, the vertical stress is about 106 MPa, and the pore pressure is about 66 MPa. During on-site construction, the displacement of the fracturing well is 18 m3/min, and generally, fracturing takes 1–2 h. Therefore, the injection rate in the simulation model is set to 18 m3/min, and the injection time is set to 3600 s. In addition to the above parameters, the simulation model also includes constitutive parameters of the cohesive element and fluid flow-related parameters of the simulated wellbore, all of which are referenced from previous studies (Wu, et al., 2022; Wu, et al., 2023; Zhang, et al., 2023). The main simulation parameters obtained are shown in Table 1. Then, the fracturing simulation results can be obtained based on Eqs 1–14.
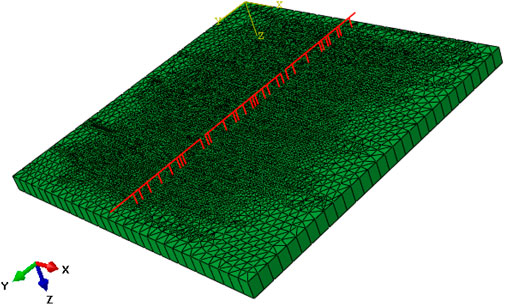
FIGURE 1. Schematic diagram of multi segment and multi-cluster fracturing model.
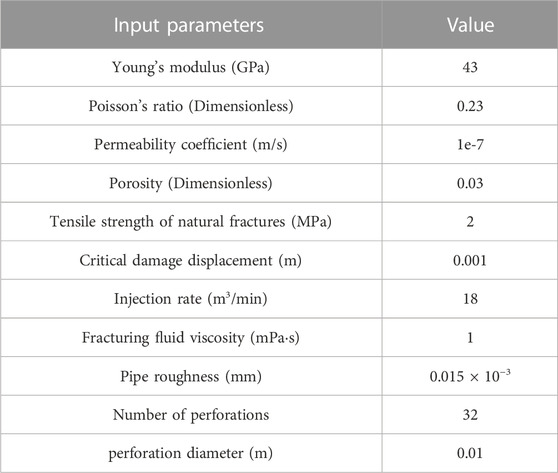
TABLE 1. Main parameters used in simulation models.
To explore the impact of fracturing cluster setting on the propagation of artificial fractures during fracturing construction in a certain block in southwestern China, this section conducted further numerical simulation research based on previous model settings, analysing the differences in the propagation of artificial fracture morphology from single cluster fracturing to twelve cluster fracturing construction conditions. To explore the impact of fracturing cluster setting on the propagation of artificial fractures during fracturing construction in a certain block in southwestern China, this section conducted further numerical simulation research based on previous model settings, analysing the differences in the propagation of artificial fracture morphology from single cluster fracturing to twelve clusters fracturing construction conditions.
After comprehensive consideration of the information collected earlier, a three-dimensional multi-cluster fracturing simulation model was created. To deeply analyze the fracture propagation characteristics under different fracturing cluster conditions, a single cluster fracturing analysis was first conducted. Considering that the stiffness of interface elements has a certain impact on the simulation results during the simulation process, a comparison of stiffness was also considered in some single-cluster and multi-cluster simulations. In the subsequent simulation model, the cluster is represented by C, and the ratio of stiffness to rock modulus is represented by E. For example, C1 represents single cluster fracturing, and E1 and E2 represent the ratio of the stiffness of the interface element to the elastic modulus of the rock, which is 10 times and 100 times, respectively. Due to the limitations of model size, the propagation process of fracture morphology with the greatest variation in simulation mainly occurs between 0 and 1000s. Therefore, this simulation mainly extracted simulation result data between 0 and 1000s. Subsequently, conventional quantitative parameter results were extracted using extraction methods from existing researches (Wu, et al., 2022; Wu, et al., 2023) on the number of damaged cohesive elements, fracture length, fracture area, fracture aperture, and tensile failure ratio. The comparison results of conventional quantitative parameters under the influence of interface element stiffness are shown in Figure 2.

FIGURE 2. Comparison results of conventional quantitative parameters under the influence of interface element stiffness (Single cluster).
It can be seen from Figure 2 that when the stiffness value is large, the number of fracture elements and the total area of fractures are both large. This result indicates that the stiffness of interface elements has a certain impact on the morphology and development of rock mass compression fractures, with an area effect of up to twice. Meanwhile, when the stiffness is high, the fracture width at the injection point, the maximum fracture width, and the total volume of the fractures are relatively small, which may result in the formation of many local fractures with smaller openings and the interlocking phenomenon of remote fractures. The above results indicate that when the rock interface in the reservoir ruptures, under the same limit width conditions, the greater the stiffness, the more likely it is to generate small opening local fractures.
Figure 3 shows the comparison results of fracture morphology under the influence of interface element stiffness. Please note that the hydraulic fracture in Figure 3 is composed of multiple damaged cohesive elements. It can be seen from Figure 3 that when the stiffness is high, two artificial fractures are produced in a single cluster fracturing, and there is a phenomenon of bifurcation and propagation at the tip. When the stiffness is small, artificial fractures mainly propagate along the main fracture. Generally, the greater the stiffness of the interface element, the stronger the brittleness of the rock during fracture, and the easier it is to form some shear cracks under stress. Therefore, we speculate that the two clusters of fractures in Figure 3 may have developed from shear failure fractures during the early stages of fracturing. Correspondingly, the stronger the deformation resistance of the interface, the easier it is for the reservoir to form multiple clusters of fractures. The weaker the resistance to deformation, the more likely it is to form a main seam with a forked and bent tip (Figure 4).
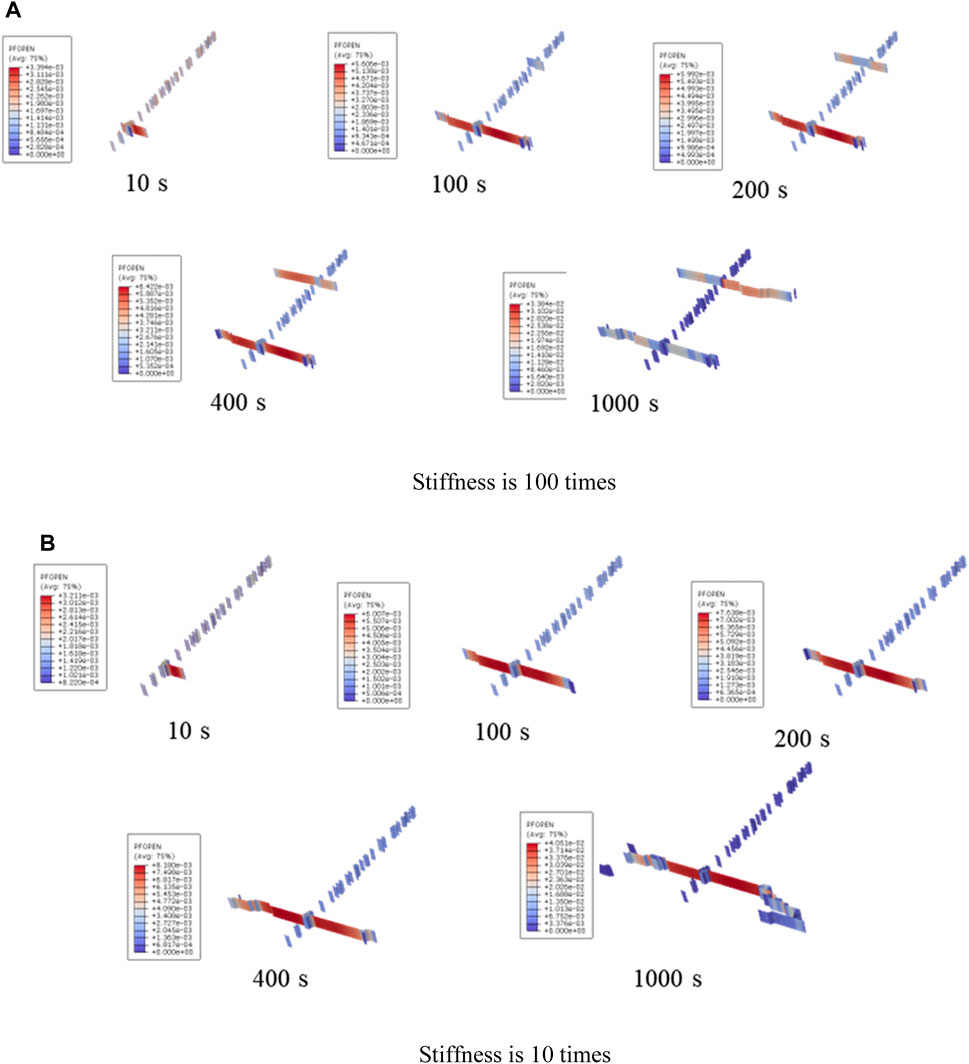
FIGURE 3. Comparison results of fracture morphology under the influence of interface element stiffness (3D view).
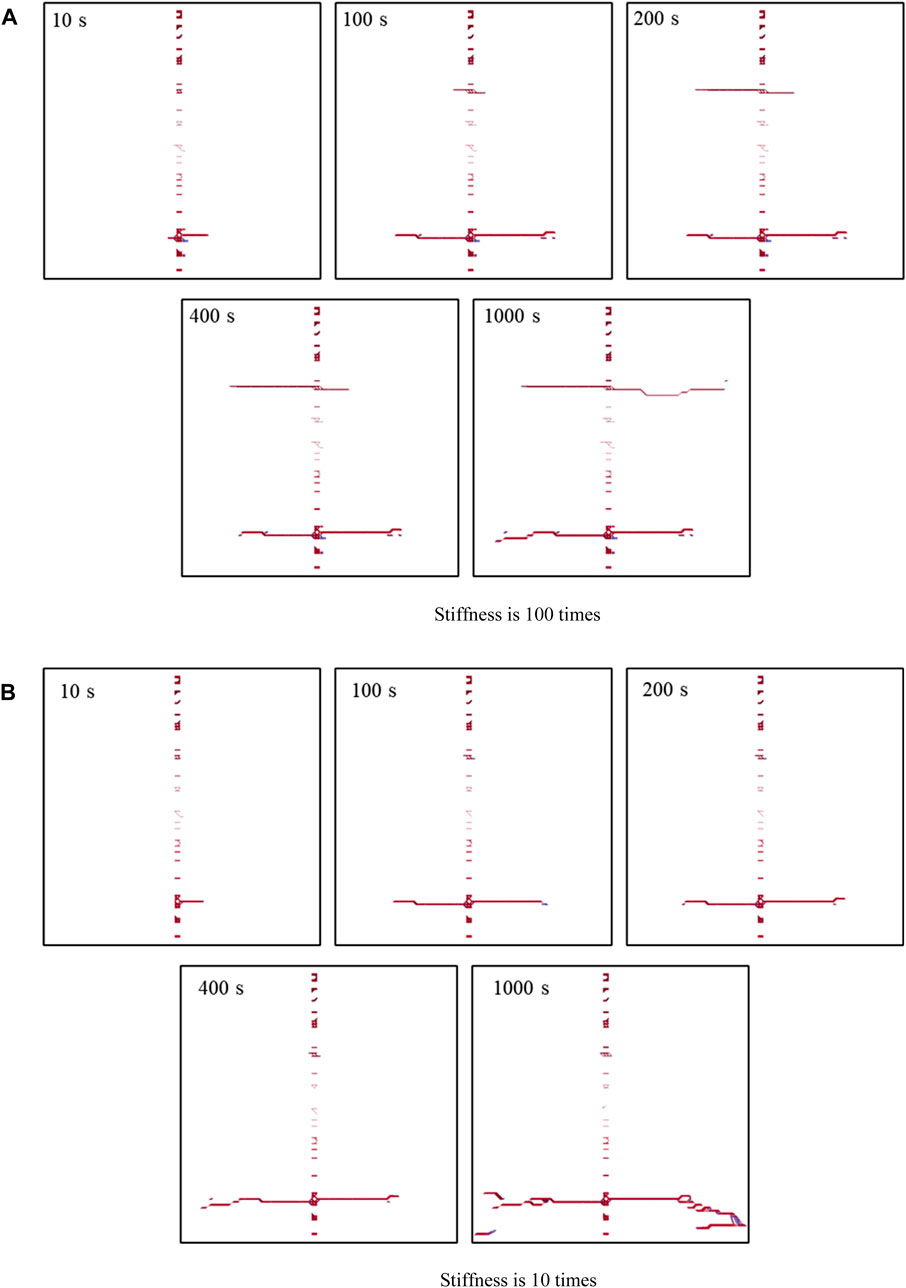
FIGURE 4. Artificial fracture development process during single cluster fracturing (top view).
Keeping the total injection flow constant and changing the model to three clusters, the obtained fracture morphology results are shown in Figure 5. From the figure, it can be observed that the initiation and propagation process of artificial fractures: ① Fracture initiation stage: in the early stage of fracturing, after the fluid flows into the wellbore, a large number of artificial fracture initiation phenomena first occur near the perforation position of the wellbore; ② Perforated fracture competition propagation stage: As the fluid is further injected, under the influence of multiple clusters of fracturing, fractures that have already sprouted between different clusters exhibit competition propagation phenomenon, gradually beginning to show the phenomenon of main fracture propagation within different clusters. It is worth noting that the artificial fractures formed during this period did not extend forward in a straight line. Affected by the stress and fluid distribution between different clusters, the first and third clusters in the three-cluster fracturing exhibit an approximate single-wing linear propagation pattern. However, the intermediate clusters may be affected by the development of fractures at both ends of the clusters, exhibiting significant non-planar propagation of a single wing; ③ The mutual influence and propagation stage of the main fractures within the cluster: When the fluid is further injected, the bending and propagation of the fractures lead to non-uniform distribution of ground stress, thereby inducing obstruction at the tip. It may cause a shift in the propagation path of the advantageous tip during the initiation of artificial fractures, leading to a transition from single-wing propagation to double-wing propagation of artificial fractures; ④ Main seam extension stage: After the artificial main seam is roughly formed, the artificial fracture will be more easily extended along the dominant main seam due to the comprehensive influence of stress difference and other conditions.
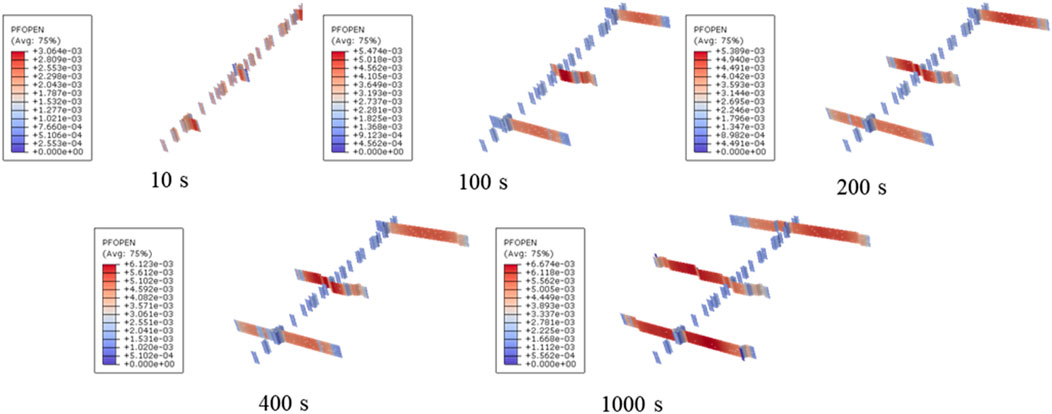
FIGURE 5. Artificial fracture development process during three clusters fracturing (3D view).
Figure 6 shows the development process of artificial fractures during three clusters of fracturing (top view). Compared to the above and below figures, the formation and development process and stages of artificial fractures during the three clusters of fracturing are basically consistent. It is worth noting that as the fracturing process continues, it can be seen from the following figure that there appeared artificial main fractures that did not seem to be connected between time t4 and t5, which was caused by the resolution setting during simulated data extraction. Due to the extremely small width of artificial fractures relative to reservoir size in the simulation results. Therefore, it is inevitable that some seemingly disconnected low-width artificial fractures will appear in the simulation results. These fractures are similar to the low-width fractures formed during the reservoir fracturing process, which may hinder the flow of proppants such as ceramides, and thus may lead to complex fracture networks detected by microseisms. However, proppants are difficult to flow into the supporting fractures, resulting in a phenomenon where the increase in production is not significant.

FIGURE 6. Artificial fracture development process during three clusters fracturing (top view).
The simulation results under the influence of different interface stiffness during six clusters fracturing are shown in Figure 7. As the interface stiffness increases, the number of fracture elements increases, the total area of fractures increases, and the volume of fractures decreases. Meanwhile, comparing the results of single cluster fracturing, as the number of fracturing clusters increases, the model shows a significant decrease in the influence of rock interface stiffness.
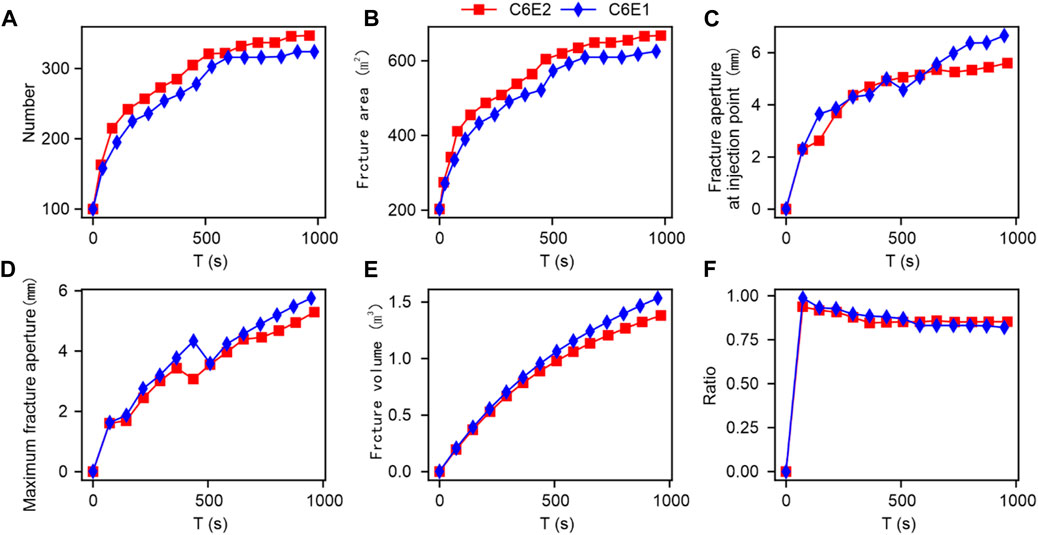
FIGURE 7. Comparison results of conventional quantitative parameters under the influence of interface element stiffness (Six clusters).
Figures 8, 9 show that when using six clusters of fracturing, the shape of the artificial fracture network is less affected by the interface stiffness. This phenomenon indicates that in actual reservoir fracturing, the impact of reservoir fracture resistance on the effectiveness of reservoir reconstruction can be reduced by setting reasonable multi-cluster fracturing.
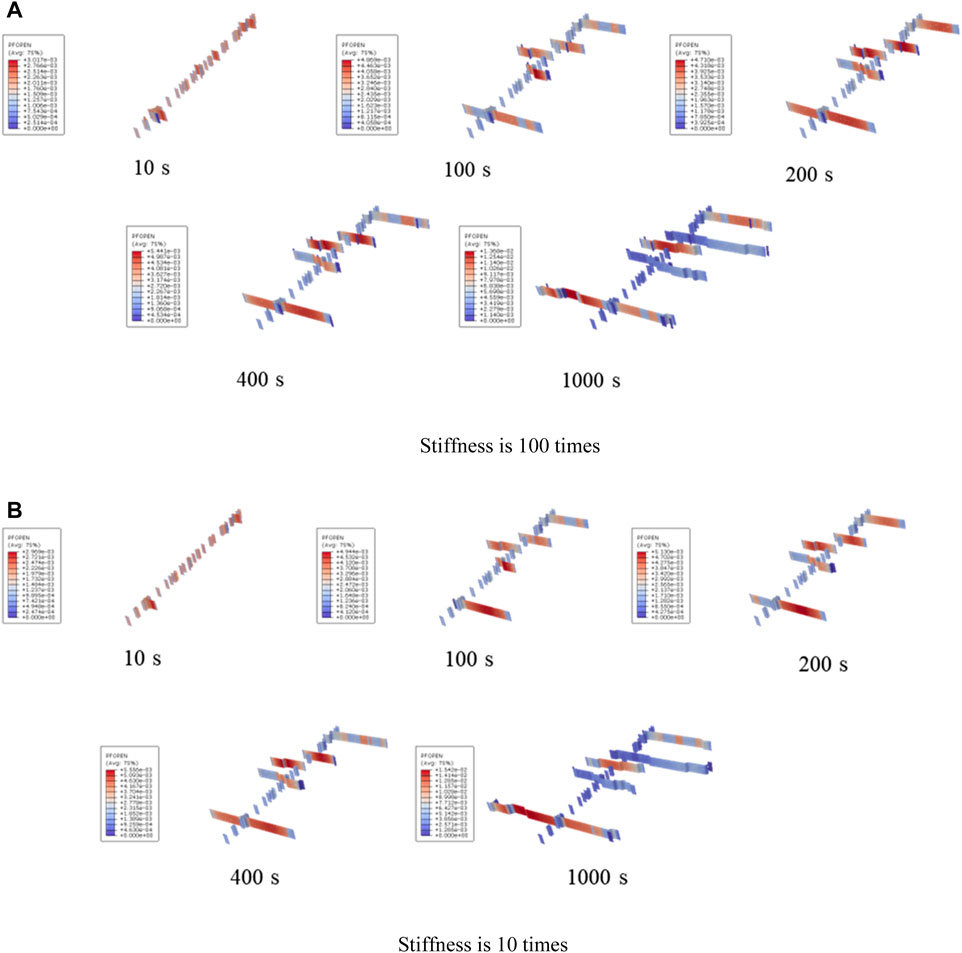
FIGURE 8. Comparison results of fracture morphology under the influence of interface element stiffness (3D View).
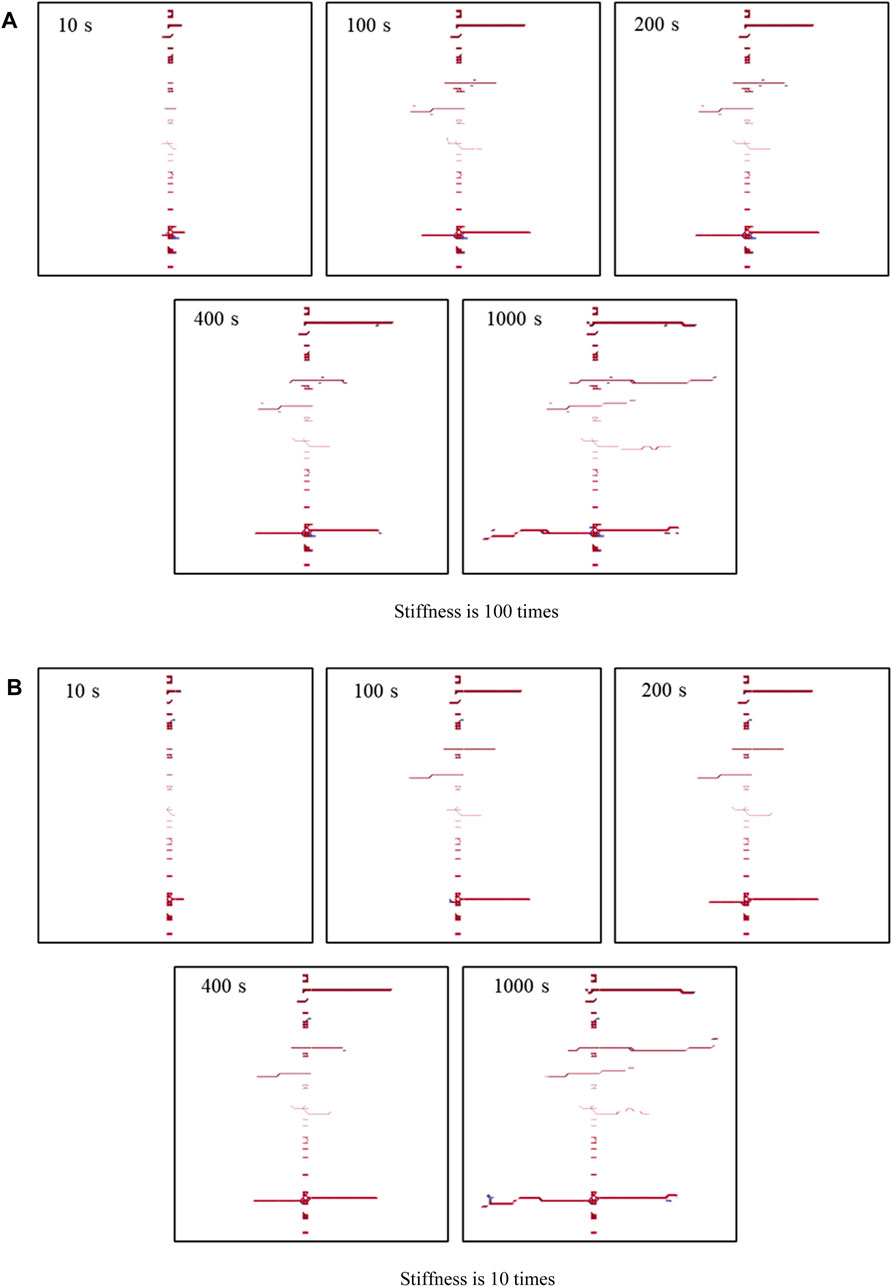
FIGURE 9. Artificial fracture development process during six clusters fracturing (top view).
Keeping the total injection flow constant and changing the model to nine cluster fracturing, the obtained fracture morphology results are shown in Figure 10. It can be observed from Figure 10 that the initiation and propagation process of artificial fractures is similar to the results of three cluster fracturing, which can be divided into the following four stages: ① fracture initiation stage; ② Stage of perforation gap competition propagation; ③ The mutual influence and propagation stage of the main fractures within the cluster; ④ Main seam extension stage. It is worth mentioning that compared to the three-cluster fracturing, there is no significant phenomenon of single-wing main fracture expanding to double-wing during the mutual influence stage of the main fractures within the cluster. This should be due to the more clusters, the more significant the phenomenon of artificial fracture competition and propagation. This should be due to the more clusters, the more significant the phenomenon of artificial fracture competition and propagation. In addition, the process of artificial fracture morphology change during nine clusters (top view) is shown in Figure 11. It can be seen from the figure that compared to the results of three clusters; more discontinuous main fractures appear in the artificial fractures. This phenomenon indicates that the more clusters, the more local wide fractures, and low-opening main fractures will be formed in artificial fractures.

FIGURE 10. Artificial fracture development process during nine clusters of fracturing (3D view).
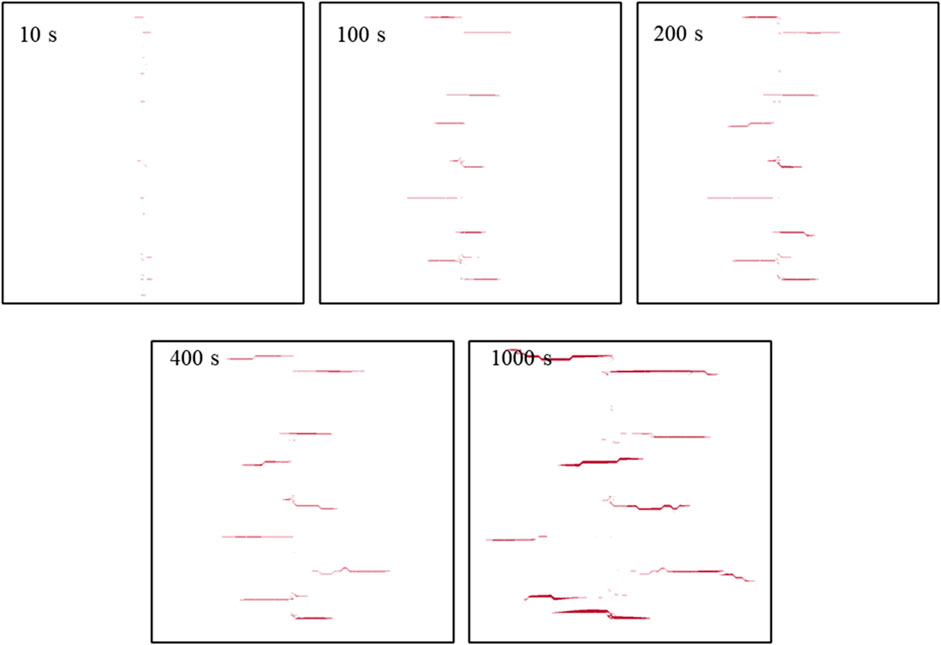
FIGURE 11. Artificial fracture development process during nine cluster fracturing (top view).
Figure 12 shows the comparison results of conventional quantitative parameters under the influence of interface element stiffness during 12-cluster fracturing. From the above figure, as the interface stiffness increases, the number of fracture elements and total fracture area show an increasing trend, while the fracture volume shows a decreasing trend. Meanwhile, comparing the results of single cluster fracturing (Figure 2) and three cluster fracturing (Figure 7), as the number of fracturing clusters increases, the model shows a significant decrease in the influence of rock interface stiffness.
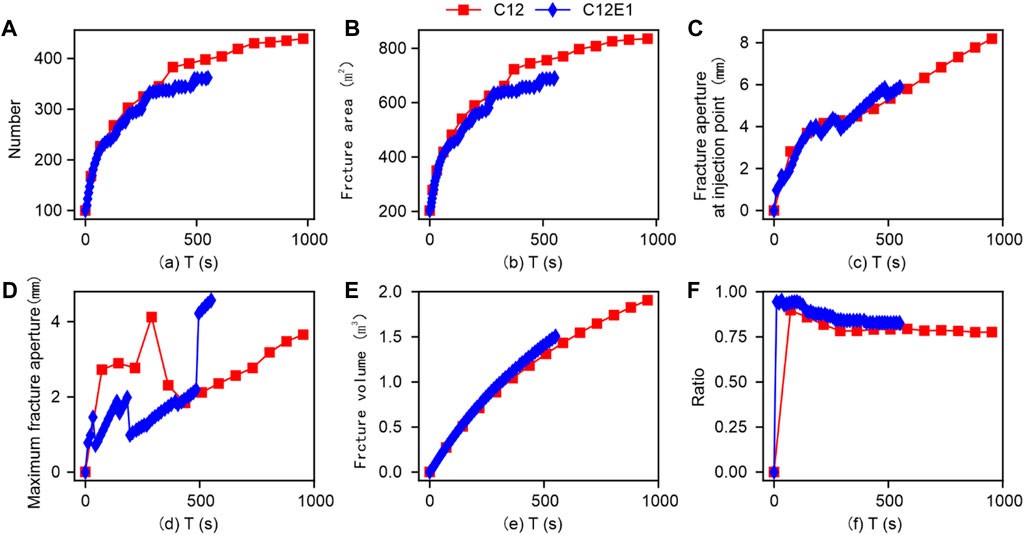
FIGURE 12. Comparison results of conventional quantitative parameters under the influence of interface element stiffness (Twelve clusters).
Figures 13 and 14 show that the artificial fracture development process during twelve cluster fracturing. Based on the comparison of the fracturing results between cluster 1 and cluster 6 in Sections 3.1 and 3.3, as the number of clusters increases, the impact of the interface stiffness within the reservoir, i.e., the reservoir’s ability to resist fracture deformation, on the shape of the artificial fracture network in the reservoir shows a certain decreasing trend. This phenomenon indicates that in actual reservoir fracturing, the impact of reservoir fracture resistance on the effectiveness of reservoir reconstruction can be reduced by setting reasonable multi-cluster fracturing.
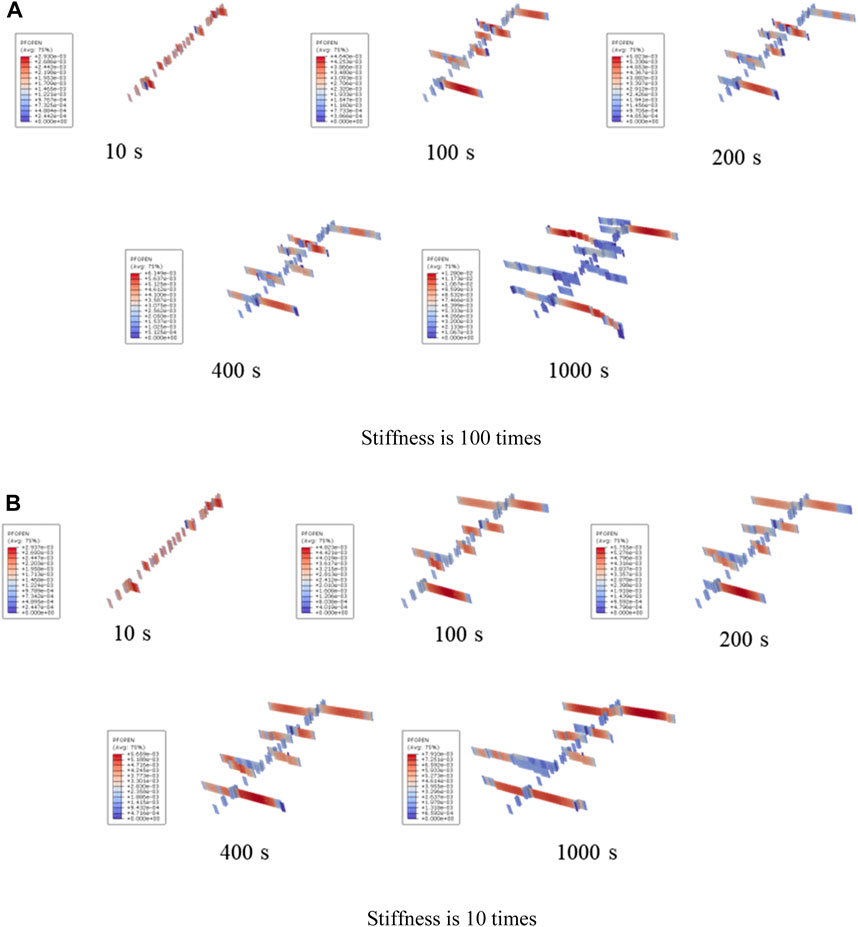
FIGURE 13. Comparison results of conventional quantitative parameters under the influence of interface element stiffness (3D view).

FIGURE 14. Artificial fracture development process during twelve cluster fracturing (top view).
The previous study analysed the results of fracture propagation under different cluster numbers, to further analyse the quantitative results of fracture propagation. This section further compares the variation process of conventional quantitative parameters of compression fractures under different clusters and the results at 1000s. Meanwhile, the complex characteristics of artificial fractures at the final 1000s were quantitatively analysed based on fractal dimension.
To further analyse the changes in parameters related to final fracture propagation during different cluster fracturing. Firstly, the conventional quantization parameter results of different clusters were comprehensively extracted, as shown in Figure 15. As the cluster spacing increases, the number of fracture elements and total fracture area in the simulation model show an increasing trend. Meanwhile, the final increase in cluster spacing from 1 cluster to six clusters and from six clusters to twelve clusters is relatively similar. The injection point fracture width and maximum fracture width exhibit significant randomness, making it difficult to use for direct quantitative analysis. The total volume of fractures shows a certain downward trend with the increase of cluster spacing. We speculate that this is due to the increase in the total extension area of the fractures, which makes it difficult for the same flow rate to support many large opening artificial fractures.
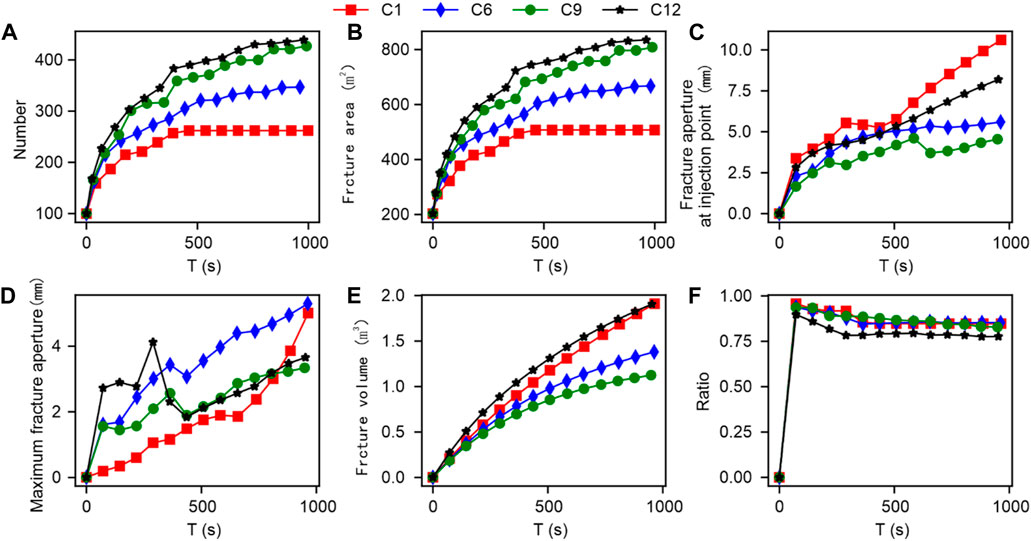
FIGURE 15. Comparison results of conventional quantization parameters under the influence of different clusters.
After extracting the final values, the morphological results shown in Figure 16 were obtained. Please note that the data results for the three fracturing clusters have not been fully calculated, and the corresponding results were not presented. By comprehensively comparing the fracture morphology of different clusters after fracturing, as the number of clusters increases, the multi-cluster phenomenon of artificial main fractures in the reservoir becomes more significant. When using the single cluster to twelve cluster fracturing, 2, 3, 5, 9, and 12 main fractures were formed respectively. Therefore, the fracture area has significantly increased. Meanwhile, as the number of clusters increases, the bending and branching of the formed fractures become more significant, thus the proportion of hydraulic fractures formed by tensile failure decreases. It is worth mentioning that due to the extremely small opening of artificial cracks caused by shear failure, it is difficult to be counted in the total volume of cracks. Therefore, under the influence of shear stimulation, the volume of artificial cracks shows a decreasing trend. However, when the number of fracturing clusters reached twelve, there was a significant increase in the volume of artificial fractures. Combined with the fracture morphology results in Figure 14, we speculate that this may be due to insufficient growth in the length of multiple main fractures during the twelve-cluster fracturing, resulting in internal pressure suppression and an increase in the calculated fracture volume. Therefore, using multi-cluster fracturing with wellbore sealing can significantly improve the effectiveness of reservoir reconstruction. However, in actual construction, it may also be necessary to consider economic factors as a reference.
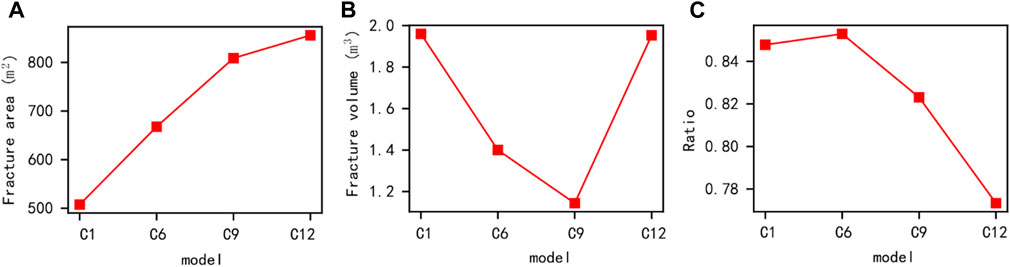
FIGURE 16. Comparison results of conventional quantitative parameters under the influence of different clusters (1000 s).
The previous study compared in detail the conventional quantitative parameters and morphological results of artificial fractures under different stiffness and number of fracturing clusters. Unfortunately, many mining studies have shown that the efficiency of reservoir mining is not only affected by the length of fractures but also more significantly by the complexity of pores and fractures (Song, et al., 2020; Liu, et al., 2023). To this end, we first extracted the artificial fracture propagation results under different fracturing cluster conditions for 1000 s, as shown in Figure 17. It can be roughly inferred that as the number of fracturing clusters increases, the complexity of reservoir fractures shows an increasing trend. However, quantitative growth rates are difficult to obtain. It is worth mentioning that the complexity of artificial fractures can be characterized by fractal dimension (Costa, et al., 2007; Lai, et al., 2018), and the most used method is the box-counting dimension method. The specific calculation formula is as follows (Mandelbrot, 1982; Xie and Wang, 1999; Wu Z. et al., 2018).
where
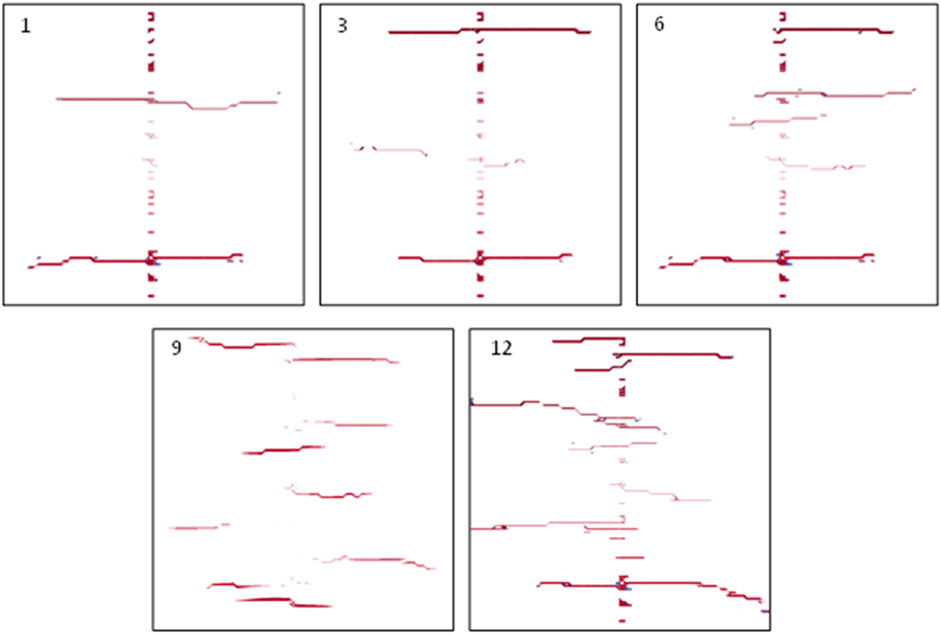
FIGURE 17. Comparison results of final fracture morphology under different cluster numbers (Top view).
In previous studies (Lee, et al., 1990; Feng, et al., 2021; Wu, et al., 2021), the resolution of fracture images was usually processed to the nth power of 2, allowing for multiple equal divisions and obtaining the fractal dimension through the above equation. However, when processing actual fracture images, it is not possible to obtain fracture images that meet the conditions, and the processing process may cause distortion of the fracture images. Therefore, we have made improvements to our previous box calculation methods by proposing the square box method and the rectangular box method, respectively. As shown in Figure 18, The two improved box-counting dimensionality methods no longer need to process the resolution of the original fracture image. The square box method directly divides the values based on the maximum image resolution to determine the box occupied by the fracture and then obtains the fractal dimension result through Eq. 15. The rectangular box method directly takes equal values based on the resolution size, and its size is obtained by converting the square with equal area to determine the box occupied by the fracture. The fractal dimension result is obtained through Eq. 15.
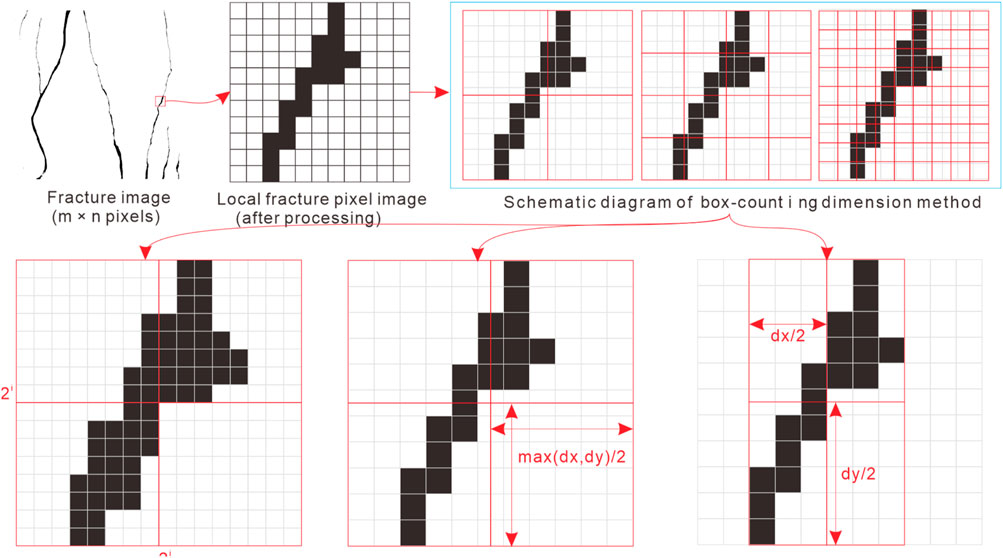
FIGURE 18. Schematic diagram of box calculation using improved box-counting method.
Given that conventional morphological parameters such as fracture area and volume are often difficult to effectively evaluate the effectiveness of fracture network fracturing. Therefore, after pixel extraction of the final fracture morphology, the improved square and rectangular box methods were used to calculate the fractal dimension results of the final fracture morphology after different cluster fracturing. As shown in Figure 19 that the fractal dimension results of the final fracture during single cluster fracturing were 1.32672 and 1.31952, respectively. The fractal dimension results of the final fracture during three cluster fracturing were 1.25064 and 1.28741, respectively (please note that the three cluster fracturing results did not fully converge to the calculation, so the reference level is low), The fractal dimension results of the final fractures during six clusters fracturing were 1.36737 and 1.40083, respectively. The fractal dimension results of the final fractures during nine clusters fracturing were 1.37670 and 1.37988, respectively. The fractal dimension results of the final fractures during twelve clusters fracturing were 1.44731 and 1.46547, respectively. When using the square box dimension, the fractal dimension results as the number of clusters increases are 1.32672, 1.25064 (low reference level), 1.36737, 1.37670, and 1.44731, respectively. As the number of clusters increases, the fractal dimension of reservoir fractures significantly increases, indicating a significant increase in complexity. Therefore, when considering the fracturing situation of a square area reservoir, the more clusters, the better the fracturing effect. The rectangular box method is more sensitive to the rectangular space occupied by artificial sewing nets, thus better reflecting the local complexity of the formed sewing net structure. Therefore, the analysis of the rectangular box dimension results shows that the fractal dimension results as the number of clusters increases are 1.31952, 1.28741 (with low reference level), 1.40083, 1.37988, and 1.46547, respectively. From this result, it can be preliminarily determined that an increase of 5 clusters from single cluster fracturing to six clusters fracturing resulted in an increase of nearly 0.08 in fractal dimension. From six clusters to twelve clusters fracturing, an increase of six clusters resulted in an increase of nearly 0.06 in fractal dimension. At the same time, there is a decrease in fractal dimension results during the process from six clusters to nine clusters, indicating a possible downward trend in the complexity of fractures. Therefore, when considering the complexity of fracturing fractures characterized by the fractal dimension of cuboids, it is more inclined to choose six clusters of fracturing.
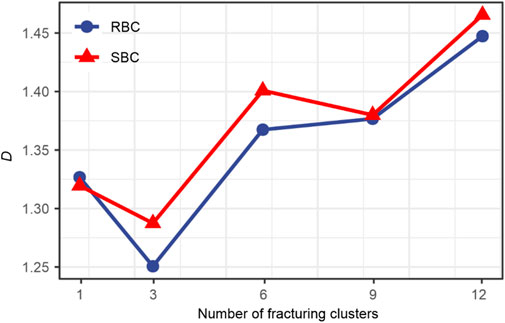
FIGURE 19. Fractal dimension results of artificial fracture morphology under different cluster conditions (1000 s).
Considering the relevant geological parameters of a certain reservoir in the southwest, three-dimensional (3D) multi-cluster reservoir fracturing models using cohesive element modeling were established. Then, the quantitative rules of fluid pressure, fracture length, fracture aperture, fracture area, tensile failure rate, and the fractal dimension of fracture morphology under different fracturing cluster numbers were revealed. The following understandings are mainly drawn:
(1) There are several main stages of fracture propagation in multi cluster fracturing, including: ① fracture initiation stage; ② Stage of perforation gap competition propagation; ③ The mutual influence and propagation stage of the main fractures within the cluster; ④ Main seam extension stage. Meanwhile, as the number of fracturing clusters increases, the ability of the main fracture in the reservoir to expand from single wing to double wing decreases, and the phenomenon of single wing propagation intensifies.
(2) As the interface stiffness increases, the number of fracture elements increases, the total area of fractures increases, and the volume of fractures decreases. Meanwhile, comparing the results of single cluster fracturing, as the number of fracturing clusters increases, the model shows a significant decrease in the influence of rock interface stiffness. As the cluster spacing increases, the number of fracture elements and total fracture area in the simulation model show an increasing trend. Meanwhile, the final increase in cluster spacing from single cluster to six clusters and from six clusters to twelve clusters is relatively similar. The injection point fracture width and maximum fracture width exhibit significant randomness, making it difficult to use for direct quantitative analysis. The total volume of fractures shows a certain downward trend with the increase of cluster spacing. From the fractal quantification results of fracture morphology, as the number of fracturing clusters increases, it is easier to form complex fractures within the reservoir research area.
(3) It is worth mentioning that when only considering the maximum cuboid calibration area of reservoir fractures for analysis, an increase of 5 clusters was achieved from single cluster fracturing to six clusters fracturing, achieving a fractal dimension increase of nearly 0.08. From six clusters to twelve clusters fracturing, an increase of six clusters was achieved, achieving a fractal dimension increase of nearly 0.06. This indicates that using fracturing clusters of about six clusters in this model reservoir may have higher economic efficiency.
The raw data supporting the conclusion of this article will be made available by the authors, without undue reservation.
BZ: Conceptualization, Project administration, Resources, Supervision, Writing–original draft, Writing–review and editing. MW: Investigation, Methodology, Visualization, Writing–original draft. YS: Conceptualization, Investigation, Project administration, Resources, Supervision, Writing–review and editing. YG: Supervision, Writing–review and editing. JF: Investigation, Methodology, Supervision, Writing–review and editing. JG: Project administration, Validation, Writing–review and editing. JL: Investigation, Supervision, Writing–review and editing.
The author(s) declare financial support was received for the research, authorship, and/or publication of this article. The authors gratefully acknowledge the financial support given by Open Research Fund of State Key Laboratory of Geomechanics and Geotechnical Engineering, Institute of Rock and Soil Mechanics, Chinese Academy of Sciences, Grant No. SKLGME022020, and Hubei Provincial Natural Science Foundation (Grant No. 2022CFB400).
Authors BZ, JF, and JG were employed by Shale Gas Research Institute of PetroChina Southwest Oil and Gas Field Company.
The remaining authors declare that the research was conducted in the absence of any commercial or financial relationships that could be construed as a potential conflict of interest.
All claims expressed in this article are solely those of the authors and do not necessarily represent those of their affiliated organizations, or those of the publisher, the editors and the reviewers. Any product that may be evaluated in this article, or claim that may be made by its manufacturer, is not guaranteed or endorsed by the publisher.
Costa, L. D., Rodrigues, F. A., Travieso, G., and Boas, P. R. V. (2007). Characterization of complex networks: a survey of measurements. Adv. Phys. 56 (1), 167–242. doi:10.1080/00018730601170527
Cramer, D., Friehauf, K., Roberts, G., and Whittaker, J. (2019). in SPE Hydraulic Fracturing Technology Conference and Exhibition D031S007R001.
Dahi Taleghani, A., Gonzalez-Chavez, M., Yu, H., and Asala, H. (2018). Numerical simulation of hydraulic fracture propagation in naturally fractured formations using the cohesive zone model. J. Petroleum Sci. Eng. 165, 42–57. doi:10.1016/j.petrol.2018.01.063
Feng, S., Wu, Y., Liu, Y., Li, X., Wang, X., and Chen, P. (2021). A fractal analysis of radon migration in discrete fracture network model. Chemosphere 266, 129010. doi:10.1016/j.chemosphere.2020.129010
Guo, F., Morgenstern, N. R., and Scott, J. D. (1993). Interpretation of hydraulic fracturing breakdown pressure. Int. J. Rock Mech. Min. Sci. Geomechanics Abstr. 30 (6), 617–626. doi:10.1016/0148-9062(93)91221-4
Huang, L., Dontsov, E., Fu, H., Lei, Y., Weng, D., and Zhang, F. (2022). Hydraulic fracture height growth in layered rocks: perspective from DEM simulation of different propagation regimes. Int. J. Solids Struct. 238, 111395. doi:10.1016/j.ijsolstr.2021.111395
Huang, L., Liu, J., Zhang, F., Dontsov, E., and Damjanac, B. (2019). Exploring the influence of rock inherent heterogeneity and grain size on hydraulic fracturing using discrete element modeling. Int. J. Solids Struct. 176-177, 207–220. doi:10.1016/j.ijsolstr.2019.06.018
Huang, L., Tan, J., Fu, H., Liu, J., Chen, X., Liao, X., et al. (2023). The non-plane initiation and propagation mechanism of multiple hydraulic fractures in tight reservoirs considering stress shadow effects. Eng. Fract. Mech. 2023, 109570. doi:10.1016/j.engfracmech.2023.109570
Jiang, C., Niu, B., Yin, G., Zhang, D., Yu, T., and Wang, P. (2019). CT-based 3D reconstruction of the geometry and propagation of hydraulic fracturing in shale. J. Petroleum Sci. Eng. 179, 899–911. doi:10.1016/j.petrol.2019.04.103
Ju, Y., Liu, P., Chen, J., Yang, Y., and Ranjith, P. G. (2016). CDEM-based analysis of the 3D initiation and propagation of hydrofracturing cracks in heterogeneous glutenites. J. Nat. Gas Sci. Eng. 35, 614–623. doi:10.1016/j.jngse.2016.09.011
Lai, J., Wang, G. W., Wang, Z. Y., Chen, J., Pang, X. J., Wang, S. C., et al. (2018). A review on pore structure characterization in tight sandstones. Earth-Sci Rev. 177, 436–457. doi:10.1016/j.earscirev.2017.12.003
Lecampion, B., and Desroches, J. (2015). Simultaneous initiation and growth of multiple radial hydraulic fractures from a horizontal wellbore. J. Mech. Phys. Solids 82, 235–258. doi:10.1016/j.jmps.2015.05.010
Lee, Y. H., Carr, J. R., Barr, D. J., and Haas, C. J. (1990). The fractal dimension as a measure of the roughness of rock discontinuity profiles. Int. J. Rock Mech. Min., 27(6), 453–464. doi:10.1016/0148-9062(90)90998-H
Li, S., and Ghosh, S. (2006). Multiple cohesive crack growth in brittle materials by the extended Voronoi cell finite element model. Int. J. Fract. 141 (3-4), 373–393. doi:10.1007/s10704-006-9000-2
Liu, C., Jin, X., Shi, F., Lu, D., Liu, H., and Wu, H. (2018). Numerical investigation on the critical factors in successfully creating fracture network in heterogeneous shale reservoirs. J. Nat. Gas Sci. Eng. 59, 427–439. doi:10.1016/j.jngse.2018.09.019
Liu, Q., Li, J., Liang, B., Liu, J., Sun, W., He, J., et al. (2023). Complex wettability behavior triggering mechanism on imbibition: a model construction and comparative study based on analysis at multiple scales. Energy 275, 127434. doi:10.1016/j.energy.2023.127434
Luo, H., Xie, J., Huang, L., Wu, J.-f., Shi, X., Bai, Y., et al. (2022). Multiscale sensitivity analysis of hydraulic fracturing parameters based on dimensionless analysis method, Lithosphere 9708300. doi:10.2113/2022/9708300
Meng, M., Chen, Z., Liao, X., Wang, J., and Shi, L. (2020). A well-testing method for parameter evaluation of multiple fractured horizontal wells with non-uniform fractures in shale oil reservoirs. Adv. Geo-Energy Res. 4 (2), 187–198. doi:10.26804/ager.2020.02.07
Modeland, N., Buller, D., and Chong, K. K. (2011). in North American Unconventional Gas Conference and Exhibition SPE-144120-MS.
Moghadasi, R., Rostami, A., and Hemmati-Sarapardeh, A. (2019). Application of nanofluids for treating fines migration during hydraulic fracturing: experimental study and mechanistic understanding. Adv. Geo-Energy Res. 3 (2), 198–206. doi:10.26804/ager.2019.02.09
Qin, X., Zhou, Y., and Sasmito, A. P. (2019). An effective thermal conductivity model for fractal porous media with rough surfaces. Adv. Geo-Energy Res. 3 (2), 149–155. doi:10.26804/ager.2019.02.04
Qiu, G., Chang, X., Li, J., Guo, Y., Wang, L., Ma, H., et al. (2023). Study on rock brittleness characteristics of deep volcanic reservoir under different confining pressures. J. Petroleum Explor. Prod. Technol. doi:10.1007/s13202-023-01717-z
Réthoré, J., de Borst, R., and Abellan, M.-A. (2008). A two-scale model for fluid flow in an unsaturated porous medium with cohesive cracks. Comput. Mech. 42 (2), 227–238. doi:10.1007/s00466-007-0178-6
Rougier, E., Munjiza, A., Lei, Z., Chau, V. T., Knight, E. E., Hunter, A., et al. (2019). The combined plastic and discrete fracture deformation framework for finite-discrete element methods. Int. J. Numer. Methods Eng. 121, 1020–1035. doi:10.1002/nme.6255
Shi, D., Li, L., Guo, Y., Liu, J., Tang, J., Chang, X., et al. (2023). Estimation of rough fracture network permeability using fractal and topology theories. Gas Sci. Eng. 116, 205043. doi:10.1016/j.jgsce.2023.205043
Song, R., Liu, J., and Cui, M. (2017). A new method to reconstruct structured mesh model from micro-computed tomography images of porous media and its application. Int. J. Heat Mass Transf. 109, 705–715. doi:10.1016/j.ijheatmasstransfer.2017.02.053
Song, R., Liu, J., Yang, C., and Sun, S. (2022a). Study on the multiphase heat and mass transfer mechanism in the dissociation of methane hydrate in reconstructed real-shape porous sediments. Energy 254, 124421. doi:10.1016/j.energy.2022.124421
Song, R., Wang, Y., Ishutov, S., Zambrano-Narvaez, G., Hodder, K. J., Chalaturnyk, R. J., et al. (2020). A comprehensive experimental study on mechanical behavior, microstructure and transport properties of 3D-printed rock analogs. Rock Mech. Rock Eng. 53 (12), 5745–5765. doi:10.1007/s00603-020-02239-4
Song, R., Wang, Y., Tang, Y., Jiajun, p., Liu, J., and Yang, C. (2022b). 3D Printing of natural sandstone at pore scale and comparative analysis on micro-structure and single/two-phase flow properties. Energy 261, 125226. doi:10.1016/j.energy.2022.125226
Tan, P., Chen, Z., Fu, S., and Zhao, Q. (2023). Experimental investigation on fracture growth for integrated hydraulic fracturing in multiple gas bearing formations. Geoenergy Sci. Eng. 231, 212316. doi:10.1016/j.geoen.2023.212316
Wang, H. (2016). Numerical investigation of fracture spacing and sequencing effects on multiple hydraulic fracture interference and coalescence in brittle and ductile reservoir rocks. Eng. Fract. Mech. 157, 107–124. doi:10.1016/j.engfracmech.2016.02.025
Wang, H. (2019). Hydraulic fracture propagation in naturally fractured reservoirs: complex fracture or fracture networks. J. Nat. Gas Sci. Eng. 68, 102911. doi:10.1016/j.jngse.2019.102911
Wei, W., Cai, J. C., Hu, X. Y., and Han, Q. (2015). An electrical conductivity model for fractal porous media. Geophys Res. Lett. 42 (12), 4833–4840. doi:10.1002/2015gl064460
Wu, M., Gao, K., Liu, J., Song, Z., and Huang, X. (2022). Influence of rock heterogeneity on hydraulic fracturing: a parametric study using the combined finite-discrete element method. Int. J. Solids Struct. 234-235, 111293. doi:10.1016/j.ijsolstr.2021.111293
Wu, M., Jiang, C., Song, R., Liu, J., Li, M., Liu, B., et al. (2023). Comparative study on hydraulic fracturing using different discrete fracture network modeling: insight from homogeneous to heterogeneity reservoirs. Eng. Fract. Mech. 284, 109274. doi:10.1016/j.engfracmech.2023.109274
Wu, M., Wang, W., Shi, D., Song, Z., Li, M., and Luo, Y. (2021). Improved box-counting methods to directly estimate the fractal dimension of a rough surface. Measurement 177, 109303. doi:10.1016/j.measurement.2021.109303
Wu, M., Wang, W., Zhang, D., Deng, B., Liu, S., Lu, J., et al. (2020). The pixel crack reconstruction method: from fracture image to crack geological model for fracture evolution simulation. Constr. Build. Mater. 273, 121733. doi:10.1016/j.conbuildmat.2020.121733
Wu, Z., Sun, H., and Wong, L. N. Y. (2019). A cohesive element-based numerical manifold method for hydraulic fracturing modelling with voronoi grains. Rock Mech. Rock Eng. 52 (7), 2335–2359. doi:10.1007/s00603-018-1717-5
WuM., , Liu, J., Lv, X., Shi, D., and Zhu, Z. (2018). A study on homogenization equations of fractal porous media. J. Geophys. Eng. 15 (6), 2388–2398. doi:10.1088/1742-2140/aac4c1
WuZ., , Xu, X., Liu, Q., and Yang, Y. (2018). A zero-thickness cohesive element-based numerical manifold method for rock mechanical behavior with micro-Voronoi grains. Eng. Analysis Bound. Elem. 96, 94–108. doi:10.1016/j.enganabound.2018.08.005
Xavier, J., Oliveira, M., Morais, J., and De Moura, M. (2014). Determining mode II cohesive law of Pinus pinaster by combining the end-notched flexure test with digital image correlation. Constr. Build. Mater. 71, 109–115. doi:10.1016/j.conbuildmat.2014.08.021
Xiang, J., Munjiza, A., Latham, J.-P., and Guises, R. (2009). On the validation of DEM and FEM/DEM models in 2D and 3D. Eng. Comput. 26 (6), 673–687. doi:10.1108/02644400910975469
Xie, H. P., and Wang, J. A. (1999). Direct fractal measurement of fracture surfaces. Int. J. Solids Struct., 36(20), 3073–3084. doi:10.1016/S0020-7683(98)00141-3
Yan, C., Jiao, Y.-Y., and Zheng, H. (2018). A fully coupled three-dimensional hydro-mechanical finite discrete element approach with real porous seepage for simulating 3D hydraulic fracturing. Comput. Geotechnics 96, 73–89. doi:10.1016/j.compgeo.2017.10.008
Yan, X., Sun, Z., and Dong, Q. (2021). The unified pipe-interface element method for simulating the coupled hydro-mechanical grouting process in fractured rock with fracture propagation. Eng. Fract. Mech. 256, 107993. doi:10.1016/j.engfracmech.2021.107993
Yan, X., and Yu, H. (2022). Numerical simulation of hydraulic fracturing with consideration of the pore pressure distribution based on the unified pipe-interface element model. Eng. Fract. Mech. 275, 108836. doi:10.1016/j.engfracmech.2022.108836
Yang, R., Wang, Y., Song, G., and Shi, Y. (2023). Fracturing and thermal extraction optimization methods in enhanced geothermal systems. Adv. Geo-Energy Res. 8 (2), 136–140. doi:10.46690/ager.2023.08.07
Yuan, J., Jiang, R., and Zhang, W. (2018). The workflow to analyze hydraulic fracture effect on hydraulic fractured horizontal well production in composite formation system. Adv. Geo-Energy Res. 2 (3), 319–342. doi:10.26804/ager.2018.03.09
Zhang, H., Chen, J., Li, Z., Hu, H., and Mei, Y. (2023). Numerical simulation of multi-cluster fracturing using the triaxiality dependent cohesive zone model in a shale reservoir with mineral heterogeneity. Rock Mech. Rock Eng. doi:10.1007/s00603-023-03527-5
Zheng, Y., He, R., Huang, L., Bai, Y., Wang, C., Chen, W., et al. (2022). Exploring the effect of engineering parameters on the penetration of hydraulic fractures through bedding planes in different propagation regimes. Comput. Geotechnics 146, 104736. doi:10.1016/j.compgeo.2022.104736
Keywords: deep shale, multi cluster fracturing, fracture morphology, fracture propagation, fractal dimension
Citation: Zeng B, Wu M, Su Y, Guo Y, Feng J, Gui J and Lu J (2024) Study on the fracture propagation law of deep shale reservoir under the influence of different number of fracturing clusters. Front. Energy Res. 11:1342254. doi: 10.3389/fenrg.2023.1342254
Received: 21 November 2023; Accepted: 13 December 2023;
Published: 08 January 2024.
Edited by:
Liuke Huang, Southwest Petroleum University, ChinaCopyright © 2024 Zeng, Wu, Su, Guo, Feng, Gui and Lu. This is an open-access article distributed under the terms of the Creative Commons Attribution License (CC BY). The use, distribution or reproduction in other forums is permitted, provided the original author(s) and the copyright owner(s) are credited and that the original publication in this journal is cited, in accordance with accepted academic practice. No use, distribution or reproduction is permitted which does not comply with these terms.
*Correspondence: Yuliang Su, c3V5dWxpYW5nQHVwYy5lZHUuY24=
Disclaimer: All claims expressed in this article are solely those of the authors and do not necessarily represent those of their affiliated organizations, or those of the publisher, the editors and the reviewers. Any product that may be evaluated in this article or claim that may be made by its manufacturer is not guaranteed or endorsed by the publisher.
Research integrity at Frontiers
Learn more about the work of our research integrity team to safeguard the quality of each article we publish.