 Guangjian Zhang
 Xiufei Yang
 Yan Li1
- 1Research Center of Fluid Machinery Engineering and Technology, Jiangsu University, Zhenjiang, China
- 2Wenling Fluid Machinery Technology Institute of Jiangsu University, Wenling, China
The non-cavitating and cavitating wake flow of a circular cylinder, which contains multiscale vortices, is numerically investigated by Large Eddy Simulation combined with the Schnerr–Sauer cavitation model in this paper. In order to investigate the spatiotemporal evolution of cavitation vortex structures, the Proper Orthogonal Decomposition (POD) method is employed to perform spatiotemporal decomposition on the cylinder wake flow field obtained by numerical simulation. The results reveal that the low-order Proper Orthogonal Decomposition modes correspond to large-scale flow structures with relatively high energy and predominantly single frequencies in both non-cavitating and cavitating conditions. The presence of cavitation bubbles in the flow field leads to a more pronounced deformation of the vortex structures in the low-order modes compared to the non-cavitating case. The dissipation of pressure energy in the cylinder non-cavitating wake occurs faster than the kinetic energy. While in the cavitating wake, the kinetic energy dissipates more rapidly than the pressure energy.
1 Introduction
Vortex cavitation is a common physical phenomenon in hydraulic machinery (Arndt, 1981; Lei et al., 2014; Tan et al., 2015), typically occurring at the inlet and outlet edges of hydraulic components (Gu et al., 2024) and at the rear of flow-obstructing bodies (Leonard and Koumoutsakos, 1993; Li et al., 2019; Ghahramani et al., 2020). Cavitation induces fluctuations in fluid pressure within the flow field (Liu et al., 2020; Ji et al., 2020), resulting in uneven surface load distribution on flow components and generating hydrodynamic noise (Sadri and Kadivar, 2023). In severe cases, it can lead to cavitation damage on flow components (Zhang et al., 2016), thereby affecting the operational stability of hydraulic machinery. To mitigate the adverse effects of cavitation on hydraulic machinery, a clear and comprehensive understanding of the evolution mechanism of cavitation vortex structures is imperative. However, direct investigation of cavitation vortex shedding characteristics through hydraulic machinery is extremely challenging. Commonly used hydraulic machinery in engineering exhibits not only com-plex structures but also necessitates substantial computational resources for numerical simulations. Simultaneously, the influence of dynamic and static flow components on each other complicates the accurate capture of intricate vortex systems (Lei et al., 2018). Flow around a circular cylinder is one of the classical problems in fluid mechanics (Berger and Wille, 1972). At low Reynolds numbers, the flow is steady, and as the Reynolds number gradually in-creases, vortex shedding occurs around the cylinder, eventually forming a pair of wake vortices. At higher Reynolds numbers, the wake vortices become unstable, leading to periodic oscillations and the formation of a von Kármán vortex street (Williamson, 1996). Studies have revealed (Norberg, 2003; Desai et al., 2020) that at high Reynolds numbers, the wake flow field around a cylinder exhibits a rich array of multiscale vortex structures. Starting from the separation points on the upper and lower surfaces of the cylinder, multiscale vortex structures emerge continuously relative to spatial scales. These vortex structures of different scales constitute the unique multiscale vortex system in the wake flow field, making it an ideal model for studying vortex cavitation characteristics (Kumar et al., 2017; Dobroselsky, 2019; Brandao et al., 2020).
For vortex cavitation, accurately describing and understanding the complex variations in flow structures and the mechanisms of instability are crucial. Among the various methods for obtaining main flow structures, Proper Orthogonal Decomposition (POD) has been widely utilized (Berkooz et al., 1993; Holmes et al., 1997; Hu et al., 2023). The POD method is an efficient order reduced technique, grounded in the core principle of identifying an optimal set of standard orthogonal bases (Chatterjee, 2000). These bases are chosen to maximize the successive reduction of the projection of sample data onto them. By selectively retaining the larger projections (containing higher energy), the first few modes are captured. Consequently, this method allows for the representation of the majority of the flow energy with a limited number of low-order POD modes. The classic POD method was first introduced to the fluid-dynamics community by Lumley (Lumley, 1967) as an attempt to reveal the elusive coherent structures that populate turbulent flows. Then Sirovich et al. (Sirovich, 1987a; Sirovich, 1987b) improved the classical POD method by introducing the Snapshot POD approach. In this method, the concept of spatiotemporal transformation is applied, enabling the POD method to handle complex flow fields effectively. The effectiveness of POD has been validated by numerical and experimental studies in analyzing coherent structures. Utturkar et al. (Utturkar et al., 2005) stated that this modal analysis enables to discern the flow structures obtained in numerical simulations considering various turbulence models. Danlos et al. (Danlos et al., 2014) studied the effect of surface roughness on the cavitation shedding behavior using longitudinal grooves, and applied POD on snapshots to classify the cavitation regime of sheet or cloud cavity. Results show that the phase portraits, the Lissajous figure, and the energy content of the first mode are validated to identify different regimes. Miyanawala et al. (Miyanawala and Jaiman, 2019) used the POD method to analyze the dominant coherent structures of wake flow around a square cylinder. Smith et al. (Smith et al., 2020) employed the POD method to identify various cloud cavitation shedding modes by their spatial locations. In this paper, in order to investigate the spatiotemporal evolution mechanism of cavitation vortex structures and reveal the interactions between multiscale vortex systems and cavitation, we employ the POD method to perform spatiotemporal decomposition on the wake flow field around a cylinder and make a comprehensive comparative analysis in the cavitating and non-cavitating conditions.
2 Methodology
2.1 Governing equations and the LES approach
The cavitating flow involves liquid and vapor phases. In this work, the homogeneous mixture model was adopted, assuming the multiphase fluid components share the same velocity and pressure. The mass and momentum conservation equations for the mixture flow are shown as follows:
where
In order to solve the above conservation equations, the LES approach was used, carrying out filtering in a small-space area, and dividing the turbulent flow into large-scale motion and small-scale motion. The large-scale motion is solved directly while the small-scale motion is modelled using the Smagorinsky-Lilly subgrid-scale model.
2.2 Cavitation model
The mass transfer between the vapor and liquid phases in cavitating flows is depicted using the following governing equation:
The source terms
where
2.3 Numerical setup
The computational model is shown in Figure 1. The cylinder diameter D is 9.5 mm, and the two-dimensional computational domain is 60D × 30D with an upstream dimension 10D and a downstream dimension 50D. The computational domain is discretized using structured grids, and the grids in the cylinder surface and wake region are locally refined. The total number of elements is about 336,000 and the average wall y + value is less than 4.6.
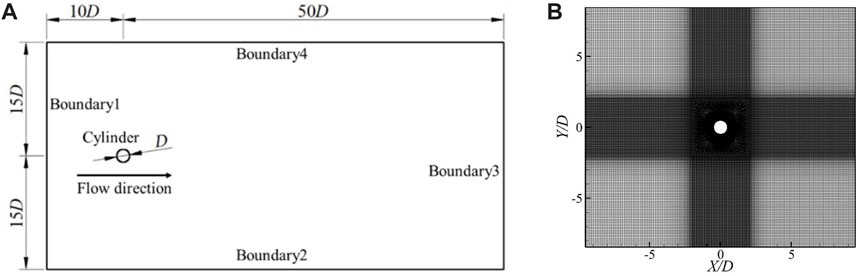
FIGURE 1. Computational model: (A) computational domain; (B) local grids.
In the present study, the commercial software Fluent is employed for numerical simulation. Boundary 1 of the computational domain is set as a velocity inlet with a value
2.4 Proper orthogonal decomposition
The core idea of the POD method is to search for the optimal orthogonal basis function space in terms of mean-square sense from a set of spatial data of time series. It uses a smaller number of orthogonal bases to approximate the high-order data description. The flow field information in this study is derived from CFD simulation results, primarily encompassing pressure and velocity fields. The initial step involves selecting a set of sample snapshots. Specifically, N snapshots at different time instants are chosen at equal time intervals from the numerical simulation results. These snapshots constitute a sample information matrix
In general, the spatial length M is much larger than the time length N. Therefore, the covariance matrix constructed from the sample snapshot set
Compute the time average of each collected sample,
The pulsating flow field can be obtained by subtracting the time average from the original sample snapshot,
The next step is to compute the covariance matrix C,
We then compute the eigenvalues and eigenvectors of C,
where
The energy of each order of POD mode can be characterized by the eigenvalues λ. Based on the decomposed modes and their corresponding modal coefficients, one can select the first modes with a high percentage of energy for flow field reconstruction. For instance, if you choose to use k modes, the reconstructed flow field at any given time can be expressed as:
3 Results and discussion
To provide a comprehensive view of transient flow field information, we extracted 200 transient data files for the wake flow around a cylinder under both non-cavitating and cavitating flow conditions. The total duration covered by these 200 transient files corresponds to 20 quasi-periods of the cylinder’s surface lift coefficient for each respective operating condition. For each of these 200 transient files, velocity field snapshots and pressure field snapshots were extracted. Subsequently, the POD on the flow field was performed using MATLAB R2016b.
3.1 Analysis of wake flow field around a cylinder without cavitation
In the non-cavitating case, the first six modes of proper orthogonal decomposition of the wake flow around the cylinder, using the transient pressure field, are shown in Figure 2. The first six POD modes using the transient velocity field are depicted in Figure 3.
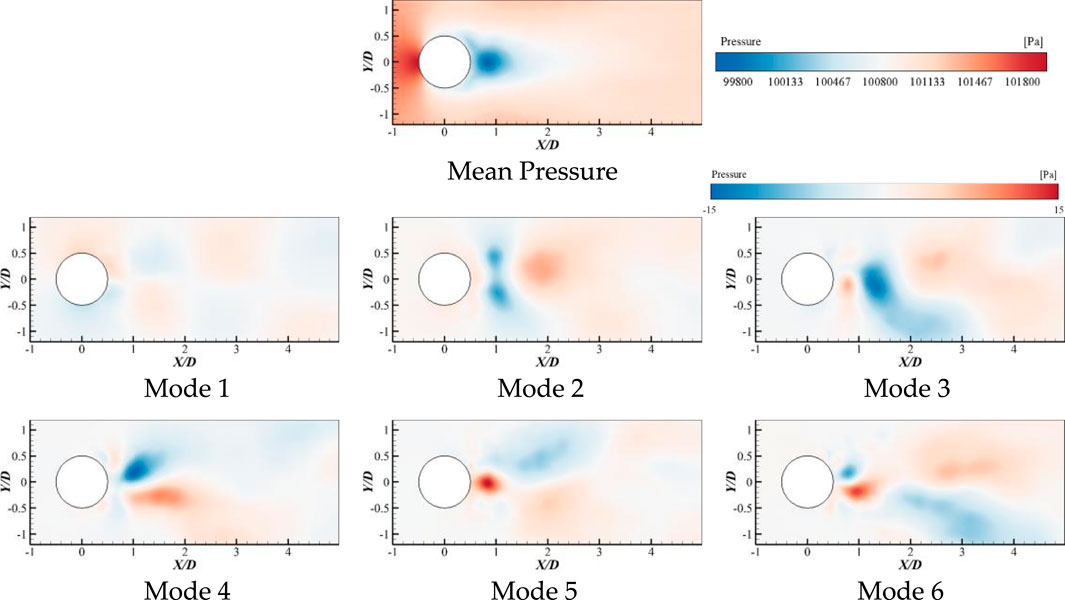
FIGURE 2. Mean pressure field and the first six POD modes based on pressure field (without cavitation).
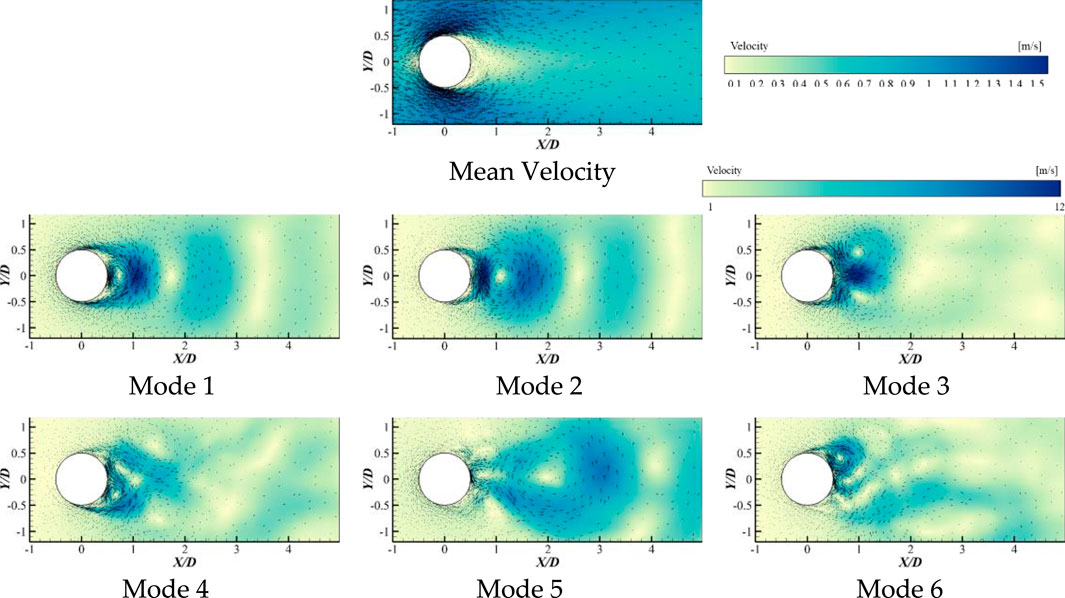
FIGURE 3. Mean velocity field and the first six POD modes based on velocity field (without cavitation).
From the average pressure field, it can be observed that the non-cavitating wake flow field around the cylinder exhibits basically symmetry about the wake centerline. The region near the leading-edge stagnation point corresponds to the highest average pressure area, while the region near the trailing edge stagnation point represents the lowest average pressure area. When examining the spatial distribution of various order of POD modes of the fluctuating pressure field, it becomes evident that with an increase in mode order, different degrees of localized high-pressure and low-pressure regions appear alternately within the wake flow field around the cylinder. Additionally, the pressure in the wake flow field exhibits an asymmetric distribution along the wake centerline. This asymmetry primarily arises from the interactions and evolution of multi-scale vortices generated within the wake flow field.
From the average velocity field, it is evident that, in the non-cavitating case, the average flow field in the wake region around the cylinder exhibits a symmetric distribution about the wake centerline basically. The areas near the leading-edge stagnation point and trailing-edge stagnation point correspond to the lowest average velocity regions, while the regions near the upper and lower surfaces of the cylinder represent the highest average velocity areas. Examining the spatial distribution of various order of POD modes of the fluctuating velocity field, it becomes apparent that in the lower-order modes, the flow structures corresponding to fluctuating velocity are concentrated in the region near the trailing-edge stagnation point and exhibit basic symmetry about the wake centerline. For instance, in modes 1 and 2, two large, oppositely oriented vortices are present in the region near the trailing-edge stagnation point, and both are distributed along the wake centerline. In mode 2, two smaller shedding vortices are observed near the upper and lower surfaces of the cylinder. In mode 3, two similarly sized and oppositely oriented vortices are present on the cylinder’s rear surface and near the wake region, with smaller shedding vortices on the cylinder’s surface. Starting from mode 4, the vortex structures in the wake flow field are no longer regular, their spatial distribution lacks strong symmetry, and the flow structures become more fragmented and finer.
Overall, in the non-cavitating wake flow field around the cylinder, the various order of modes obtained through POD of the two types of fluctuating fields tend to exhibit a transition toward finer and more intricate flow scales as the mode order increases.
The eigenvalues obtained through POD represent the energy content of various order mode. The maximum eigenvalue is related to the structure of the flow field with the maximum energy. The energy distribution of various order of POD modes based on fluctuating pressure field and fluctuating velocity field in the non-cavitating wake flow field around the cylinder is depicted in Figure 4.
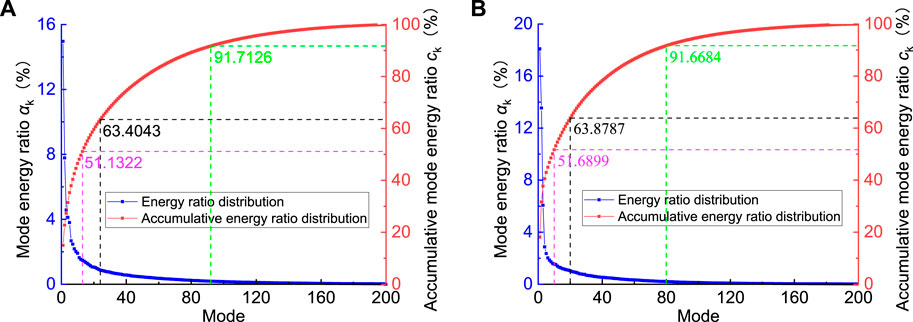
FIGURE 4. Energy distribution of all POD modes based on pulsating pressure field (A) and pulsating velocity field (B) in the non-cavitating case.
Research has shown that in the case of flow around a square cylinder at Re = 100, the first four POD modes account for 99.4% of the total energy (Wang et al., 2014). In contrast, for the wake flow field around a cylinder at Re = 9500, the initial modes do not contain a significant portion of the energy, and it takes up to the 80th mode to reach 91.67% of the total energy, highlighting the complexity of the flow at Re = 9500. In the non-cavitating wake flow around the circular cylinder, compared to the energy distribution of various POD modes based on the fluctuating velocity field, the energy content in the lower-order modes corresponding to the fluctuating pressure field is lower. In contrast, the higher-order modes correspond to smaller-scale flow structures and have a higher energy contribution, eventually dissipating in the form of heat. These results indicate that in the non-cavitating wake flow around the circular cylinder, the dissipation of pressure energy occurs faster than the dissipation of kinetic energy.
After decomposing the flow field by the POD method, the flow structures corresponding to the low-order modes exhibit “coherent” characteristics. The coherence of the flow structures between modes mainly refer to the similarity in time evolution characteristics of adjacent modes, with a specific phase difference, as shown in Figure 5. The modal coefficients representing the time evolution characteristics of each selected flow field structure are subjected to FFT transformation to obtain the frequency characteristics of the corresponding flow structures for different modes, as shown in Figure 6.
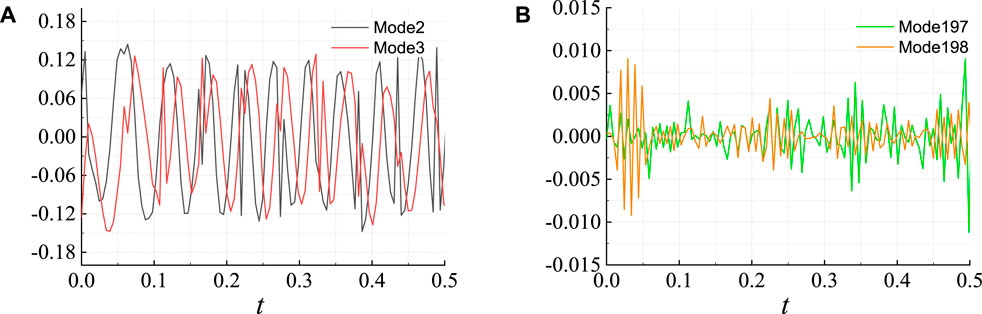
FIGURE 5. Variation of POD modal coefficients of the non-cavitating wake flow around the cylinder based on pulsating pressure field: (A) low order modes; (B) high order modes.
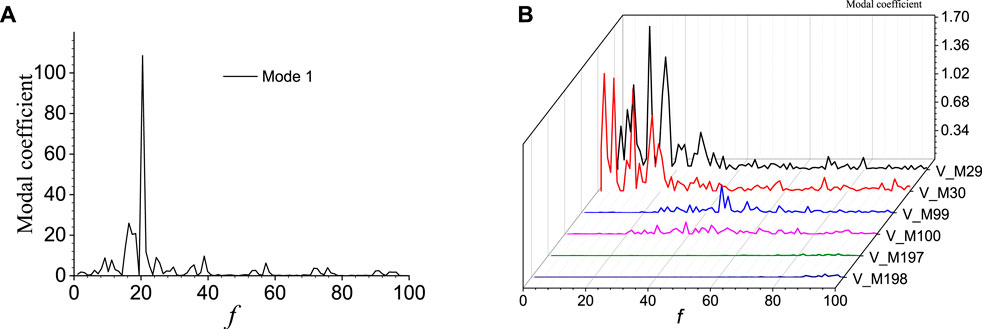
FIGURE 6. Frequency characteristics of POD modal coefficients of the non-cavitating wake flow around the cylinder based on pulsating pressure field: (A) mode 1; (B) higher order modes.
According to Figures 5A, 6A, it can be seen that the frequency composition component of the flow structures in low-order modes is relatively few, and the corresponding main frequency is distributed in the low-frequency band, which is consistent with the main frequency of vortex shedding in the non-cavitating wake flow. When the flow structures are in high-order modes, the frequency composition component is more complex, and both the wavelength and amplitude are significantly reduced compared to those in low-order modes. The fluctuation amplitude is uneven, and the wave composition is more complex, as shown in Figure 5B. Figure 6B shows the frequency distribution of flow structures corresponding to different modes. Modes 29 and 30 represent low-order modes, modes 99 and 100 represent intermediate modes, and modes 197 and 198 represent high-order modes. It can be seen that the frequency corresponding to low-order modes is concentrated in the low-frequency region, while that corresponding to high-order modes is concentrated in the high-frequency region. As the mode increases from low to high, the corresponding frequency also changes from low to high, and the frequency concentration area becomes wider, indicating that the flow structures in high-order modes exhibit multi-frequency characteristics.
In summary, as the modal order increases, the frequency of the flow structures in the wake flow around the circular cylinder at Re = 9500 gradually shifts towards high frequency and multi-frequency, indicating that the flow structures corresponding to each mode are not a single flow but are composed of multiple flow scales with different frequency characteristics.
According to the modal energy ratio curve in Figure 4, the first three modes contain relatively high energy ratios in the non-cavitating wake flow around the cylinder. Therefore, scatter plots of two-mode coefficients between each pair are conducted, as shown in Figure 7.
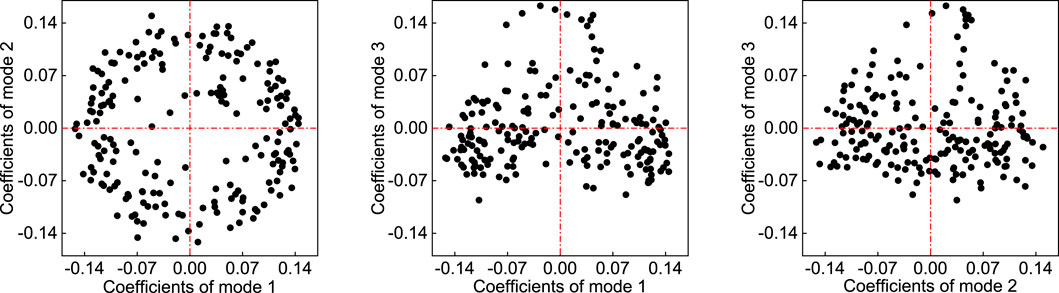
FIGURE 7. Scatter plot of modal coefficients (without cavitation).
Combined with modes 1 and 2 of the fluctuating velocity field, we can find that there are two opposite-directional vortices near the stagnation point behind the cylinder in mode 1, and the vortex near the stagnation point is stronger. In mode 2, there are also two opposite-directional vortices on the centerline near the stagnation point behind the cylinder, and these two shedding vortices are located at the edge region of two vortices in mode 1. The centers of these two vortices move away from the stagnation point. Meanwhile, there are two small shedding vortices attached symmetrically about the wake centerline on the surface of the cylinder. In mode 3, there are no longer any vortices on the centerline near the wake region. Instead, a pair of vortices with similar sizes and opposite directions are distributed symmetrically on both sides of the centerline near the wake region. The wake centerline region is where two vortex edges are squeezed together and their directions form a 180-degree angle with respect to the mainstream direction, which results in reverse impact on the stagnation point behind the cylinder and flow separation around it on its surface. Therefore, it can be seen from Figure 7 that there is a circular distribution of correlation between the two-mode coefficients being analyzed, indicating that the flow fields corresponding to both modes alternate cyclically.
According to POD modes, complex flows exist in the wake flow around a circular cylinder, including large-scale vortex structures as well as a large number of small-scale vortices. To identify dominant structures in the flow field more clearly, flow field reconstruction can be performed on decomposed flow fields. Figure 8 shows the pressure field reconstruction based using the first 13 modes with an energy content of 51.13% plus mean pressure field. Comparison shows that the POD-reconstructed flow field maintains overall characteristics of the original one. Local high-pressure and low-pressure areas as well as larger-scale vortex distributions in wake flow field are basically consistent with those in original flow field. Meanwhile, reconstructed flow fields remove small-scale flow structures from original ones, making the large-scale coherent structures smoother and more prominent.
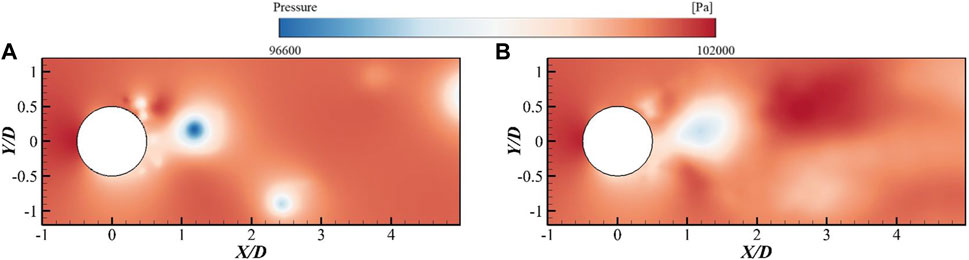
FIGURE 8. Flow field reconstruction [(A) original pressure field; (B) Reconstructed pressure field].
3.2 Analysis of cavitating wake flow field around a cylinder
The studied cavitation in the wake flow around a cylinder is induced by reducing the outlet pressure to a certain extent (
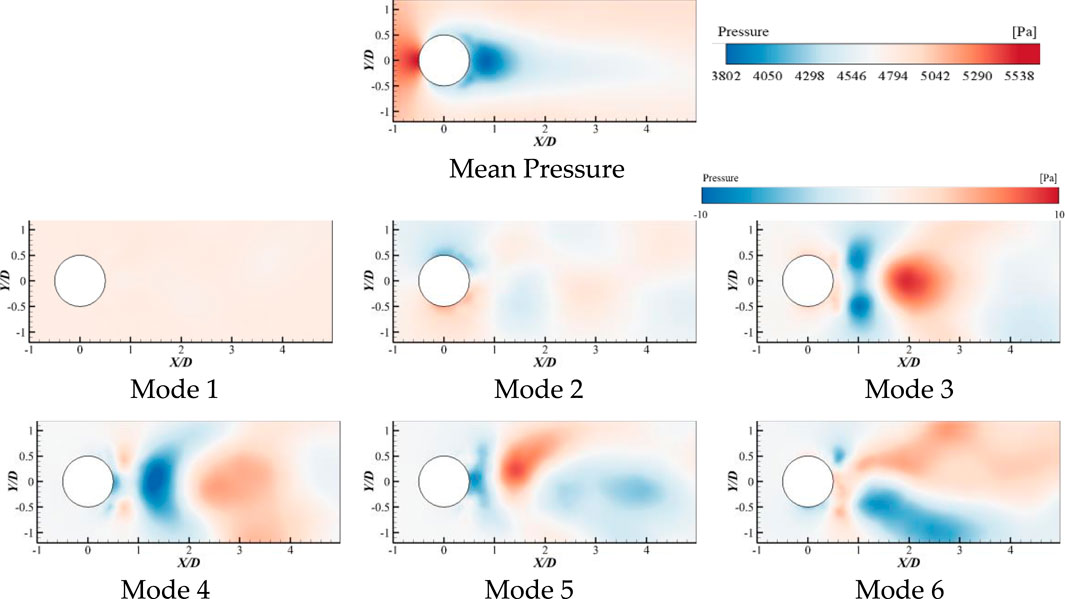
FIGURE 9. Mean pressure field and the first six POD modes based on pressure field (
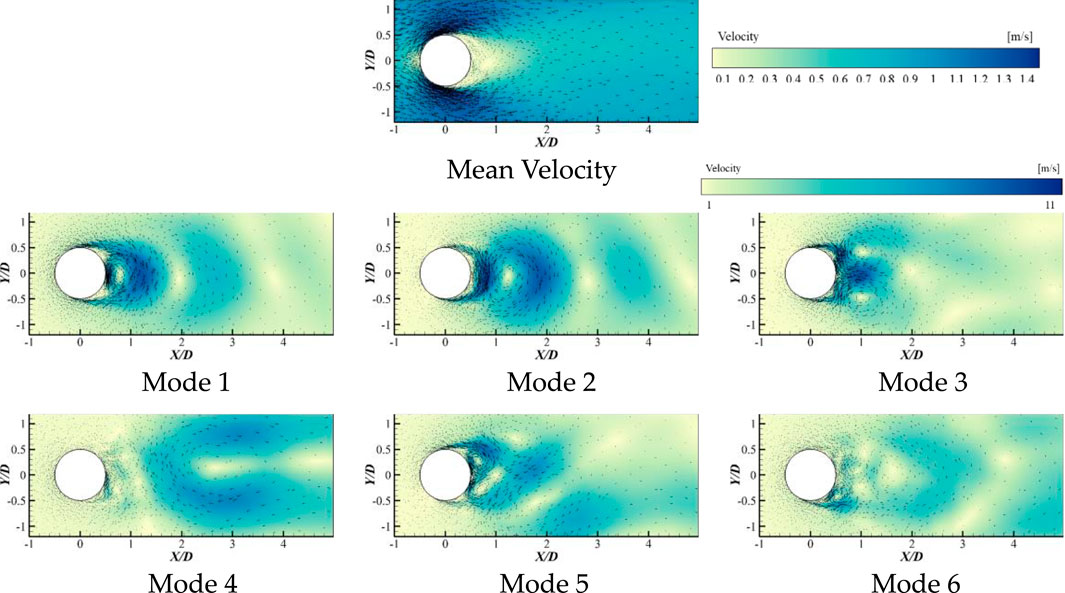
FIGURE 10. Mean velocity field and the first six POD modes based on velocity field (
From the average pressure field, it is evident that the cavitating wake flow field around the cylinder is also essentially symmetric about the centerline of the wake. The distribution trend is largely consistent with the trend of the average pressure field under non-cavitating conditions. However, under cavitation conditions, the area of the low-pressure region in the wake flow field significantly increases. This is primarily because under non-cavitating conditions, with increasing fluid velocity in the flow field, the local fluid pressure decreases. Thus, under non-cavitating conditions, the pressure in the flow field continues to decrease without restriction. However, after cavitation conditions are reached, when the pressure in the flow field drops below the saturated vapor pressure of the fluid, cavitation occurs. Existing cavitation models use pressure as a criterion to determine cavitation regions. Therefore, it is assumed that the pressure inside the cavitation is equal to the saturated vapor pressure of the liquid. This sets a lower limit on the pressure drop in regions with fast-flowing fluid, meaning that once the pressure drops to the saturated vapor pressure, it does not decrease further. Hence, under cavitation conditions, the area of low-pressure regions in the average pressure field is larger than that under non-cavitating conditions. Analyzing the spatial distribution of fluctuating pressure fields at various modes, it is observed that, apart from mode 1, starting from mode 2, the wake flow field exhibits alternating regions of varying degrees of local high and low pressure as the mode order increases. The distribution area is also larger than that under non-cavitating conditions. In mode 1, the pressure field structure in the wake region of the cylinder is predominantly characterized by high-pressure regions, with only occasional locally low-pressure regions near the centerline of the wake in the wake region, but with indistinct boundaries. As the mode order increases, due to the interaction of multiscale vortices in the wake flow field, the pressure exhibits characteristics of an asymmetric distribution along the centerline of the wake.
From the average velocity field, it is apparent that the average wake flow field around the cylinder under cavitation conditions is also essentially symmetric about the centerline of the wake. The specific distribution trend of the flow field is largely consistent with the flow field distribution under non-cavitating conditions. Examining the spatial distribution of various modes of flow in the fluctuating velocity field, it is observed that, compared to non-cavitating conditions, under cavitation conditions, the mode order with large-scale flow structures is increased in the near-wake region close to the rear stagnation point. Comparing low-order modes, it is found that the spatial distribution of flow structures in the first three modes under cavitation conditions is generally similar to that under non-cavitating conditions. However, in mode 2 under cavitation conditions, the directions of two larger-scale vortices are opposite to those under non-cavitating conditions. Meanwhile, among the modes under cavitation conditions, the flow structure of mode 5 is similar to that of mode 4 under non-cavitating conditions. This suggests that the generation of cavitation has a certain impact on the evolution of wake flow structures. Overall, the multiscale vortex structures in the fluctuating velocity field corresponding to various modes of flow under non-cavitating conditions are relatively regular, while under cavitation conditions, these structures undergo more severe deformation. Additionally, with the increase in mode order, the flow structures under cavitation conditions gradually exhibit more diverse small-scale flow characteristics.
The energy distribution of various modes obtained through Proper Orthogonal Decomposition based on the fluctuating pressure field and fluctuating velocity field in the cavitating wake flow around the cylinder is presented in Figure 11. The first mode of the fluctuating pressure field contributes to approximately 65.62% of the total energy, with the first five modes accounting for around 79.43%. For the fluctuating velocity field, the first eight modes contribute approximately 52.33% of the total energy, and the first 15 modes contribute about 64.24%. Clearly, the low-order modes of the fluctuating pressure field have a higher energy content than the fluctuating velocity field. Furthermore, in comparison to non-cavitating conditions, where the first 13 modes of the fluctuating pressure field contribute approximately 51.13% of the total energy, and the first 24 modes contribute around 63.40%, as well as the fluctuating velocity field with the first 10 modes contributing approximately 51.69% and the first 20 modes contributing approximately 63.88%, it is evident that under cavitation conditions, the low-order modes of both the fluctuating pressure field and fluctuating velocity field have higher energy content than under non-cavitating conditions. By comparing the modal structures based on the fluctuating pressure field under non-cavitating and cavitation conditions, it is observed that, under cavitation conditions, the pressure field structure becomes similar to that of non-cavitating conditions only from the second mode onward. The first mode under cavitation conditions exhibits a pressure field structure in the wake region characterized predominantly by high-pressure regions, with occasional locally low-pressure regions near the centerline of the wake, but with indistinct boundaries. Therefore, the structure of the first mode based on the fluctuating pressure field under cavitation conditions may be a contributing factor to the overall increase in energy content of the low-order modes.
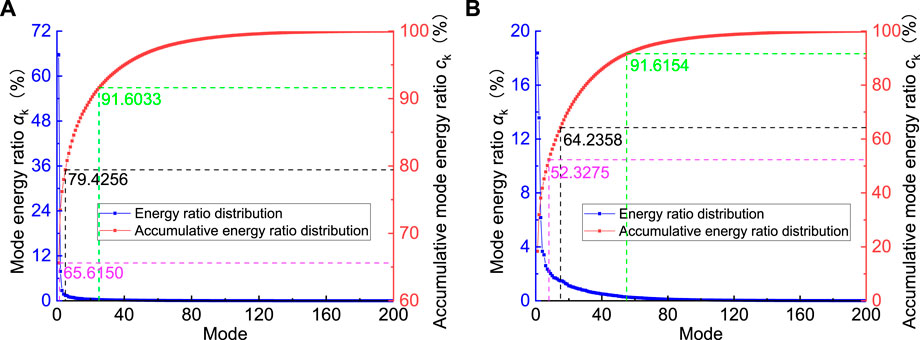
FIGURE 11. Energy distribution of all POD modes based on pulsating pressure field (A) and pulsating velocity field (B) (
In the cavitating wake flow field around the cylinder, in comparison to the energy distribution of various flow modes based on the fluctuating pressure field, the energy content in the structures corresponding to low-order modes in the fluctuating velocity field of is relatively low. Conversely, in the structures corresponding to high-order modes, there is a higher proportion of energy associated with small-scale flow structures, ultimately dissipating in the form of thermal energy. These results indicate that in the cavitating wake flow field around the cylinder, the dissipation of kinetic energy is faster than pressure energy, which is opposite to the situation under non-cavitating conditions.
The temporal and frequency domain distributions of POD modal coefficients for the cavitating wake flow field around the cylinder are illustrated in Figures 12, 13, respectively. In comparison to the non-cavitating conditions, the waveform characteristics of modal coefficients for various flow modes under cavitation conditions are generally similar. The frequencies predominantly exhibit low-frequency, singular characteristics corresponding to the low-order flow structures. Unlike the non-cavitating conditions, under cavitation conditions, the low-order flow structures in the wake flow field correspond to low characteristic frequencies, with relatively smaller amplitudes. As the modal order increases, the wavelength of the modal coefficients shortens, the amplitudes decrease, and the composition of the waves becomes more intricate. Simultaneously, the frequency characteristics of various flow structures tend to evolve towards higher frequency and multifrequency patterns. This suggests that under cavitation conditions, with increasing modal order, the flow structures in the wake flow field become more complex, demonstrating higher-frequency and multifrequency characteristics.
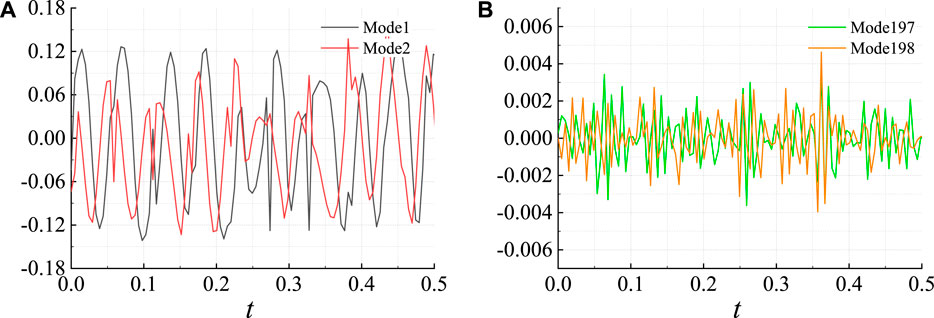
FIGURE 12. Variation of POD modal coefficients of the cavitating wake flow around the cylinder based on pulsating pressure field: (A) low order modes; (B) high order modes (
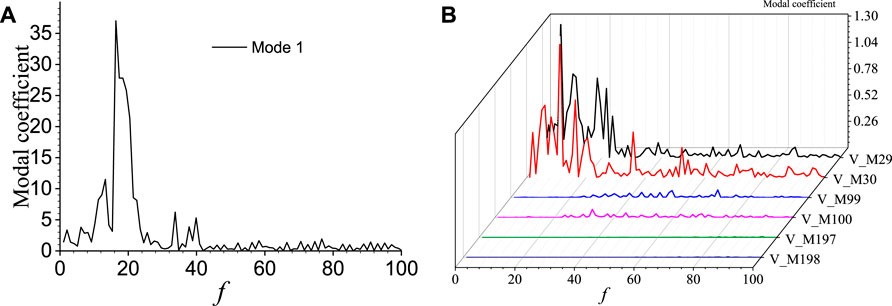
FIGURE 13. Frequency characteristics of POD modal coefficients of the cavitating wake flow around the cylinder based on pulsating pressure field: (A) mode 1; (B) higher order modes (
Scatter plots illustrating the pairwise relationship between the modal coefficients for the first three modes of the cavitating flow field are depicted in Figure 14. It can be observed that the correlation between the coefficients of the first and second modes exhibits a circular distribution, indicating that the flow field alternates cyclically between the first and second modes. The correlation between the coefficients of the first and third modes, as well as the second and third modes, displays a weaker circular distribution, suggesting that the flow field for these two modes alternates in a weak cyclic manner. This pattern aligns closely with the observations under non-cavitating conditions.
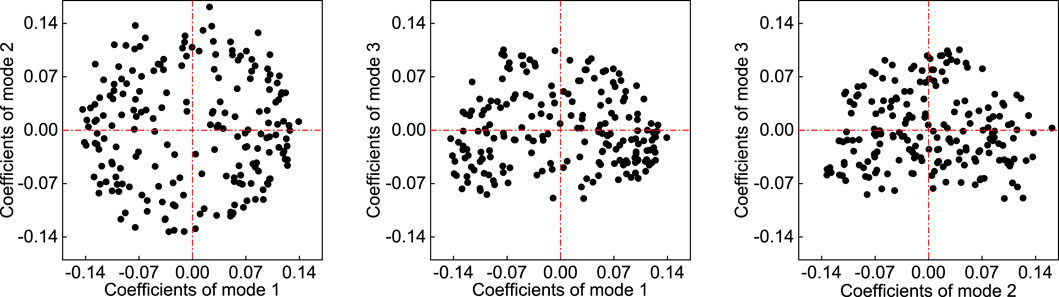
FIGURE 14. Scatter plot of modal coefficients (
To facilitate a clearer identification of dominant structures within the flow field, a reconstruction of the wake flow field around the cylinder under cavitation conditions can be performed. Figure 15 presents the reconstructed pressure field with the addition of the first mode, accounting for 65.62% of the energy, and the average pressure field. The left side of the figure displays the original pressure field at the same instant, while the right side shows the reconstructed pressure field. It is evident that the reconstructed flow field eliminates smaller-scale flow structures from the original field, emphasizing the smoother and highlighted larger-scale coherent structures.
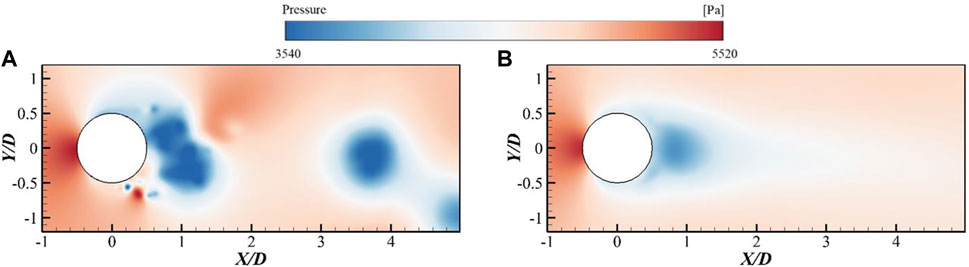
FIGURE 15. Flow field reconstruction at
4 Conclusion
The study based on the Proper Orthogonal Decomposition (POD) method reveals that, under both non-cavitating and cavitating conditions in the wake flow field around a cylinder, low-order modes correspond to large-scale flow structures with relatively high energy and predominantly single frequencies. As the modal order increases, smaller-scale flow structures with higher frequencies and more complex frequency compositions emerge, accompanied by a decrease in modal coefficients’ amplitudes, indicating a relatively minor impact of high-order modes on the flow field. However, under cavitation conditions, the presence of cavitation bubbles in the flow field leads to a more pronounced deformation of the vortex structures in the low-order modes compared to the non-cavitating case. Additionally, modes with similar flow field structures have higher modal orders under cavitation conditions. Moreover, the energy content of low-order modes is significantly greater under cavitation conditions than under non-cavitating conditions. Furthermore, under non-cavitating conditions, the dissipation of pressure energy in the wake flow field around the cylinder occurs faster than the dissipation of kinetic energy. In contrast, under cavitation conditions, the dissipation of kinetic energy occurs more rapidly than the dissipation of pressure energy.
Data availability statement
The raw data supporting the conclusion of this article will be made available by the authors, without undue reservation.
Author contributions
GZ: Funding acquisition, Project administration, Resources, Supervision, Writing–original draft. XY: Software, Writing–original draft. YL: Writing–review and editing. FG: Data curation, Methodology, Validation, Writing–review and editing.
Funding
The authors declare financial support was received for the research, authorship, and/or publication of this article. This research was funded by the National Natural Science Foundation of China (grant no. 52005224, 52306041) and the senior talents fund of Jiangsu University (No. 21JDG043).
Conflict of interest
The authors declare that the research was conducted in the absence of any commercial or financial relationships that could be construed as a potential conflict of interest.
Publisher’s note
All claims expressed in this article are solely those of the authors and do not necessarily represent those of their affiliated organizations, or those of the publisher, the editors and the reviewers. Any product that may be evaluated in this article, or claim that may be made by its manufacturer, is not guaranteed or endorsed by the publisher.
References
Arndt, R. E. (1981). Cavitation in fluid machinery and hydraulic structures. Annu. Rev. Fluid Mech. 13, 273–326. doi:10.1146/annurev.fl.13.010181.001421
Berger, E., and Wille, R. (1972). Periodic flow phenomena. Annu. Rev. Fluid Mech. 4, 313–340. doi:10.1146/annurev.fl.04.010172.001525
Berkooz, G., Holmes, P., and Lumley, J. L. (1993). The proper orthogonal decomposition in the analysis of turbulent flows. Annu. Rev. Fluid Mech. 25, 539–575. doi:10.1146/annurev.fl.25.010193.002543
Brandao, F. L., Bhatt, M., and Mahesh, K. (2020). Numerical study of cavitation regimes in flow over a circular cylinder. J. Fluid Mech. 885, A19. doi:10.1017/jfm.2019.971
Chatterjee, A. (2000). An introduction to the proper orthogonal decomposition. Curr. Sci. 78 (7), 808–817.
Danlos, A., Ravelet, F., Coutier-Delgosha, O., and Bakir, F. (2014). Cavitation regime detection through proper orthogonal decomposition: dynamics analysis of the sheet cavity on a grooved convergent–divergent nozzle. Int. J. Heat. Fluid Flow. 47, 9–20. doi:10.1016/j.ijheatfluidflow.2014.02.001
Desai, A., Mittal, S., and Mittal, S. (2020). Experimental investigation of vortex shedding past a circular cylinder in the high subcritical regime. Phys. Fluids 32. doi:10.1063/1.5124168
Dobroselsky, K. (2019). “Applying PIV to study a fluid flow in the vicinity of a circular streamlined cylinder,” in Journal of Physics: Conference Series, Moscow, Russian (Bristol, England: IOP Publishing), 012015. doi:10.1088/1742-6596/1421/1/012015
Ghahramani, E., Jahangir, S., Neuhauser, M., Bourgeois, S., Poelma, C., and Bensow, R. E. (2020). Experimental and numerical study of cavitating flow around a surface mounted semi-circular cylinder. Int. J. Multiph. Flow. 124, 103191. doi:10.1016/j.ijmultiphaseflow.2019.103191
Gu, F., Huang, Y., and Zhang, D. (2021). Cavitation of multiscale vortices in circular cylinder wake at Re= 9500. J. Mar. Sci. Eng. 9 (12), 1366. doi:10.3390/jmse9121366
Gu, Y., Sun, H., Wang, C., Lu, R., Liu, B., and Ge, J. (2024). Effect of trimmed rear shroud on performance and axial thrust of multi-stage centrifugal pump with emphasis on visualizing flow losses. J. Fluids Eng. 146. doi:10.1115/1.4063438
Holmes, P. J., Lumley, J. L., Berkooz, G., Mattingly, J. C., and Wittenberg, R. W. (1997). Low-dimensional models of coherent structures in turbulence. Phys. Rep. 287, 337–384. doi:10.1016/S0370-1573(97)00017-3
Hu, B., Yao, Y., Wang, M., Wang, C., and Liu, Y. (2023). Flow and performance of the disk cavity of a marine gas turbine at varying nozzle pressure and low rotation speeds: a numerical investigation. Machines 11, 68. doi:10.3390/machines11010068
Kumar, P., Chatterjee, D., and Bakshi, S. (2017). Experimental investigation of cavitating structures in the near wake of a cylinder. Int. J. Multiph. Flow. 89, 207–217. doi:10.1016/j.ijmultiphaseflow.2016.09.025
Lei, T., Shan, Z. B., Liang, C. S., Chuan, W. Y., and Bin, W. B. (2014). Numerical simulation of unsteady cavitation flow in a centrifugal pump at off-design conditions. Proc. Inst. Mech. Eng. Part C. J. Mech. Eng. Sci. 228, 1994–2006. doi:10.1177/0954406213514573
Lei, T., Zhifeng, X., Yabin, L., Yue, H., and Yun, X. (2018). Influence of T-shape tip clearance on performance of a mixed-flow pump. Proc. Inst. Mech. Eng. Part A J. Power Energy 232, 386–396. doi:10.1177/0957650917733129
Leonard, A., and Koumoutsakos, P. (1993). High resolution vortex simulation of bluff body flows. J. Wind Eng. Ind. Aerodyn. 46, 315–325. doi:10.1016/b978-0-444-81688-7.50035-8
Li, Y., Zhou, D., and Yu, A. (2019). Research of swirl cavity flow performance in the draft tube of pump turbine. Renew. Energy Resour. 37, 303–309. doi:10.13941/j.cnki.21-1469/tk.2019.02.023
Liu, Y., Han, Y., Tan, L., and Wang, Y. (2020). Blade rotation angle on energy performance and tip leakage vortex in a mixed flow pump as turbine at pump mode. Energy 206, 118084. doi:10.1016/j.energy.2020.118084
Lumley, J. L. (1967). The structure of inhomogeneous turbulent flows. Atmos. Turbul. radio wave Propag., 166–178.
Miyanawala, T. P., and Jaiman, R. K. (2019). Decomposition of wake dynamics in fluid–structure interaction via low-dimensional models. J. Fluid Mech. 867, 723–764. doi:10.1017/jfm.2019.140
Norberg, C. (2003). Fluctuating lift on a circular cylinder: review and new measurements. J. Fluids Struct. 17, 57–96. doi:10.1016/S0889-9746(02)00099-3
Sadri, M., and Kadivar, E. (2023). Numerical investigation of the cavitating flow and the cavitation-induced noise around one and two circular cylinders. Ocean. Eng. 277, 114178. doi:10.1016/j.oceaneng.2023.114178
Sirovich, L. (1987a). Turbulence and the dynamics of coherent structures. I. Coherent structures. Q. Appl. Math. 45, 561–571. doi:10.1090/qam/910462
Sirovich, L. (1987b). Turbulence and the dynamics of coherent structures. II. Symmetries and transformations. Q. Appl. Math. 45, 573–582. doi:10.1090/qam/910463
Smith, S. M., Venning, J. A., Pearce, B. W., Young, Y. L., and Brandner, P. A. (2020). The influence of fluid–structure interaction on cloud cavitation about a flexible hydrofoil. Part 2. J. Fluid Mech. 897, A28. doi:10.1017/jfm.2020.323
Tan, L., Zhu, B., Wang, Y., Cao, S., and Gui, S. (2015). Numerical study on characteristics of unsteady flow in a centrifugal pump volute at partial load condition. Eng. Comput. 32, 1549–1566. doi:10.1108/ec-05-2014-0109
Utturkar, Y., Wu, J., Wang, G., and Shyy, W. (2005). Recent progress in modeling of cryogenic cavitation for liquid rocket propulsion. Prog. Aerosp. Sci. 41, 558–608. doi:10.1016/j.paerosci.2005.10.002
Wang, Y., Chen, J., and Xian, S. (2014). Analysis of square cylinder unsteady flow at low Reynolds number with POD method. J. Northwest. Polytech. Univ. 32 (4), 612–617.
Williamson, C. H. (1996). Vortex dynamics in the cylinder wake. Annu. Rev. Fluid Mech. 28, 477–539. doi:10.1146/annurev.fl.28.010196.002401
Keywords: cylinder wake, cavitation, mode, vortex, proper orthogonal decomposition
Citation: Zhang G, Yang X, Li Y and Gu F (2023) Numerical investigation on the cavitating wake flow around a cylinder based on proper orthogonal decomposition. Front. Energy Res. 11:1340063. doi: 10.3389/fenrg.2023.1340063
Received: 17 November 2023; Accepted: 01 December 2023;
Published: 29 December 2023.
Edited by:
Yongfei Yang, Nantong University, ChinaCopyright © 2023 Zhang, Yang, Li and Gu. This is an open-access article distributed under the terms of the Creative Commons Attribution License (CC BY). The use, distribution or reproduction in other forums is permitted, provided the original author(s) and the copyright owner(s) are credited and that the original publication in this journal is cited, in accordance with accepted academic practice. No use, distribution or reproduction is permitted which does not comply with these terms.
*Correspondence: Fadong Gu, MjExOTExMDA0QHN0bWFpbC51anMuZWR1LmNu